what is algo-based trading and how it can be profitable ?**Algo-based trading** (short for **algorithmic trading**) refers to the use of computer algorithms to automate the process of placing trades in the financial markets. These algorithms are based on predefined sets of rules and mathematical models that are designed to analyze market data, execute trades, and manage portfolios. Algo trading is primarily used in stock markets, forex, and cryptocurrency markets, where the speed and efficiency of computers can outperform human traders.
### **How Algo-Based Trading Works:**
1. **Algorithm Design**:
- The trader or programmer defines a set of rules or a mathematical model based on market data (such as price, volume, historical data, or other technical indicators).
- The algorithm can be as simple as buying when a certain price level is reached or as complex as statistical arbitrage strategies that look for mispricing between correlated assets.
2. **Execution**:
- Once the algorithm identifies an opportunity based on the input data and rules, it automatically sends orders to execute the trade without any human intervention. These orders can be placed in milliseconds, much faster than human traders.
3. **Strategies Used in Algo Trading**:
- **Trend-following algorithms**: These algorithms analyze market trends and execute buy or sell orders based on signals of an ongoing trend.
- **Mean reversion**: These algorithms assume that prices will eventually return to a historical average or "mean," so they open positions when a price deviates significantly from its average.
- **Arbitrage**: Involves exploiting price discrepancies between two or more markets. For example, if an asset is priced differently on two exchanges, an algorithm can automatically buy the asset where it's cheaper and sell it where it's more expensive.
- **Market-making**: This strategy involves placing buy and sell orders on both sides of the order book to profit from the bid-ask spread. Market-making algorithms provide liquidity to the market by continuously buying and selling assets.
- **Sentiment analysis**: Some algorithms use natural language processing (NLP) to analyze news, social media, and other data sources to detect market sentiment and trade based on perceived market mood.
### **Advantages of Algo-Based Trading:**
1. **Speed and Efficiency**:
- Algo trading can execute thousands of trades per second, much faster than humans, allowing for **high-frequency trading** (HFT). This speed can be particularly beneficial in markets that move rapidly or when large amounts of data need to be analyzed in real time.
- Algorithms can detect market opportunities and execute trades instantly without waiting for human analysis, reducing the chances of missing profitable opportunities.
2. **Reduced Emotional Bias**:
- One of the significant advantages of algo trading is its ability to eliminate **emotional biases** from trading decisions. Unlike human traders, algorithms follow their predefined set of rules and avoid decisions based on fear, greed, or impatience.
- This can lead to more consistent and disciplined trading behavior, avoiding common pitfalls such as overtrading, chasing losses, or panicking during market volatility.
3. **Backtesting and Optimization**:
- Algorithms can be backtested using historical data to assess their performance. Traders can simulate how the algorithm would have performed in the past, helping to identify strengths and weaknesses before live implementation.
- Algorithms can be continuously optimized to adapt to changing market conditions, ensuring they remain profitable over time.
4. **24/7 Trading**:
- Algo-based trading can run continuously without breaks, even in markets that operate around the clock (like forex or cryptocurrency). This allows traders to take advantage of opportunities at any time, without having to monitor the markets constantly.
5. **Reduced Transaction Costs**:
- **Lower transaction costs**: Algo trading can help reduce trading costs by optimizing the timing and size of trades. Algorithms can split orders into smaller parts (known as **smart order routing**) to minimize market impact and ensure that trades are executed at the best possible price.
- Algorithms can also reduce slippage (the difference between expected and actual trade price) by executing large trades efficiently and more accurately.
---
### **How Algo-Based Trading Can Be Profitable:**
1. **Identifying Market Inefficiencies**:
- Algo trading is often used to take advantage of **market inefficiencies** or **mispricings**. For instance, arbitrage strategies take advantage of price differences between markets or exchanges. When algorithms can spot these discrepancies quickly, they can capture profits before the market corrects itself.
2. **High-Frequency Trading (HFT)**:
- **High-frequency trading** involves executing a large number of orders in a very short period of time to profit from small price movements. These strategies often rely on complex algorithms and lightning-fast execution to capitalize on price inefficiencies.
- For example, HFT algorithms might profit from the tiny price fluctuations that occur during market open or close by trading large volumes and making small profits on each trade.
3. **Trend Following**:
- Algorithms can detect trends early on by analyzing large datasets, such as price patterns, volume, or moving averages. Once a trend is identified, the algorithm can enter positions with a high probability of success, allowing traders to ride the trend for potential profits.
- **Momentum strategies**: By identifying strong upward or downward trends, algorithms can maximize gains from momentum-driven moves.
4. **Scalping**:
- **Scalping** is a strategy that involves making many small profits on tiny price movements. Algorithms can automatically open and close positions multiple times within a day to capture these small but frequent profits. Scalpers often rely on speed, liquidity, and precise execution to profit from the bid-ask spread.
5. **Risk Management**:
- **Risk management** can be automated through algorithmic trading, ensuring that positions are adjusted based on predetermined risk thresholds. For example, algorithms can automatically place **stop-loss orders**, adjust **position sizes**, and implement **dynamic hedging strategies** to protect profits and minimize losses.
6. **Diversification**:
- Algo trading can facilitate **diversification** by spreading capital across multiple assets or markets. This helps in reducing risk by ensuring that no single trade or market exposure can significantly impact the overall portfolio.
---
### **Challenges and Risks of Algo-Based Trading:**
1. **Overfitting and Optimization Risk**:
- Algorithms that are over-optimized or “overfitted” to historical data may perform well in backtests but fail in live markets due to changing market conditions. This is a common risk in algorithmic trading and requires continuous optimization and adjustment.
2. **Market Volatility and Flash Crashes**:
- Algorithms can sometimes amplify market volatility, especially during moments of extreme price movements. In some cases, this can lead to a **flash crash**, where a sudden and sharp market drop occurs due to high-speed algorithmic trading.
- If algorithms are not designed to handle these situations, they could lead to substantial losses.
3. **Technological Failures**:
- **System errors** or **technical glitches** (such as network failures, connectivity issues, or hardware malfunctions) can result in trading losses. Without proper monitoring, algorithmic trading can lead to unintended consequences, including missed opportunities or poorly executed trades.
4. **Regulatory and Market Impact**:
- Some markets have started to regulate algorithmic trading due to concerns about its impact on liquidity and fairness. It's important to be aware of regulatory requirements in different jurisdictions, especially for strategies like high-frequency trading.
- Market manipulation concerns can arise if algorithms behave in ways that unfairly distort prices or provide an advantage over traditional traders.
5. **Liquidity Risks**:
- Algorithms depend on liquidity to execute trades at desired prices. In markets with low liquidity, algorithms may struggle to execute trades efficiently, resulting in slippage and lower profitability.
---
### **How to Get Started with Algo-Based Trading:**
1. **Learn Algorithmic Trading Basics**:
- Familiarize yourself with concepts like market orders, limit orders, order book dynamics, and risk management principles.
- Study popular trading strategies like mean reversion, trend following, and statistical arbitrage.
2. **Choose a Trading Platform**:
- There are several trading platforms that support algorithmic trading, such as **MetaTrader**, **Interactive Brokers**, **QuantConnect**, and **AlgoTrader**. Make sure the platform provides access to historical data, backtesting tools, and order execution capabilities.
3. **Programming Skills**:
- Many algorithms are coded in programming languages like **Python**, **C++**, or **R**. Learning these languages will allow you to build your custom trading algorithms or tweak existing ones.
- Several libraries and frameworks, like **QuantLib** and **Pandas** (for Python), can help in developing and testing trading strategies.
4. **Start with Backtesting**:
- Before live trading, backtest your algorithms using historical data to see how well they would have performed in the past. This helps identify flaws and refine strategies.
5. **Start Small and Scale Gradually**:
- Once you're confident in your algorithm’s performance, start with small position sizes and low leverage. Gradually scale as you gain experience and confidence in the algorithm’s ability to execute profitable trades.
---
In summary, **algo-based trading** can be highly profitable when used correctly. It provides speed, precision, and the ability to exploit market inefficiencies that human traders might miss. By combining advanced mathematical models, automation, and data analysis, algorithmic trading can offer substantial returns, particularly in markets with high volatility or liquidity. However, it’s essential to understand the risks, constantly optimize strategies, and implement effective risk management to maintain profitability in the long run.
TATAMOTORS trade ideas

what is rsi and how it is useful?The **RSI (Relative Strength Index)** is a popular momentum oscillator used in technical analysis to measure the strength and speed of a price movement. It was developed by **J. Welles Wilder** and is used to determine whether an asset is overbought or oversold, helping traders identify potential reversal points or continuation signals.
### 1. **How RSI Works**:
- The RSI is calculated using the formula:
\
Where **RS** (Relative Strength) is the average of **n** days' up closes divided by the average of **n** days' down closes.
- **RS = (Average Gain) / (Average Loss)** over a specified period, typically 14 periods (which is the default setting).
- The RSI ranges from **0 to 100**, and the most commonly used levels for interpreting the RSI are:
- **Overbought**: RSI above 70, indicating that the asset may be overbought and a price correction or reversal could happen.
- **Oversold**: RSI below 30, suggesting that the asset may be oversold, and a potential upward reversal or bounce could occur.
However, the overbought and oversold levels are not absolute; they vary depending on the asset, market conditions, and timeframe.
### 2. **RSI Interpretations**:
- **RSI above 70 (Overbought)**:
- An RSI above 70 suggests that an asset may be **overbought**, meaning it has experienced a strong rally and could be due for a pullback or price correction.
- However, assets can remain overbought for extended periods in strong uptrends, so it doesn't necessarily mean the asset will reverse immediately.
- **RSI below 30 (Oversold)**:
- An RSI below 30 indicates that an asset may be **oversold**, meaning it has likely experienced a sharp decline and could be due for a rebound.
- Like overbought conditions, oversold conditions can persist for a while in strong downtrends, so caution is advised when interpreting oversold readings.
- **RSI between 30 and 70**:
- An RSI between 30 and 70 indicates that the asset is **neither overbought nor oversold**. In this range, the market is often considered to be in a neutral state, where trends can continue or pull back based on other factors.
### 3. **How to Use RSI in Trading**:
- **Overbought/Oversold Conditions**:
- **Buy Signal**: When RSI falls below 30 (oversold) and then crosses back above it, it may signal a **potential buying opportunity**, suggesting a reversal or a bounce.
- **Sell Signal**: When RSI rises above 70 (overbought) and then crosses below it, it could indicate a **potential selling opportunity**, suggesting that the asset might reverse or experience a pullback.
- **Divergence**:
- **Bullish Divergence**: Occurs when the price forms a lower low, but the RSI forms a higher low. This can indicate that the downward momentum is weakening, and a potential upward reversal may occur.
- **Bearish Divergence**: Occurs when the price forms a higher high, but the RSI forms a lower high. This suggests that the upward momentum is weakening, and a potential downward reversal may occur.
- **RSI with Trendlines**:
- Traders can also draw **trendlines** on the RSI chart itself. If RSI breaks a trendline to the upside in a downtrend, or to the downside in an uptrend, it could signal a shift in momentum or a potential reversal in price.
- **RSI and Trend Confirmation**:
- **RSI in Uptrends**: In an uptrend, the RSI tends to stay above 30 and often fluctuates between 40 and 70. Traders may wait for an RSI pullback to 40–50 as a potential buying opportunity.
- **RSI in Downtrends**: In a downtrend, the RSI often stays below 70 and fluctuates between 30 and 60. A rally in the RSI towards 60 or 70 might provide a potential sell opportunity.
### 4. **RSI Settings**:
- While the default setting for the RSI is 14 periods, traders can adjust this number depending on the timeframe they are analyzing.
- **Shorter periods (e.g., 7 or 10)** will make the RSI more sensitive, providing more signals but also more noise.
- **Longer periods (e.g., 21 or 28)** will make the RSI smoother and less responsive, which might be better for identifying longer-term trends.
### 5. **Example of Using RSI in Trading**:
- Suppose you are analyzing a stock in an uptrend. The stock price has been rising steadily for the past few days, and the RSI reaches above **70**, indicating overbought conditions.
- You might wait for the RSI to **drop below 70**, and then look for a **bearish reversal candle** (e.g., a doji or engulfing candle) on the price chart. This could be a signal to sell or short the stock, anticipating a pullback.
- Alternatively, in a downtrend, the RSI falls below **30**, indicating the stock is oversold. After a brief rally, the RSI crosses back above **30**, and the stock starts showing signs of support. This could be a potential buy signal.
### 6. **RSI Limitations**:
- **False Signals in Strong Trends**: In strong trends (both up and down), RSI can remain in overbought (above 70) or oversold (below 30) territory for extended periods. Traders should be cautious and not rely solely on RSI signals in such conditions.
- **Lagging Indicator**: Like many technical indicators, RSI is a **lagging indicator**—it reacts to price changes, rather than predicting them. This can sometimes result in late signals.
- **Range-Bound Markets**: RSI is most effective in range-bound or consolidating markets. In trending markets, the oscillator can be less reliable, as prices can remain in overbought or oversold conditions for long periods.
### 7. **Combining RSI with Other Indicators**:
- **Moving Averages**: Use RSI with moving averages (e.g., 50-day, 200-day) to confirm trends. For example, you might wait for an RSI confirmation after the price crosses above a moving average.
- **MACD (Moving Average Convergence Divergence)**: Combining RSI with the MACD indicator can give better clarity on the trend's strength and momentum.
- **Support and Resistance Levels**: Use RSI in conjunction with support and resistance levels. A reversal from overbought or oversold conditions near key price levels can be more significant.
### 8. **Conclusion**:
The RSI is a versatile and widely used momentum oscillator in technical analysis. It helps traders gauge whether an asset is overbought or oversold and identifies potential reversal points or trend continuations. While the RSI is effective in many market conditions, it’s important to use it in conjunction with other indicators and tools, and to consider the overall market context, especially during strong trends. Proper risk management is essential when using RSI to ensure the best trading decisions.

TatamotorsTataMotors has formed Wyckoff Distribution Schematic 2
it may try to bounce one last time before going further down

how to ride the big moves in the stock market ?Riding big moves in the stock market is every trader and investor's goal. The key is to identify potential large moves early, stay patient, and manage risk effectively. It requires a combination of strategy, patience, and discipline to maximize profits while minimizing losses. Here’s a breakdown of how to go about it:
### 1. **Identify Strong Trends Early**
To ride big moves, you need to spot strong trends early before they reach their peak.
- **Trend Identification**: Look for assets with strong upward or downward momentum. You can use technical indicators like:
- **Moving Averages** (e.g., 50-day, 200-day) to identify the prevailing trend.
- **Trendlines**: Draw trendlines to confirm that the price is moving in a clear direction (higher highs and higher lows for an uptrend, lower highs and lower lows for a downtrend).
- **Moving Average Convergence Divergence (MACD)**: This indicator can help confirm a strong trend when the MACD line crosses above (bullish) or below (bearish) the signal line.
- **Breakouts**: Watch for breakouts from key support or resistance levels, especially after periods of consolidation. Breakouts signal that the stock might move significantly in one direction. You can use **volume** to confirm that a breakout is legitimate (higher volume on the breakout suggests strong buying/selling interest).
- **Volume Analysis**: Volume is critical in understanding whether a big move is likely. A surge in volume often precedes significant price movements. If the stock starts to move with increasing volume, it’s more likely to sustain the move.
### 2. **Use Trend Following Strategies**
Once you've identified a trend, the key to riding the big move is to stay in the trade as long as the trend remains intact.
- **Trailing Stop-Losses**: Set a trailing stop-loss that moves with the price to lock in profits while still allowing for more upside potential. This method helps you stay in the trade without worrying about sudden reversals while protecting profits as the price rises.
- **Indicators for Trend Continuation**:
- **Relative Strength Index (RSI)**: When RSI is below 70 (for long trades) or above 30 (for short trades), it indicates that the stock is not overbought or oversold, making it suitable for continuation.
- **Moving Average Crossovers**: For example, a 50-day moving average crossing above a 200-day moving average (Golden Cross) can signal the start of a longer-term trend.
- **Position Sizing**: As the trend develops and you’re confident in it, you can scale into your position gradually, using a larger position size to capitalize on bigger moves while managing your risk.
### 3. **Use Momentum Indicators**
Momentum indicators can help you stay in the trade longer and confirm the strength of a move.
- **Momentum Oscillators** like the **Stochastic Oscillator** or **RSI** can indicate when an asset is overbought or oversold. However, be careful—these indicators work best in trending markets, as overbought conditions in strong uptrends can still lead to higher prices.
- **Average True Range (ATR)**: ATR helps to assess the volatility of a stock. In big moves, ATR can be used to set wider stop-losses, allowing you to stay in the trade without getting stopped out too early due to normal market fluctuations.
### 4. **Use Fundamental Analysis for Long-Term Moves**
Fundamentals can drive long-term trends, and keeping an eye on them will help you spot big moves well in advance.
- **Strong Earnings Growth**: Companies with consistent earnings growth tend to see their stock prices rise over time. Look for stocks with rising earnings per share (EPS), improving profit margins, and strong guidance.
- **Breakout Catalysts**: Some stocks have catalysts, such as new product launches, mergers, or acquisitions, that can drive long-term movements. These events can result in a prolonged upward or downward trend.
- **Market Sentiment**: Broad market sentiment, economic cycles, and industry trends often fuel large moves. For instance, if a particular sector is gaining attention (e.g., renewable energy), it could drive a sector-wide rally.
### 5. **Be Patient and Avoid Chasing the Market**
Patience is key to riding the big moves.
- **Avoid FOMO**: Fear of missing out (FOMO) can lead you to chase after a stock that has already moved significantly, potentially causing you to buy at the peak. Instead, focus on finding opportunities when the price corrects or consolidates before the next big move.
- **Let the Trend Run**: Once you're in a trade, avoid the temptation to take profits too early. Let the stock reach its potential based on your analysis. If you believe in the trend, give it time to play out.
- **Stay Disciplined**: Stick to your trading plan, and do not deviate based on emotions. Don’t let fear or greed cause you to exit too early or hold too long without reassessing the trend.
### 6. **Leverage Risk Management**
To ride big moves, you need to effectively manage your risk so you can stay in the game.
- **Stop-Losses**: Set stop-loss orders to limit your downside. They help you stay in the trade during normal fluctuations but exit if the price reverses drastically. You can adjust your stop-loss levels as the trend continues in your favor.
- **Risk/Reward Ratio**: Ensure you have an optimal risk/reward ratio. For example, aim for a risk-to-reward ratio of 1:3 or better, meaning you risk $1 to make $3 or more. This ensures that even if some trades don’t work out, the profitable ones will compensate for losses.
- **Position Sizing**: Make sure your position size is in line with your overall risk tolerance and portfolio size. You want to capture big moves but avoid taking on too much risk on any single trade.
### 7. **Ride Big Moves with Options (Advanced)**
For those who want to amplify their potential profit from big moves, options trading can be a powerful tool. However, this requires experience and understanding of risk.
- **Call Options**: In a strong uptrend, buying call options allows you to profit from the upward movement of a stock without actually owning the stock.
- **Put Options**: If you are anticipating a downtrend, put options allow you to benefit from the decline in a stock’s price.
- **Option Spreads**: You can use option spreads to limit risk while still participating in big moves.
### 8. **Market Conditions and Timeframes Matter**
Big moves can happen across different timeframes, whether you're trading on an intraday basis or investing long-term.
- **Short-Term Moves (Day Trading)**: If you're day trading, you need to be extremely fast and nimble. Use tools like momentum indicators, volume analysis, and price action to catch big moves within the trading day.
- **Long-Term Moves (Swing or Position Trading)**: If you're in for the long haul, focus on daily or weekly charts and use fundamental analysis, trend-following techniques, and patience. Big moves in stocks can sometimes take months or years to materialize, so longer-term analysis is critical.
### 9. **Monitor and Adjust**
Once you’ve identified a big move, it’s important to continue monitoring the stock and the broader market.
- **Stay Updated**: Pay attention to earnings reports, news, and market changes. Big moves can sometimes be triggered by external factors like government policies, economic reports, or global events.
- **Reassess When Necessary**: If the trend shows signs of weakening (e.g., decreasing volume, reversal patterns), it might be time to adjust your position, lock in profits, or exit the trade.
### Conclusion:
Riding big moves in the stock market requires a combination of **patience, discipline, and strategy**. By identifying strong trends early, using trend-following strategies, managing risk, and staying focused on your goals, you can position yourself to capture large market moves. Always remember that big moves don't happen every day, so being patient, waiting for the right setups, and managing your trades effectively are keys to long-term success.

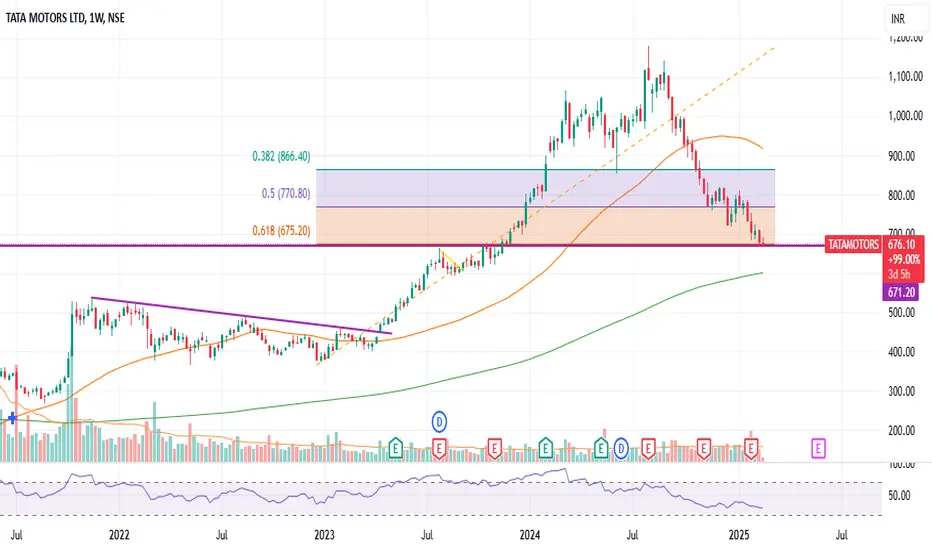
Turnaround time for TATAMOTORS?#Tatamotors is at perfect level of 0.618 and also at previous breakout level. We can see good upside in short term in the stock. RR is also favourable.
what is support and resistance and why it is important ?**Support and resistance** are fundamental concepts in **technical analysis** and are used by traders to identify key levels on a price chart that help predict where price action may reverse or stall.
Here’s a breakdown of what they mean and why they are crucial in trading:
---
### **1. What is Support?**
- **Support** is the price level at which an asset (stock, commodity, index, etc.) tends to **find buying interest** as it falls.
- In other words, it’s the level where demand is strong enough to prevent the price from declining further.
- Think of support as the **floor** that keeps prices from falling below a certain level.
#### **Characteristics of Support**
- Support levels are often identified by observing past price movements where the price has repeatedly bounced back up.
- **Horizontal Support**: This is the most common form of support, where the price tends to reverse direction after reaching a certain level.
- **Dynamic Support**: This is where the support line slopes (often following a trend) and moves with the price over time.
#### **Example**:
If a stock falls to ₹1,000 and bounces back multiple times when reaching that price, ₹1,000 is considered a **support level**.
---
### **2. What is Resistance?**
- **Resistance** is the price level at which an asset tends to **find selling interest** as it rises.
- It’s the level where selling pressure is strong enough to stop the price from rising further.
- Think of resistance as the **ceiling** that prevents the price from moving higher.
#### **Characteristics of Resistance**
- Resistance levels are identified when the price repeatedly fails to break through a particular level on the upside.
- **Horizontal Resistance**: This is a price level where the asset has been unable to exceed in the past.
- **Dynamic Resistance**: Like dynamic support, this resistance level moves along with the asset price over time.
#### **Example**:
If a stock rises to ₹1,500 but repeatedly falls back every time it hits that level, ₹1,500 is considered a **resistance level**.
---
### **3. Why are Support and Resistance Important?**
Support and resistance are crucial because they help traders make informed decisions about **entry**, **exit**, and **risk management**. Here's why they matter:
#### **1. Identifying Entry and Exit Points**
- **Buying near Support**: Traders often look for opportunities to buy when prices reach a support level, assuming the price will bounce back.
- **Selling near Resistance**: Traders might sell (or short) when the price nears a resistance level, expecting that the price will reverse downward.
#### **2. Predicting Price Reversals**
- Support and resistance levels represent areas where the price has historically reversed. If an asset approaches these levels, traders anticipate either a **bounce off** the level (reversal) or a **breakout** through the level.
#### **3. Understanding Market Sentiment**
- **Support** indicates that demand (buying interest) is strong at a certain price level.
- **Resistance** indicates that supply (selling pressure) is strong at a certain price level.
Traders use these levels to gauge the strength of market sentiment. For example, if the price breaks through resistance, it may signal **bullish sentiment**, and if it breaks through support, it may signal **bearish sentiment**.
#### **4. Helping in Trend Analysis**
- In a **bullish market (uptrend)**, support levels tend to rise as the price moves higher.
- In a **bearish market (downtrend)**, resistance levels tend to fall as the price moves lower.
- When prices consistently make higher highs and higher lows, **support** tends to rise. Similarly, in a downtrend, the price forms lower highs and lower lows, and **resistance** tends to fall.
#### **5. Stop-Loss and Take-Profit Placement**
- Traders use support and resistance levels to place stop-loss and take-profit orders.
- **Stop-Loss**: If a trader buys near support, they might place a stop-loss slightly below the support level to minimize losses if the price breaks below support.
- **Take-Profit**: If a trader is long near support, they may set a take-profit order near the next resistance level.
#### **6. Breakouts and False Breakouts**
- **Breakout**: When the price breaks through a **support** or **resistance** level with significant volume, it can indicate a **continuation** of the trend.
- **False Breakout**: If the price briefly moves above resistance or below support but then quickly reverses, it’s called a **false breakout**. Traders look for confirmation before making trades based on breakouts.
---
### **4. How to Identify Support and Resistance Levels?**
Here are a few common methods to identify these levels:
- **Previous Price Action**: The most reliable support and resistance levels are often formed by previous price highs and lows.
- **Trendlines**: Trendlines can act as dynamic support or resistance levels. An uptrend's support would typically be drawn along the **higher lows**, and a downtrend's resistance would be drawn along the **lower highs**.
- **Moving Averages**: Some traders use moving averages (such as the 50-day or 200-day moving average) as dynamic support and resistance levels.
- **Fibonacci Retracements**: Fibonacci levels often correspond to significant support or resistance levels, helping to identify areas of retracement within a trend.
- **Round Numbers**: Psychological factors play a role, and traders tend to see round numbers (like ₹1,000 or ₹2,500) as important support and resistance levels.
---
### **5. Support and Resistance in Different Market Conditions**
- **Bullish Market (Uptrend)**: In an uptrend, the price generally stays above support levels, and resistance levels shift higher as the trend progresses.
- **Bearish Market (Downtrend)**: In a downtrend, the price stays below resistance levels, and support levels continue to shift lower.
- **Range-Bound Markets**: In range-bound markets, the price oscillates between well-established support and resistance levels, providing opportunities for traders to buy at support and sell at resistance.
---
### **Conclusion**
Support and resistance are critical tools in **technical analysis** because they give traders a structured way to interpret market movements. By understanding where these levels exist, traders can make more informed decisions about when to enter and exit positions, manage risk, and capitalize on market trends.
While they are not always perfect and can be "broken" under extreme market conditions, they remain essential for successful **price prediction** and strategy development in trading.

What is rsi ? how to use it ?The relative strength index (RSI) is an indicator used in technical analysis to determine overbought and oversold conditions, which provides traders with buy and sell signals (when to enter and exit positions). Values above 70 indicate overbought conditions and those below 30 indicate oversold conditions.
To use the RSI indicator, check if the value is above 70 to show an asset is overbought, or below 30 to show it is oversold. Traders can use these signals to find possible trading opportunities.
Successful trades often occur when the RSI crosses above 30 (indicating a buy signal) or below 70 (indicating a sell signal). Adjusting the RSI period to 9 can make it more sensitive to price changes and be suitable for more active trading strategies.

Tata Motors - Weekly EW - Long Set-up5 wave down in C of 4 done.
Low risk trade. Play min for a pullback of 25%.
Trail to ATH.

Tatamotors - Can we expect to see a bounce from here?Tata Motors' stock has experienced a notable correction and is approaching a significant price zone where multiple timeframes—weekly, monthly, and quarterly—indicate a demand area. This region is often observed by traders and investors as a potential area of interest, where buying activity has historically emerged. While no outcome is certain, such zones are commonly analyzed to assess possible price reactions.

Is Tata Motors Ready for a Bullish Reversal?Timeframe: Daily
Tata Motors (NSE) has been in an expanded flat correction pattern for the past 11 months. In this pattern, the highest high (HH) was 1179, and the lowest low (LL) was 683.2. Currently, the price is trading below the 200, 100, and 50 EMA levels, indicating a bearish trend.
In this expanded flat correction:
Wave (A) completed at 855.4,
Wave (B) peaked at 1179,
Sub-wave 4 of Wave (C) touched 786.65,
Sub-wave 5 is now unfolding.
Once Wave 5 is completed, traders can look for buying opportunities with target levels at 799 – 951 – 1050+. First, it’s crucial to identify the end of Wave (C) to confirm the correction’s completion and a bullish reversal.
Projecting ending point of wave (C):
Wave (C) may end at 2.618% of Wave (A) around 628.7.
Wave 5 has multiple potential targets/support levels:
0.618 extension of Wave 1 at 526,
0.382 extension of Wave 1 at 628,
1.618 reverse Fibonacci of Wave 4 at 657,
2.618 reverse Fibonacci of Wave 4 at 562.
We will update further information soon.

Tata Motors-2-Chart AnalysisTata motors CMP:786.45; RSI: 36.35;
TATAMOTORS has completed 5 wave impulsive -Primary Bull cycle phase on weekly chart basis and now in corrective of ABC wave in formation . Corrective Wave-A has bottomed out and wave-B may give a swing trade opportunity for aggressive trader . This wave-B may take the Tata Motors shares at levels of 969-980 levels.
In Long term view is still avoid and fresh entry is suggested only for swing trade.
On daily chart basis, also 5 wave structure has formed as identified in chart structure, It suggest script will now reverse as it has entered wave-a formation.
Chart structure suggest a swing trade is open. The key crucial levels are listed below
Swing Trade Target 1: 969-980; Target 2: 1000-1020.
Stop Loss : 710
✅ For more trading ideas like this, please like, share, and follow my Idea Stream ✅

Tata Motors: Oversold and Near Support for Potential ReversalTopic Statement: Tata Motors has experienced a significant correction in recent months, approaching a crucial support level that could signal a potential turnaround.
Key Points:
1. The stock has corrected to the 61.8% retracement level, suggesting strong support at the current price level.
2. The price is near the 180-day moving average, indicating oversold conditions.
3. Weekly MFI is at 30, further confirming the stock is oversold.
4. The company reported a profit decline of -22% QoQ for the third quarter, which may cause the price to fall further, even below the 61.8% level.

High Confidence Building by Alternative Charting I have Been an advocate for alternative charting which are easy to understand then the
traditional charting bar or Candlestick
One can learn more about using alternative charting methods or noiseless charting method
to get to know about your stocks performance
if you have any Questions please comment below i will try to address it
Thanks

Tata Motors - Weekly EW (Updated Counts)- Analysis - Long Set-upSo, the last pullback was 4th down and we got 5th down today.
680 is 61.8% retracement of Wave 3 and a great entry point for a long trade.
At least A is done and we should play for a B up. Possible 15-20% upside.
Buy now, add around 682. SL 675.

TATA MOTORS - INVERTED H&S - 4HR CHART.Neckline breakout in Tata Motors may give a good move.
If you like my analysis, please follow me as a token of appreciation :)
in.tradingview.com/u/SatpalS/
For learning and educational purposes only, not a trading advice. Pls consult your financial advisor before investing.

view on Tata MotorsTata Motors
Current stock price: 707 as on 1/2/2025
The stock failed to take support at 717 level and made a low of 682, after a little bounce it is trying to test its resistance again. Max upside if it sustains above resistance is 742-772. If fails to hold 700-710 levels, stock will continue its downtrend below 684-634

Tata Motors in reverse gear since Aug -Can it go top gear soon? Tata Motors has slipped around 45% since August including today's fall of 7.5% post quarterly results. This is typical of a complex shareholding structure.
But is it time for it to shift gears quickly? Let this video anwer.

Buy the bad newsTata Motors CMP 701
Elliott- the C which is the most devastating has five waves. I have divided the same into 5 waves.
Fibs- the stock is also down to fib confluence. Hence it is at a good support.
Conclusion - stocks top and bottom on the day of some significant news in the counter. With todays bad quarterly results, in my view the bottom is made. Its a very very good buy here in my view.

Tata Motors - Yet to test the previous higher high swing!Better to wait for Tata motors to fall more and start accumulating from around 610 levels as it is close to the High high formation of previous swing from 2015, if it breaks don't panic buy more once it hits the purple trend line and finally at 550 levels!
Around 550 range it has an extreme strong support!
PS: Bad result came out today as well!

Tata Motors - Weekly EW Analaysis - Long Set-upWave A down is done, and B of Wave B up is done.
Play Wave C up for a +15% trade.

Tata Moters On Daily Time Frame AnaylysisTata Motors Limited, established in 1945 as the Tata Engineering and Locomotive Company (TELCO), is an Indian multinational automotive manufacturer headquartered in Mumbai, Maharashtra. As a flagship entity of the Tata Group, the company has evolved into a leading global automobile producer, offering a diverse range of vehicles including cars, utility vehicles, buses, trucks, and defense vehicles. ( (www.tatamotors.com))
**Global Presence and Operations**
Tata Motors operates in over 175 countries, with a significant international footprint. The company has manufacturing and assembly facilities in India, Argentina, South Africa, the United Kingdom, and Thailand. Additionally, it maintains research and development centers in India, South Korea, the United Kingdom, and Spain. ( (en.wikipedia.org))
**Subsidiaries and Joint Ventures**
The company's notable subsidiaries include:
- **Jaguar Land Rover**: A British luxury vehicle manufacturer.
- **Tata Daewoo**: A South Korean commercial vehicle manufacturer.
Tata Motors has also established joint ventures with:
- **Hitachi**: Forming Tata Hitachi Construction Machinery.
- **Stellantis**: Producing vehicle parts for Fiat Chrysler and Tata-branded vehicles.
( (en.wikipedia.org))
**Market Position**
In the commercial vehicle segment, Tata Motors holds the position of India's largest manufacturer, offering a comprehensive product and service portfolio across cargo and public transportation sectors. In the passenger vehicle market, the company ranks third in India. Notably, Tata Motors is a pioneer in India's electric vehicle (EV) transition, leading the market with a diverse range of integrated and smart e-mobility solutions. ( (www.tata.com))
**Financial Highlights**
As of the fiscal year 2023, Tata Motors reported a sales volume of 1,335,819 units on a consolidated basis, including figures from its joint venture with Chery Jaguar Land Rover (CJLR). The company employs approximately 81,811 individuals globally. ( (www.tatamotors.com))
**Leadership**
The company's leadership includes Natarajan Chandrasekaran as the Chairman and P.B. Balaji as the Chief Financial Officer. ( (en.wikipedia.org))
**Recent Developments**
In March 2024, Tata Motors announced a significant restructuring plan to split into two separate listed entities. This strategic move aims to enhance operational efficiencies and focus on distinct business segments, allowing each entity to pursue tailored growth strategies and attract specific investor bases. ( (en.wikipedia.org))
In January 2025, Tata Motors revealed plans to leverage locally-produced batteries to maintain its competitive edge in the EV market. The Tata Group is investing $1.5 billion in a battery gigafactory, expected to commence production in 2026, enabling greater control over lithium-ion battery supply and reducing costs. ( (www.reuters.com))
For more detailed information, you can visit Tata Motors' official website: ( (www.tatamotors.com))

Tatamotors - Max SL 748Tatamotors have seen major fall in last three months and it is currently trading at a very strong support levels, the chart should explain clearly where it is heading towards. The breakout of this stock is seen above 807 which can be seen near the earning schedule.
If the stock results performs well the stock can be trading at 860 in the January month. Do you analysis too, before getting into the trade.

Inverse head-and-shoulders - Tata MotorsThe inverse head-and-shoulders pattern :
is a major reversal signal that forms at the end of a downtrend.
It has three successive troughs, with the middle trough being the deepest.
