TATA Power again down scenarioNSE:TATAPOWER
Tata Power make again down scenario
price halt pivote point between 38% to 50%
Disclaimer: This analysis is for educational purposes only.
Please assess your own risk tolerance and conslut with a financial advisor before trading.
TATAPOWER trade ideas

Tata Power Date 05.02.2025
Tata Power
Timeframe : Day Chart
Remarks :
1 Forming bearish pole & flag pattern
2 Forming descending triangle flag
3 Pole & flag is supported by 5-3-5-3-5 wave pattern
4 Enter "shorts" moment price exits from flag
5 Keep targets as per extension drawn/plotted on charts for you all
6 Ideally wait for price to exit form descending flag, don't enter short in anticipation in advance
Regards,
Ankur

Long opportunity hereRSI making higher high but the price is in lower low order, but a buying move can be taken once price break the previous high

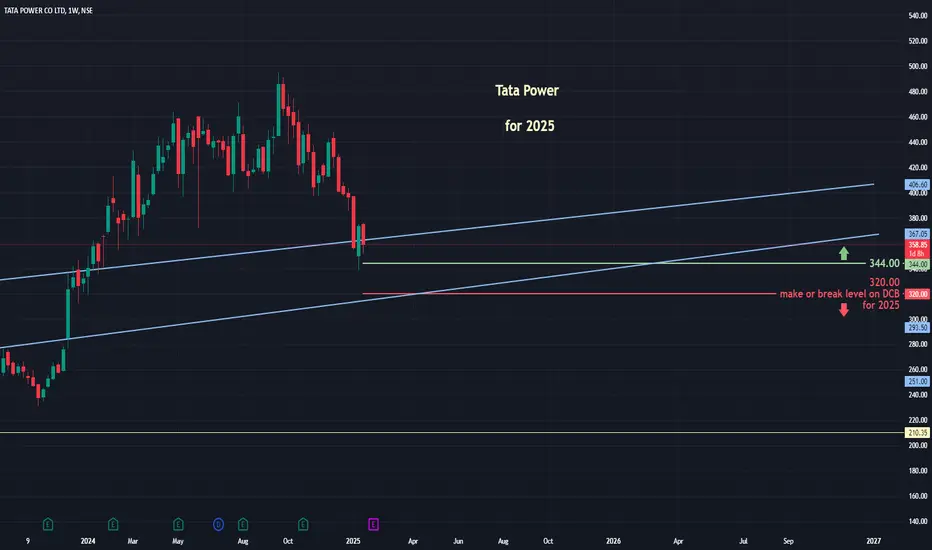
Tata Power...One of the most liked stock in power sector is Tata Power.
Almost down 25%+ from high of 495 in Sep 2024
made a low of 338 from 495
Fundamentally Strong
I have marked some important make or break levels on chart....
Happy Trading
Like.... Share and Subscribe
TATA POWER - Short & Long Term View- Wave AnalysisTATA POWER CMP: 428.45; RSI: 50.05
TATA Power in Primary bull cycle & in mid of impulse wave-3 in weekly chart basis. This, Primary Impulse wave-3, should take the price to levels of 646 (1.618x) in next 8-10 month of time frame. While wave within the wave, on shorter time frame, on daily chart frame, its middle of intermediate corrective wave-4, which may retrace the price till 365 to 330 levels in coming 3-4 months.
Value Buy level : 330-365;
Accumulation zone: 330-390;
Mid term target (Q1 FY: 25-26): 600-650
Long Term Target ( 3-4 Yrs): 850-900

Testing Key Support with Bearish MomentumTata Power is consolidating between 370 INR (support) and 470 INR (resistance). The MACD shows bearish momentum with a negative crossover and declining histogram. If 370 INR breaks, the next major support lies at 336 INR.
The weekly chart of Tata Power indicates a consolidation phase, with the stock trading between 370 INR (support) and 470 INR (resistance). Currently, the price is testing the S1 Fibonacci level (~370 INR), a critical support zone. The following are key observations:
Key Observations:
MACD Indicator:
A bearish crossover is evident, with the MACD line below the signal line.
The histogram is negative and declining, signaling strong bearish momentum.
Support and Resistance Levels:
Current Support: Immediate support is visible near 370 INR (S1 level).
Further Downside: If 370 INR breaks, the next critical support level lies around 336 INR (S2 Fibonacci level).
Resistance: The stock faces resistance near 470 INR (R1 level).
Price Action:
The stock is in a downward trend after failing to sustain above its range near 470 INR.
A potential breakdown below 370 INR could lead to further bearish action toward 336 INR, a strong historical support.
Possible Scenarios:
Bearish Continuation:
A breakdown below 370 INR would confirm bearish sentiment, with the next support at 336 INR.
Traders should watch for strong bearish candles to confirm this move.
Reversal Potential:
If the price consolidates or forms reversal patterns like a hammer or bullish engulfing near 370 INR or 336 INR, it could indicate a potential recovery toward the upper range.
Conclusion: Tata Power is currently at a crucial support zone. A breakdown could lead to further downside, with the next key level at 336 INR. However, any signs of a reversal could present an opportunity for recovery. Traders and investors should monitor price action closely near these levels.

Tata Power Chart AnalysisAs per the chart analysis we can see that tata power is showing sideways to bearish scenario. please read the description on chart to understand more

TATA POWER - TRENDLINE RESISTANCE - 2HR CHART.Tata Power has given Breakout of the Trendline, crossed 13ema, there is probability of going up.
It may re-test before the reversal. It has reversed from an old support.
If you like my analysis, please follow me as a token of appreciation :)
in.tradingview.com/u/SatpalS/
For learning and educational purposes only, not a trading advice. Pls consult your financial advisor before investing.

TatapowerTatapower is on the verge of breaking near term first swing low.
this may initiated bearish dow theory on daily time frame.
watchout the bear for next 3 months

TATA POWER SWING TRADE | DAILY CHARTTATA POWER SWING TRADE
Hi trade this is chennel breakout and retest at level 420-415 in green candle
i will take entry with green candle low SL.
target 485,520
Note - Only for education purpose..
GIVE LIKE SHARE AND FOLLOW

TATA Power looks good in 432-435 range A long trade can be initiated considering a retest from 448 levels and ready for a move in the upside it can be bought in the range 432-435 for targets of 448+++453+++465+++ and 500+++ levels maintain your sl around 428-427 levels

A Good Bounce Can be Seen from the recent support zone.A Good Bounce Can be Seen from the recent support zone and the price has also broken above the resistance trendline with some good bullish momentum, and sighting the current changing market condition this can be the just right time to buy tata power in my opinion and we might see the resistance being broken this time after several failed retests.

this dip will be an opportunity Tata Power CMP 414
Elliott- there is one more wave C down of the double corrective pattern zig zag still due.
Fibs- 370 and 343 are the two zones to look for reversal. Fib ext too has the similar zones.
RSI - break of support at 45 is negative. the oscillator was in the bear zone while the stock made new highs is again negative. It will continue to fail below the averages.
MA- The rallies are failing below the averages. That's weakness.
Conclusion - this stock is in a strong bull trend and this dip will be an opportunity to buy this counter.

Tata power wave analysis Tata power completed wave 4 irregular flat correction and upside rally should start from here till 600

Tata Power - Near Strong Support412-410 Temporary support
402-400 Strong support
Expecting stock to come near 400 levels before turning around and turning bullish
Stock may pause a little before turning
Any close below 398 will negate the view
Expect at least 450+ as 1st target and 490 second if plays around well
Trade cautiously

TATAPOWER 1D TFNSE:TATAPOWER broke a trend line and is moving around a demand zone. The market need strength to break this demand zone hence waiting for the entry is good. If the market breaks the demand zone with a good candle or if a retracement occurs the entry could be taken.
We have discussed this more on our previous post. You can view the previous post by clicking the attachment below this post.
Disclaimer:- This analysis is only for educational purpose. Please always do your own analysis or consult with your financial advisor before taking any kind of trades

VIEW ON TATAPOWERBreakout on the stock
After some sideways move and a Red candle formed on 4 NOV, stock has closed above it today
Target 465/475
Stop loss 435
I am just representing my views
For educational purpose only.

VIEW ON TATA POWERBreakout on the stock
After some sideways move and a Red candle formed on 4 NOV, stock has closed above it today
Target 465/475
Stop loss 435
I am just representing my views
For educational purpose only.

VIEW ON TATA POWERBreakout on the stock
After some sideways move and a Red candle formed on 4 NOV, stock has closed above it today
Target 465/475
Stop loss 435
I am just representing my views
For educational purpose only.

Tata Power Breakout around 450 levels A long trade can be initiated in Tata power around 448-451 levels with sl around 442-445 levels for target of 461++ 471+++479+++485++493++501++++

TATA POWER#TATAPOWER Potential 10% upside
Swing Trade candidate
CMP 451
Target 495
Risk Reward 1:2
Strong RSI and good fundamental company

Tata Power for 20% gainsDate: 27 Sept’24
Stock: Tata Power
Timeframe: Daily chart
Tata Power seems to be in Wave V of 5 which is heading towards 580 levels (20% from current price of 485) as seen in the chart. It is then likely to go into a longer consolidation (a larger timeframe Wave 4) which I will analyse in due course. Likely to achieve this target by end of this year? (Yes, I would like to think so).
This is not a trade recommendation. Please do your own due diligence.

Triangle Breakout!!TRADING PSYCHOLOGY : The stock forms a triangle pattern when the tug of war between BULLS and BEARS is at the end stage where one is bound to give up.
AC line will act as resistance line.
BD line will act as support line.
when to trade : The candlestick has to break the support/resistance line with increasing volume to confirm the direction.
STOP LOSS: If the breakout is upwards then support line will act as stop loss.
If the breakout is downwards then resistance will act as stop loss.
PS : This is 15 minute candlestick chart so the targets are most likely to achieve in 1-2 days.
The accuracy of this strategy is 80%.
