TATAPOWER 100% Gain in 57 Days, Booked partial profit.On 2021.08.23 Shared buy TATAPOWER Between 127 to 129
And in 57 Days it has given 100% Return.
I am still holding the stock. and booked partial profit.
TATAPOWER trade ideas

MULTI YEAR BREAKOUTTATA Power is trading at its all time high, Same as the Energy sector which is stronger than other indices. this stocks has given a breakout from a very old resistance of year 2008. During the uptrend, volume has been building up since april 2020. In the weekly chart, breakout candle is very strong so for the entry trade can be taken at current levels with a SL of 135 (130 for a safer side)and expecting a target of 250, if price gives any retracement near 145 to 150 more quantity can be added. Since we are analyzing this stock on the weekly chart min time span for the target is 3 to 6 months.

TATA POWER GAVE 50 % RETURNS - TRIANGLETata Power gave a breakout of triangle.
It was constantly making consolidation in a triangle pattern and breaking out of it.
It's a very common pattern which can be seen in many stocks now, especially in a bull market.

Tata Power Multi Year BreakoutIt has broken the multi-year rectangle pattern. On the weekly chart also the stock is very bullish.

TATA MOTORS gap remaining In a field of green energy tata power making there all time High daily but tata motors left a gap !!

OVERVIEW AS LONG TERMMonthly chart closing basis in parallel channel.
if consider than almost done 50%upmove(T1) of expected
b.o. above channel.
and now approaching toward its ATH (which is 160 around )
but 142 as closing basis.
expected level with extended target as fibo given
as closing basis for long term with indicators.
one can decide on own.
just a overview at this point of time.
if it reach those levels monthly closing basis
than one may see review of pattern .

TARGET ACHEIVED IN TATA POWER !Target achieved in 3 days as mentioned in the analysis post. Hope you learned something! :) Cheers. You can also trail sl under the last big green candle and hold.

TATA POWER Tata Power's ATH of about 142 was made in late-2007
If it crosses 142, and chances are high of it doing so, it can go anywhere, even to 4 digits or near

TATA POWER BREAKOUT WITH GOOD VOLUME DELIVERYBreakout from resistance of 145.80 with good volume.
Relative Strength is STRONG, with good support at 118.
If this holds above 160 we can see 20-25% upside. #TrendIsYourFriend

Upmove has just startedTata Power saw a steep rise in price in last few sessions on the back of good volume
Rally is expected to continue towards 260-270+ . Any correction towards 180-175 will be an opportunity to go long with stop below 137 on DCB .
Disc : it's not an investment advice to buy or sell

TATA PowerTata Power multi year breakout. And it's a bullish Flag pattern an breaks in good volume support.
Educational purposes only


TATA POWER BREAK ALL TIME HIGHTata power break all time high and uptrend channel right time to enter,Target ur wish..
>EDUCATION PURPOSE ONLY

TATAPOWER S&R ANALYSISOnly for Education Purpose ::
Target 1-132.70
Target 2- 142.00
Target 3 - 159.60
SL-117
Time Frame 3 Months For All Targets

Elliott Wave analysis in TATA POWER !! we can see the chart off TATA POWER currently obeying three Wave of Elliott Theory
- Wave (2) retraces Wave (1) about 21% (we can call it as flat correction)
- Whereas Wave (3) retraces Wave (1) about 163% (which is exact % of Elliott Wave Theory)
- by the way we can expect Wave will retraces about 100% Wave (1) n , that will be short term Target of 210
- expected Wave (4) will retraces about 50 % n, here is our ENTRY in between 172 to 184
- with the STOPLOSS of 167 just below the crucial short term support level
- Volume also obeying with Elliott Wave Theory
- i hope that it will help a lot , do like n follow for more
have a nice day ...

BREAKOUT IN TATA POWER -- 2-3 DAY SWING TRADE As breakout is on 1H time frame this is a 2- 3 day trade max to max. Entry, sl and target are mentioned in the chart. Only enter when the current candle closes above the trend line. Enter at the high of the candle and keep sl at it's low. Target would be 1:2. Thanks. Cheers,

tatapower profit booing comes till 164,158 levelsTata power before going to fresh move profit booking comes that mentioned level below
164 and 158 levels.then to decide up or down.we will post chart later

TATA Power - Ascending TriangleAll trade ideas provided are the opinions of the publisher and should not in any way be considered as financial advice. Please do your own research and consult your advisor before investing in stock markets.


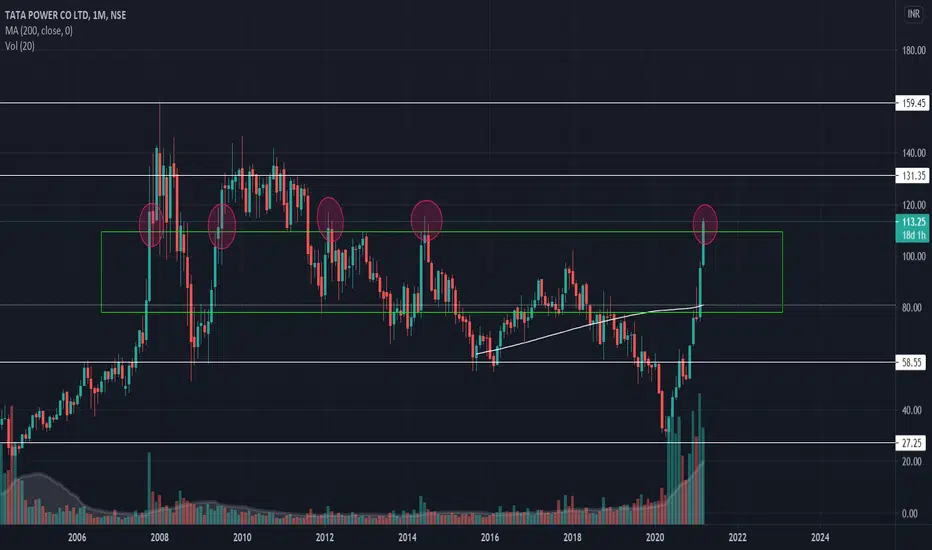
Tata Power Monthly chart Break Out from 2007 range.Analysis :-
1. 2007 old range break out on the monthly chart.
2. Monthly breakout is really strong.
3. Only things need to see the price action this whole month that it is sustainable or not. And then make Entry.
4. If it's in comes in old range then use buy om dip strategy.
5. Diploy not more than 3% to 5%.
Alert wait for breakout…..Triangular pattern formation. An opportunity just wait for the right time….


TATAPOWER I had this chart.But could not look in to it. and could not capitalize
channeling solves much of your problem.
of course I have great regard for Elliot wave.
Market profile helps in taking intraday trading decisions..
It appears to me rally of tata power is not yet over
as it is associated with electric vehicle in some way.
let us see when we can enter in to it.
want to connect with me?
