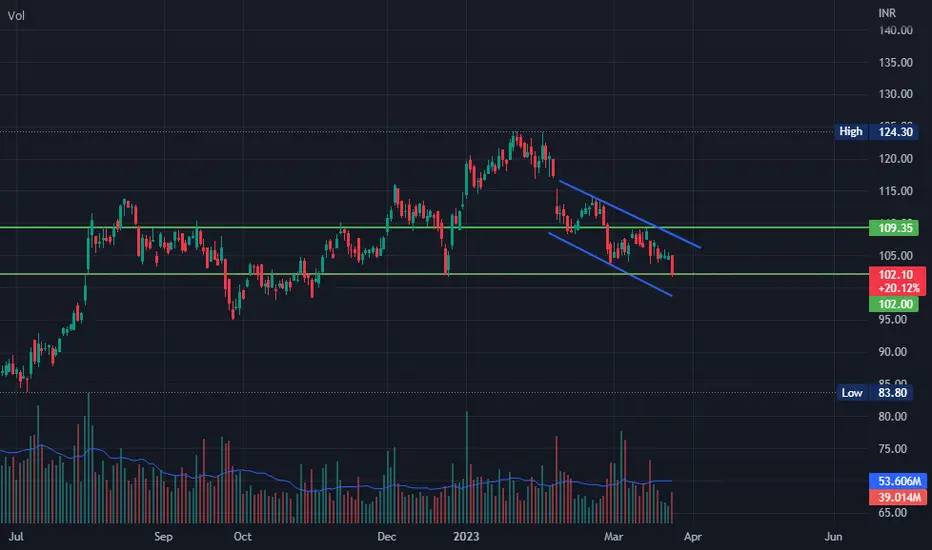
ALMIGHTY LONG OR SHORTHello friends I am sharing the Daily time frame chart of Tata Steel that is looking trading on very well placed horizontal support and stock is trying to make a new rising support trendline after breaking the old one and trading below from that sold support you can say it is standing on crucial spot and waiting for the next move for a directional trade in it by us so I try to prepare two trade ideas sharing below.
🎁🎁This is how we did work like home work after school classes it is easy to identify our tradeable levels in running markets without any hassle or trouble so always study more than trade.
IDEA 1💡- Long if break and close above the rising support trendline because it is acting as resistance now on daily candle basis for the target of 115 stop loss must be a closing below on this trendline.
IDEA 2💡- Short if break and close below the horizontal support trendline for the target of 95 stop loss must be a closing above on this trendline.
SECTOR INDEX ALSO LOOKING WELL PLACED ON SUPPORT 📊📈
📣📣📣📣NOTE-: This is not and trade or investment advice. This idea is meant for learning only. Invest your capital at your own risk
𝐑𝐞𝐠𝐚𝐫𝐝𝐬-: 𝐀𝐦𝐢𝐭 𝐑𝐚𝐣𝐚𝐧
TATASTEEL trade ideas

TATASTEEL near supportTATASTEEL near major support
For long (long term buyers) : can accumulate at this level.
For short (only for Futures & Option Traders) : can take short position, if price closes below 101 on daily timeframe, SL @ 103.75, TGT1 : 98.80, TGT2 : 95.80.
Please choose next month expiry for positional trades.
Note : It's your hard earned money always trade with SL, I'm just sharing my analysis

Tata Steel Triangle Pattern Breakdown! Symmetrical Triangle Pattern Formed On daily Chart With Weak Buy's And Shallowing RSI Indicating Further Weakness Upcoming Sessions. Sell ~ 108, With Stop ~ 102. Target ~ 94.50, Expected Target March Expiry.

On supportNSE:TATASTEEL
on crucial support level
this price has been tested many times and maybe act as a bullish divergence if the next two days it closes in green
Another lower's Low pattern can see on the chart and the closing price close at near crucial support if the support breaks then we may see the lower levels
buy tradebuying for target 111 and +
stop as per risk appetite
based on resistance cross theory
disclaimer - trade @ own risk

intraday
both side potential
avoid first 15min breakout
wait for 15 min candle closing
targets are marked
if the breakout comes after 10:00 am then the probability of winning will be more.
follow risk management
do your own analysis
do workout
do meditation
start reading books

TATA STEELTATA STEEL LOOKING GOOD FOR SWING.
𝐃𝐈𝐒𝐂𝐋𝐀𝐈𝐌𝐄𝐑:-
𝐓𝐫𝐚𝐝𝐞 𝐨𝐧 𝐲𝐨𝐮𝐫 𝐨𝐰𝐧 𝐑𝐢𝐬𝐤.
𝐈 𝐀𝐌 𝐍𝐎𝐓 𝐒𝐄𝐁𝐈 𝐑𝐞𝐠𝐢𝐬𝐭𝐞𝐫𝐞𝐝 𝐀𝐧𝐚𝐥𝐲𝐬𝐭.
𝐊𝐢𝐧𝐝𝐥𝐲 𝐜𝐨𝐧𝐭𝐚𝐜𝐭 𝐲𝐨𝐮𝐫 𝐟𝐢𝐧𝐚𝐧𝐜𝐢𝐚𝐥 𝐚𝐝𝐯𝐢𝐬𝐞𝐫 𝐛𝐞𝐟𝐨𝐫𝐞 𝐭𝐚𝐤𝐢𝐧𝐠 𝐚𝐧𝐲 𝐓𝐫𝐚𝐝𝐞.

Tata SteelInterestingly Poised to KILL both LONGS/SHORTS. A difficult trade to take on currently. @ alternates as plotted for you all to work upon

TATASTEEL Short Term Long opportunityDisclaimer: I am a beginner, this is purely educational purpose. I am not responsible either of your losses or gains.
TATASTEEL:
Looking bullish, narrow monthly CPR, and crossed 20 EMA.
Can enter CMP with target 130, SL 100,

tata steel price predictiontata steel is second large steel manufacturer in INDIA .TATA is good brand in INDIA.Share recently break its indecive candle to downside.it's strong support is at 106-100. My target is now 106.then change it's view behaviour of its chart pattern.update will be soon....

Tata Steel wave impulse formation Education purpose only: Tata Steel make minor degree wave 5 of wave (1). Try for long The trade level of analysis are mentioned in the chart

Opportunity to long Tata SteelTata steel is trading in a rising channel and currently placed at the bottom of the same channel.
Long position can be opened for the potential of 15% to 20% upside in coming months.
Stop-loss can be placed below the channel support on daily closing basis.
This idea is for education purpose only, please do your own analysis before entering any trade.

TATASTEEL an opportunity to rise!TATASTEEL is trading sideways at support. It appears that it is going to rise .

Tata Steel - Short Term SwingThis stock has been on my radar for days now been waiting for it to breakout
Here it is with good R:R
everything mentioned in chart
Trade only after ur own analysis

DOWNWARD CHANNEL - TATATSTEELShort side on Monthly Timeframe.
Short May Futures TATASTEEL and Sell Call options (110) MAR-2023.
Stop loss - 120.
Target - 89.


RIsing Wedge TATA STEEL keep an eye
stock look bearish
A stock was consolidate in RISING WEDGE
respect all the level
NOW it breakdown the level
keep an eye its looks good
just a view on tata steel

Tata SteelMonthly Chart wise bearish structure.
Descending Trangle Pattern.
Not SEBI registered. It's education purpose.

Breakout of the Darvas BoxA Clear Beakout and Retest of the Darvas Box is seen in Tata Chem. Hold the stock for long positions.

TATASTEEL buy at CMP 112.81. Head and Shoulder pattern
2. Breakout with huge volume
SL 109
First major resistance at 115.3
Target 115 and 118.
#TATASTEEL #NIFTY METAL


