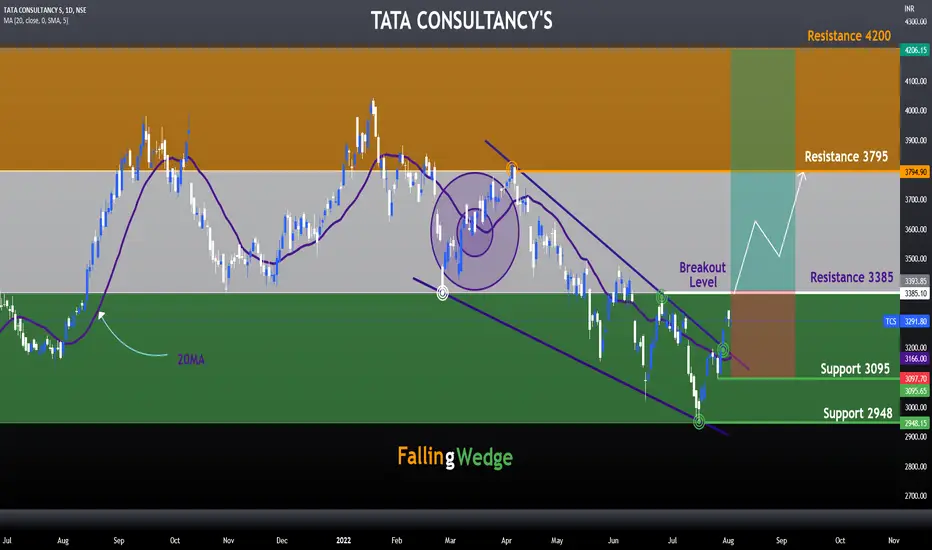
TCS Price Prediction -Aug'22In a daily time frame, TCS was observed in Falling Wedge Pattern Structure and Breakout also has done
The falling wedge is a bullish price pattern that represents a story about the market in which bulls are preparing for another push. A falling wedge pattern is bullish , although it appears after a bearish trend .The falling wedge pattern works as both a trend work as a trend reversal and a trend continuation pattern.If the falling wedge appears in a downtrend, it is considered a reversal pattern.
A falling wedge is an important technical formation that signals that the correction, or consolidation, has just ended as the asset’s price left the wedge to the upside and, in most cases, the continuation of the overall trend is taking place.
In Current structure we can see that the price has been higher than the 20 MA level ,which is good sign for Bullish and also price has given breakout above the resistance level talong with good volume accumulation.
Currently, TCS is at 3291 Rs , If the pattern continues , the price of TCS might reach the 3795 Rs level . If the trend reversed, then the price of TCS may fall to 3095 Rs level
Key Factor
Falling Wedge - Bullish Reversal Pattern
20MA - Price above 20 MA
Happy Trading ! Jai Hind !
Trade ideas
TCSTCS
If 15min bar closes above 3333, then we can expect target level at 3430 with stop loss level at 3250.
If 15min bar closes below 3252, then we can expect target level at 3180 with stop loss level at 3333.

would like to wait for levels not in hurry as of now.please refer to the chart.
Gratify if you appreciate the practice then you can like it, share it and
If you want me to investigate any chart for you then would cherish doing that for you.
Thank you for your time and support.
Stay safe.

TCS Shooting Star - Learning Pattern shooting Star
High 3317.30
1:1 ratio target 3247.
MACD Divergence Negative.
Time-frame 1H

very nice opportunity in tcs with full quantityfor understanding this trade, we have to consider very different aspects of charts on a different time frame...
first we see chart on 1d timeframe...
we have drawn 3 line...two dotted and one green line...
after 2 dotted line...we are considering this green line as a actual trend-line....because from green line...first time market is about to cross previous high...
that's why we neglected the previous two line...(dotted one)
but the risk to reward is poor in 1D time frame....
so we comedown to 1h time frame, where we can see small trend-line which is supporting upward direction move....when can also place stop loss below this trend-line .
we took this trade at 3284...for conservative way would be to take trade near trendline..which will be somewhere around 3180

TCS - LONG - 5% upside potentialTCS has given breakout from a falling wedge pattern. Usually this is formed at the end of downside, so looks like the upside journey begins from here on. Immediate target could be around 3450+ levels (positional).

TCS#Watchlist
#TCS (D):-CMP 3237.6 Looks Good Above 3250 For More Upsides :)
#Disclaimer:-View shared is for educational purposes only. Conduct your due diligence before making any trading or investment decisions.

#Tcs cash : Good above 3200.10#Tcs cash for 1 week
27.07.2022
Looks good above 3200.10
For 3240/3300
Stoploss 3175
Cmp 3188.85

Value Entry In : TCSNSE:TCS short term traders focus.
Let see the price action = descending channel pattern formed
let wait for breakout buy above 3175 level
fix your stop loss as per your R:R.
tell you opinion in comment section.

tcs following trendlineif tcs break that trendline and sustain below trendline, i expect tcs will go down

tcs looking good for swing We have a swing trading opportunity in TCS if TCS breaks the trendline and closes with the good volume we can enter in it with the sl of breakout andle.

RSI Convergance spotted in TCS Daily timeframe.As the title suggests, in daily timeframe of TCS there is a RSI convergence.
From 1st L H point TCS is falling but RSI is not making lower lows, rather RSI is making higher lows since June 25th.
And also 3000 price level is a support zone (Look at weekly chart).
Probably this stock is preparing for a short term up move, good swing opportunity.
First target would be 3200
and second target would be 3400.
Trailing SL is a must.

tcs - sell on risesell from cmp to 3096
easy tg - 3030
tg2 - 2980
Disclaimer : This is my personal analysis for study purpose not intended for trading

TCS_HL DOWN TREND BREAKOUT CONFIRMED?Tata Consultancy's down trend rally breakout confirmed in daily chart. Now trying to break price engagement. If price sustain above the price engagement at 3395 in daily chart, it begins new rally towards upward. Refer upcoming target 1&2.

Good time to buy IT stocks ? 17-07-2022detailed analysis on the IT stocks, recommended couple of good stocks to buy as well

TCS is is all about H&S and Triangle.Well these ideas were conceived by me before.
Recently the triangle breakdown was understood by me just one day after it declared its result.
These charts were with me.
Though the H&S target has been met,the triangle break dowm
points little lower..
this is my analysis not any trading recommenadtion.
H&S break down does not say the decline will stop at the target.
with Nasdaq movining here TCS may have bounce on Monday.
So only breaking the recent low,and sustaining below it, may take TCS to triangle breakdown target.
Don't forget to like my post.Follow me to get updates.

How Resistance Turns into A Support?Hi
You must have often heard that a resistance once taken out could act as a potential support level. Let us see through this chart how this happens.
Firstly there is a strong resistance zone on the left bottom of the chart, which is also 2019 high. Price took a knee jerk reaction from that level. Many traders would have bought near the highs in a bull market but now they are sitting in a loss. They would be thinking that as soon as the price comes back to their average price or cost, they would exit/sell.
1. Finally after the sharp bear phase, price rallies back to the 2019 highs. Now the above traders/investors would start selling at cost. Many new traders who think that price is at resistance would also start shorting (selling). Those who bought at lower prices would also try to book profits. So there is a flux of sell orders at that level. But wait! is that true?
2. Selling is there but buy orders are just overwhelming. Buyers are absorbing all the supply and managed to hold the reaction of selling. Or you can say that seller were not strong enough or buyers were stronger. If sellers are not strong and buyers are strong then what would happen? Tell me..... Yes you are right, the price would rally higher. And it did.
3. Now all those seller who acted at stage 1 would be shocked and want to book their loss at a better lower price. There are others who still think that this stock is weak and the BO is fake, so they start shorting. Price pulls back to the 2019 highs.
4. Now stage 1 sellers have a better opportunity to cover their loss, so they start buying. Left out buyers also start buying due to better bargain. Pullback buyers enter the market. This large flux of buying orders pushes the price higher and the rally resumes.
5. In this way, the prior resistance turns out to be a support for the stock.
This same psychology repeats at 6&7 where price holds previous resistance as a support.
Imho, Its always beneficial to see any market or chart from psychological point of view rather than merely patterns and signals. The same market psychology is true for how a support once broken, turns into a resistance.
Thanks for reading. I hope it would be useful.
Regards

tcs- look for one bounceBuy from 3064 to 3035
easy tg - 3100
tg2 - 3120
Disclaimer : This is my personal analysis for study purpose not intended for trading

TCS: Results, Chart set up and trading strategy TCS
- the zone of 3385-3420 has played an important role for the stock
From charts we observe that
- it acted as resistance in June 2021
- provided support between Aug 2021 - May 2022
- With results round the corner, the stock is trading 4-5% below that level at 3277
Given the setup,
one may consider to sell TCS 28 July expiry 3400 Call option currently around 37
The strategy has a 6% yield potential and covers for a rise up to 3437 till expiry
Take care & safe trading...!!!
Disclaimer
- The view expressed here is my personal view
- Past performance is not a guarantee for future predictions
- Use this for educational purpose
- Any decision you take, you need to take responsibility for the same
- It's your hard earned money. Treat it wisely
- Trade / Invest keeping in mind your trading style, goals and objectives, time horizon & risk tolerance
- if trading in F&O, understand that F&O trading involves risk
- Do take proper risk management measures
- Do your own analysis and consult your financial adviser if need be

tcsgapdown opening and support line break
strong bearish candle formation
3003 is the next support
macd and rsi also signaling down trend.

Focus on TCS shorting TCS was travelling in a decesding wedge and have broken today on downside (due to Results)
Also broken the important support line.. Look for the closing today and go for short if closed below the support line

