my view on TCSi am bearish on TCS as i can see a head and shoulder pattern and my double screen decision also gives me a bearish view and TCS is in Wave C targets for the same are
3588.5
3430.00
Trade ideas

TCS Go Short for 2 WeeksTCS Inverted Double Bottom Formed....
Levels are Mentioned in Chart...
Follow the SL..
Trade Safe.
Cheers Mate!

TCSImportant Levels ....................................................,
Target -3650
Stop Loss -3800.


TCS 24 Jan 2022NSE:TCS
TCS analysis
Details are given in the chart
Go long With Marked Level
THANK YOU
HAPPY TRADING
#CONNECT WITH US FOR DAILY ANALYSIS

CUP AND HANDLE PATTERN IS FORMING.A cup and handle price pattern on a security's price chart is a technical indicator that resembles a cup with a handle, where the cup is in the shape of a "u" and the handle has a slight downward drift. The cup and handle is considered a bullish signal, with the right-hand side of the pattern typically experiencing lower trading volume.
A cup and handle price pattern on bar charts resembles a cup and handle where the cup is in the shape of a "U" and the handle has a slight downward drift. A cup and handle is considered a bullish continuation pattern and is used to identify buying opportunities.

buy TCS is formting a flag pattern after formation of w pattern look like a breakout on the cards buy now or abv 3660
TCS 3608
SL 3600
TGT 3760 3980
BREAKOUT ABV 3760

TCS LongI hope you can now see how TCS represents an excellent low risk profit entry setup allowing you to trade in the market. Take positions so that the risk/reward is in your favor.
Knowing why, where & when a strong reversal signal is being generated will be the only way to capitalize on your technical analysis .
Disclaimer: It should not be assumed that the methods, techniques, or indicators presented in these chart will be profitable or that they will not result in losses. There is no assurance that the strategies and methods presented will be successful for you. Past results are not necessarily indicative of future results. You should not trade with money that you cannot afford to lose. Examples presented in these charts are for educational purposes only and it should not be assumed that these are indicative of ordinary trades. These setups are not solicitations of any order to buy or sell. The publisher assume no responsibility for your trading results. There is a high degree of risk in trading.

TCS at important levelTCS is trading at an important zone of trendline and support, which previously acted as resistance. Holding on by daily TF trendline. If manages to close above last swing high then this can be good swing long trade. Levels mentioned in chart. Follow strict risk management.

TCSIf TCS drops below 3856, it might go for a plunge
analyze and see
...............................................................

Great fundamental stockRounding pattern
Pattern target 4600
Buyback target 4500
Stoploss 3830
My first entry :- 3400
Second entry :- 3660
Third entry :- after breakout waiting
Holding patiently

TCS - Downtrend begins in the Darvas boxAs already posted on Oct 10, TCS is in rangebound. And the downtrend just started in the Darvas box and the floor of the box may be hit in the next few weeks.

TCS Trade Setup For TomorrowTCS Trade Setup For Tomorrow.
Time Frame : 15 MIN
Please Hit the like button this motivate us to make more such analysis.
For more such trading content follow us on ( @tradechefofficial )

[ INTRADAY ] TCS LONG BETrisk: Reward ratio is 1: 2
Rest as per Charts
********
Note -
One of the best forms of Price Action is to not try to predict at all. Instead of that, ACT on the price. So, this chart tells “where” to act in “what direction. Unless it triggers, like, let’s say the candle doesn’t break the level which says “Buy/Sell if it breaks”, You should not buy/sell at all.
=======
I use shorthands for my trades.
“Positional” - means You can carry these positions and I do not see sharp volatility ahead.
“Intraday” -means You must close this position at any cost by the end of the day.
=======
Always follow a stop loss.
In the case of Intraday trades, it is mostly the “Low/High of the Candle”.
In the case of Positional trades, it is mostly the previous swings
********

TCSTCS made double top .
make entry with stop loss provided with target .
all detail are in graph .
Can buy Put of january and make entry and exit when target is hit.
thank you
happy trading


Target hit with 10% gains!! Link below for reference of my previous analysis.
Kindly do your analysis before initiating trade.

[ INTRADAY ] TCS LONG BET
risk: Reward ratio is 1: 2
Rest as per Charts
********
Note -
One of the best forms of Price Action is to not try to predict at all. Instead of that, ACT on the price. So, this chart tells “where” to act in “what direction. Unless it triggers, like, let’s say the candle doesn’t break the level which says “Buy/Sell if it breaks”, You should not buy/sell at all.
=======
I use shorthands for my trades.
“Positional” - means You can carry these positions and I do not see sharp volatility ahead.
“Intraday” -means You must close this position at any cost by the end of the day.
=======
Always follow a stop loss.
In the case of Intraday trades, it is mostly the “Low/High of the Candle”.
In the case of Positional trades, it is mostly the previous swings
********

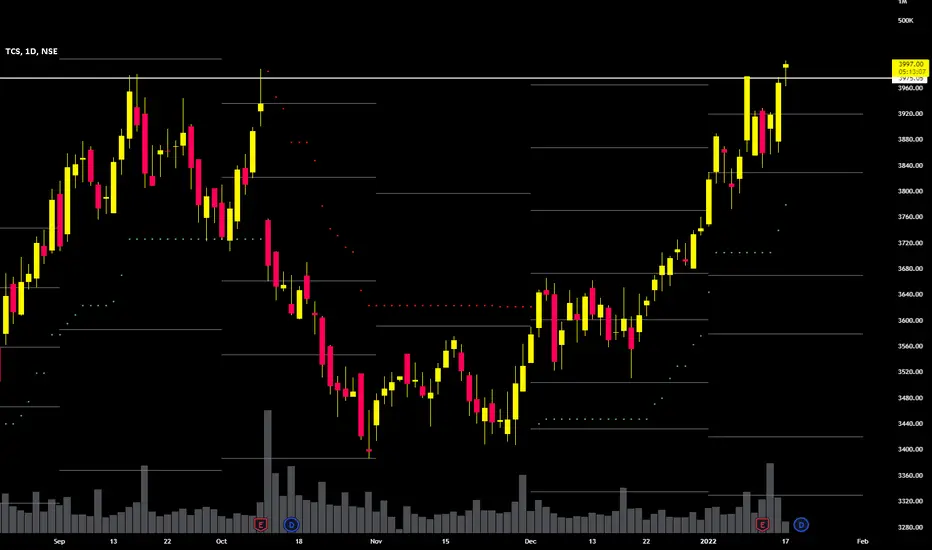
TCS looks Bullish as it gave breakout of all time highIt not just gave breakout but also sustaining over it which is a bullish sign.
TCS share price was Rs 3,985.00 as on 17 Jan, 2022, 10:07 AM IST. TCS share price was up by 0.42% based on previous share price of Rs. 3897.9. In last 1 Month, TCS share price moved up by 11.01%.
Top 4 Peers for TCS are Infosys Ltd., HCL Technologies Ltd., Wipro Ltd. and Tech Mahindra Ltd.
Key Metrics for TCS are:
PE Ratio of TCS is 39.10
Earning per share of TCS is 98.89
Price/Sales ratio of TCS is 7.16
Price to Book ratio of TCS is 16.85
TCS BREAKOUT SOON!!- Major resistance near 3980-4000
- Trading in a bullish channel
- Strong bullish trend
- Buy above 4000 (Hourly Close)
- SL: 3835
- Target: 4200/4400/4600+
- TF: 3-4 Months

TCSGo long above 3990 DCB
Rounding bottom pattern of 550 points forming
Can draw targets according to that
Support 3770-3800

TCS#TCS
CMP - 3968
Above 3990 - 4000
Next Levels to be expect -> 4266,4579
View will be negated below 3764
Disclaimer : This idea is only for education purpose, Pls consult your financial advisor
We are not Sebi registered.
Retweet and Like

