TECH MAHINDRA SWING TRADEBULLISH SENTIMENT
Refer chart for proper levels
minimum 1:2 risk reward, backed by volume foot print and market sntiment.
Tech Mahindra Limited
No trades
Next report date
—
Report period
—
EPS estimate
—
Revenue estimate
—
52.25 INR
42.52 B INR
529.88 B INR
635.42 M
About Tech Mahindra Limited
Sector
Industry
CEO
Mohit Joshi
Website
Headquarters
Pune
Founded
2010
IPO date
Aug 1, 2006
Identifiers
2
ISIN INE669C01036
Tech Mahindra Ltd. operates as an holding company. It engages in the provision of information technology solutions. The operates through Information Technology Business, and Business Process Services segments. It provides computers, networking technology solutions, and business support services to the global telecommunications industries. The company was founded on October 24, 1986 and is headquartered in Pune, India.
Related stocks

TECH MAHINDRA (1W) – Approaching Major Resistance Zone 🟢 Simple Chart Explanation:
• TECHM is moving in a clear long-term uptrend
• Price is consistently respecting the rising trendline (green line)
• Higher highs & higher lows show buyers are in control
• Currently, price is near a strong weekly resistance zone
📌 Important Levels to Watch:
• Majo

Tech Mahindra: Wave 3 or Trap?The recent rally in Tech Mahindra presents a clear structural dilemma that traders should pay close attention to.
From the lows near 1209 , price has staged a strong advance. If this move is indeed a third impulsive wave , then price must extend decisively higher , as any subsequent Wave 4 sh

Tech Mahindra - Weekly Long On the weekly chart of Tech Mahindra, the recent candles show strong bullish behavior. After spending many months in a wide range, price has formed a rounded base and is now printing higher highs with solid green candles near the earlier resistance zone around 1,750. The latest candle closes near th

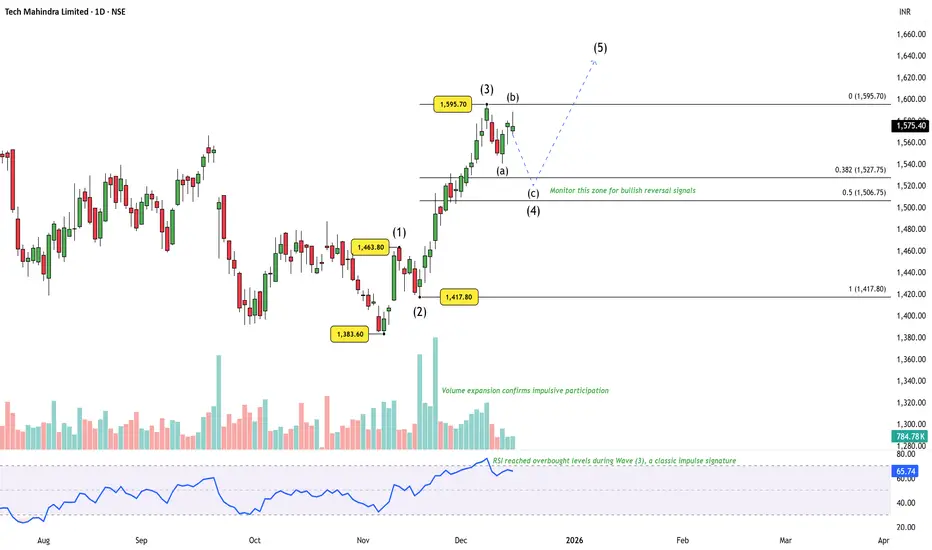
Tech Mahindra: Structure Still Favors One More Upside LegPrice action from the ₹1383.60 low has unfolded as a clean impulsive sequence, with Waves (1), (2), and a strong Wave (3) already in place. The advance was supported by clear volume expansion , validating the impulsive nature of the move. Momentum also peaked during Wave (3) , with RSI reachin
Tech M - Multiyear high possibilityTech Mahindra :
Currently Breaking out resistance
Possibility of multiyear high.
Need to sustain 1770-1780 levels

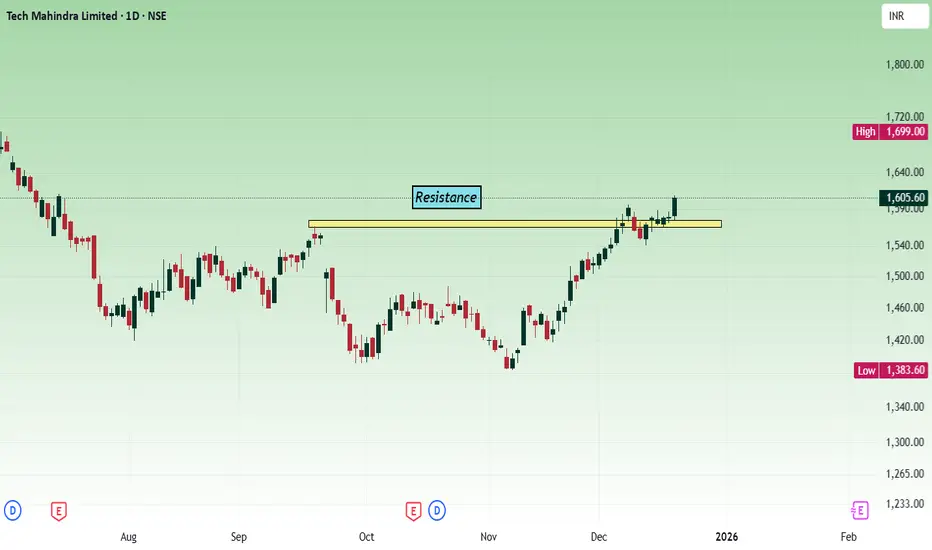
TechM - Multi time frame analysisThe price has broken the resistance at the 1560 - 1580 zone, unable to sustain, fall back and once again took support. Today's movement shows bullish strength.
As per the daily chart, the price has broken the trend line. Strong weekly close will confirm the bullish movement.
Buy above the 1595 - 16
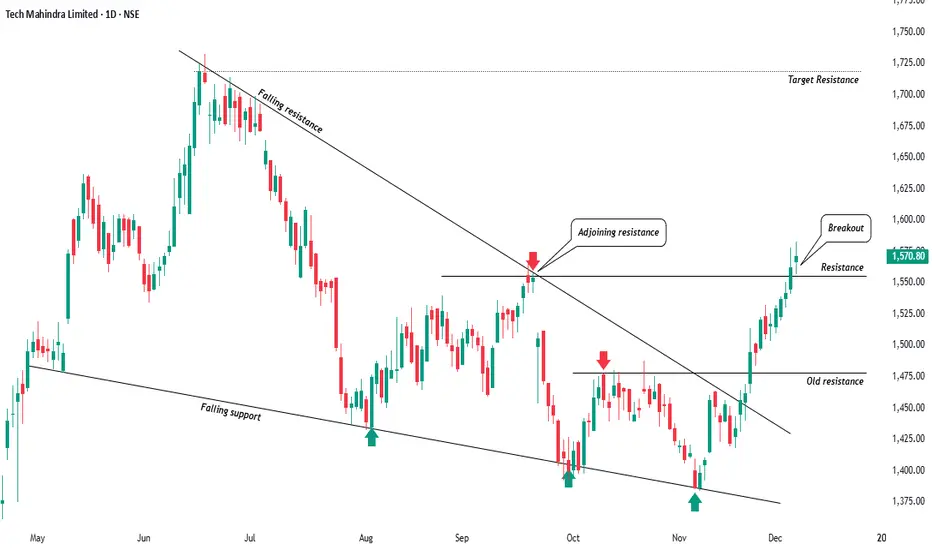
Techm Wakes Up! Reversal CandidateHi Traders! Hope all you are doing well and doing good trades, So today I am sharing a clean technical setup which I’ve been tracking for weeks Tech Mahindra has finally given breakout from a multi-month falling wedge along with a horizontal resistance flip. The structure is now turning bullish, and
Understanding Ownership, Value, and Investment in Stock MarketWhat Are Shares?
A share is a unit of ownership in a company. When a company needs capital to start, expand, or modernize its operations, it may choose to raise funds by issuing shares to the public or to private investors. Each share represents a small portion of the company’s ownership. Sharehold

TECHM 1 Day Time Frame 📍 Latest Price Range (Today on NSE):
• Low ~ ₹1,600 and High ~ ₹1,681 (intraday range) from current data today.
🔁 Key Levels for 1‑Day Timeframe
Immediate Resistance Levels
These are zones where price may face selling pressure if it rises:
R1: ~ ₹1,700 – ₹1,702
R2: ~ ₹1,731 – ₹1,732
R3: ~ ₹1,78

See all ideas
Summarizing what the indicators are suggesting.
Neutral
SellBuy
Strong sellStrong buy
Strong sellSellNeutralBuyStrong buy
Neutral
SellBuy
Strong sellStrong buy
Strong sellSellNeutralBuyStrong buy
Neutral
SellBuy
Strong sellStrong buy
Strong sellSellNeutralBuyStrong buy
An aggregate view of professional's ratings.
Neutral
SellBuy
Strong sellStrong buy
Strong sellSellNeutralBuyStrong buy
Neutral
SellBuy
Strong sellStrong buy
Strong sellSellNeutralBuyStrong buy
Neutral
SellBuy
Strong sellStrong buy
Strong sellSellNeutralBuyStrong buy
Displays a symbol's price movements over previous years to identify recurring trends.
Frequently Asked Questions
The current price of TECHM is 1,534.40 INR — it has decreased by −0.14% in the past 24 hours. Watch Tech Mahindra Limited stock price performance more closely on the chart.
Depending on the exchange, the stock ticker may vary. For instance, on NSE exchange Tech Mahindra Limited stocks are traded under the ticker TECHM.
TECHM stock has fallen by −6.72% compared to the previous week, the month change is a −4.87% fall, over the last year Tech Mahindra Limited has showed a −8.39% decrease.
We've gathered analysts' opinions on Tech Mahindra Limited future price: according to them, TECHM price has a max estimate of 2,350.00 INR and a min estimate of 1,220.00 INR. Watch TECHM chart and read a more detailed Tech Mahindra Limited stock forecast: see what analysts think of Tech Mahindra Limited and suggest that you do with its stocks.
TECHM reached its all-time high on Feb 3, 2026 with the price of 1,854.00 INR, and its all-time low was 51.25 INR and was reached on Jan 23, 2009. View more price dynamics on TECHM chart.
See other stocks reaching their highest and lowest prices.
See other stocks reaching their highest and lowest prices.
TECHM stock is 5.71% volatile and has beta coefficient of 1.04. Track Tech Mahindra Limited stock price on the chart and check out the list of the most volatile stocks — is Tech Mahindra Limited there?
Today Tech Mahindra Limited has the market capitalization of 1.50 T, it has decreased by −5.52% over the last week.
Yes, you can track Tech Mahindra Limited financials in yearly and quarterly reports right on TradingView.
Tech Mahindra Limited is going to release the next earnings report on Apr 23, 2026. Keep track of upcoming events with our Earnings Calendar.
TECHM earnings for the last quarter are 12.64 INR per share, whereas the estimation was 15.55 INR resulting in a −18.69% surprise. The estimated earnings for the next quarter are 17.59 INR per share. See more details about Tech Mahindra Limited earnings.
Tech Mahindra Limited revenue for the last quarter amounts to 143.93 B INR, despite the estimated figure of 141.88 B INR. In the next quarter, revenue is expected to reach 146.64 B INR.
TECHM net income for the last quarter is 11.22 B INR, while the quarter before that showed 11.95 B INR of net income which accounts for −6.07% change. Track more Tech Mahindra Limited financial stats to get the full picture.
Tech Mahindra Limited dividend yield was 3.17% in 2024, and payout ratio reached 93.74%. The year before the numbers were 3.20% and 150.02% correspondingly. See high-dividend stocks and find more opportunities for your portfolio.
As of Feb 15, 2026, the company has 119.34 K employees. See our rating of the largest employees — is Tech Mahindra Limited on this list?
EBITDA measures a company's operating performance, its growth signifies an improvement in the efficiency of a company. Tech Mahindra Limited EBITDA is 83.36 B INR, and current EBITDA margin is 13.48%. See more stats in Tech Mahindra Limited financial statements.
Like other stocks, TECHM shares are traded on stock exchanges, e.g. Nasdaq, Nyse, Euronext, and the easiest way to buy them is through an online stock broker. To do this, you need to open an account and follow a broker's procedures, then start trading. You can trade Tech Mahindra Limited stock right from TradingView charts — choose your broker and connect to your account.
Investing in stocks requires a comprehensive research: you should carefully study all the available data, e.g. company's financials, related news, and its technical analysis. So Tech Mahindra Limited technincal analysis shows the sell today, and its 1 week rating is sell. Since market conditions are prone to changes, it's worth looking a bit further into the future — according to the 1 month rating Tech Mahindra Limited stock shows the neutral signal. See more of Tech Mahindra Limited technicals for a more comprehensive analysis.
If you're still not sure, try looking for inspiration in our curated watchlists.
If you're still not sure, try looking for inspiration in our curated watchlists.