TECH MAHINDRA FUTURE PRICE PROJECTION ACCORDING TO ELLIOT WAVE.Strategic Elliott Wave Investment Proposal: Tech Mahindra Ltd. (Monthly Outlook)
Executive Summary
This proposal outlines a rigorous Elliott Wave and time-cycle analysis for Tech Mahindra Ltd. Based on multi-year structural dynamics, the asset has completed a major multi-decade impulse cycle and is
Tech Mahindra Limited
No trades
No trades
Compare with Tech Mahindra Limited
58.0 INR
48.11 B INR
568.15 B INR
635.84 M
Next report date
—
Report period
—
EPS estimate
—
Revenue estimate
—
Company info
Sector
Industry
CEO
Mohit Joshi
Website
Headquarters
Pune
Founded
1986
IPO date
Aug 1, 2006
ISIN
INE669C01036
FIGI
BBG000CXKQ30
Identifiers
ISIN INE669C01036
Tech Mahindra Ltd. operates as an holding company. It engages in the provision of information technology solutions. The operates through Information Technology Business, and Business Process Services segments. It provides computers, networking technology solutions, and business support services to the global telecommunications industries. The company was founded on October 24, 1986 and is headquartered in Pune, India.
Tech Mahindra elliot wave analysisStrategic Elliott Wave Investment Proposal: Tech Mahindra Ltd. (Monthly Outlook)
Executive Summary
This proposal outlines a rigorous Elliott Wave and time-cycle analysis for Tech Mahindra Ltd. Based on multi-year structural dynamics, the asset has completed a major multi-decade impulse cycle and is
Tech Mahindra – Tracking the Final Leg LowerThe current structure suggests the (c) leg of an ABC correction may still be unfolding. Within this move, the lower-degree count appears to be progressing through Waves (1)–(5), with Wave (4) now complete.
If the structure remains intact, the final Wave (5) could extend lower and complete the large
Tech Mahindra**Tech Mahindra — Pattern Alert 📊**
Tech Mahindra is showing an interesting **XABCD Harmonic Structure** on the chart.
After the completion of the **D point near ₹1,800**, the stock entered a **Descending Channel**, forming lower highs and lower lows.
Now the key question is: **Will the stock bre
Tech Mahindra (TECHM) Breakout Analysis | Major Resistance TesteTech Mahindra (NSE: TECHM) is currently trading near a significant long-term resistance zone on the daily timeframe. After a strong bullish rally, the stock has once again reached an area where sellers have previously entered the market. This makes the current price action extremely important for bo
Tech Mahindra – Bullish Structure with Fair Value Gap SupportMarket Structure
Tech Mahindra continues to exhibit a bullish market structure, having established a sequence of higher highs and higher lows. This indicates that buyers remain in control and the prevailing trend continues to favor the upside.
Technical Observation
A significant Fair Value Gap (F
TECHM - Technical analysisTECHM is showing signs of strength after a significant correction phase.
After marking an ATH around Feb 2026, the stock witnessed a sharp 30% retracement, indicating strong profit booking and a temporary shift in sentiment. However, the recent price action suggests that the stock may be stabilizi
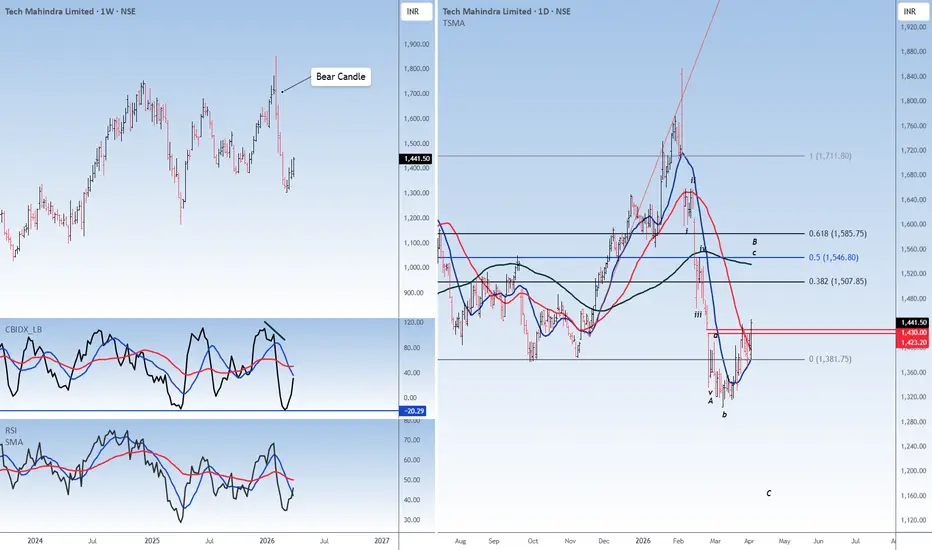
IT is still not out of the woodsTech M- CMP 1441
Elliott- this is the c wave rally of B. This is a zig zag corrective pattern. The B wave rally will get over around the 50% fib zone of 1547. The MA at the same zone makes the zone a strong resistance.
Divergence- the rally post the divergence is a very good sell. Hence even t
TECHM at Critical Make-or-Break Support ZoneTECHM has reached a significant long-term trendline support on the higher timeframe. This level has historically acted as a strong reaction zone, making it a decisive area for price action.
If price holds and shows strength here, we could see a potential bounce and continuation of structure. Howeve
See all ideas
Summarizing what the indicators are suggesting.
Neutral
Neutral
Neutral
An aggregate view of professional's ratings.
Neutral
Neutral
Neutral
Displays a symbol's price movements over previous years to identify recurring trends.
Frequently asked questions
The current price of TECHM is 1,551.0 INR — it has increased by 0.49% in the past 24 hours. Watch Tech Mahindra Limited stock price performance more closely on the chart.
Depending on the exchange, the stock ticker may vary. For instance, on NSE exchange Tech Mahindra Limited stocks are traded under the ticker TECHM.
TECHM stock has risen by 3.13% compared to the previous week, the month change is a 2.09% rise, over the last year Tech Mahindra Limited has showed a 6.23% increase.
We've gathered analysts' opinions on Tech Mahindra Limited future price: according to them, TECHM price has a max estimate of 1,960.00 INR and a min estimate of 1,150.00 INR. Watch TECHM chart and read a more detailed Tech Mahindra Limited stock forecast: see what analysts think of Tech Mahindra Limited and suggest that you do with its stocks.
TECHM reached its all-time high on Feb 3, 2026 with the price of 1,854.0 INR, and its all-time low was 51.3 INR and was reached on Jan 23, 2009. View more price dynamics on TECHM chart.
See other stocks reaching their highest and lowest prices.
TECHM stock is 1.85% volatile and has beta coefficient of 0.64. Track Tech Mahindra Limited stock price on the chart and check out the list of the most volatile stocks — is Tech Mahindra Limited there?
Today Tech Mahindra Limited has the market capitalization of 1.44 T, it has decreased by −1.95% over the last week.
Yes, you can track Tech Mahindra Limited financials in yearly and quarterly reports right on TradingView.
Tech Mahindra Limited is going to release the next earnings report on Oct 15, 2026. Keep track of upcoming events with our Earnings Calendar.
TECHM earnings for the last quarter are 16.50 INR per share, whereas the estimation was 17.47 INR resulting in a −5.55% surprise. The estimated earnings for the next quarter are 18.64 INR per share. See more details about Tech Mahindra Limited earnings.
Tech Mahindra Limited revenue for the last quarter amounts to 157.12 B INR, despite the estimated figure of 154.92 B INR. In the next quarter, revenue is expected to reach 160.61 B INR.
TECHM net income for the last quarter is 14.65 B INR, while the quarter before that showed 13.54 B INR of net income which accounts for 0.00% change. Track more Tech Mahindra Limited financial stats to get the full picture.
Yes, TECHM dividends are paid semi-annually. The last dividend per share was 36.00 INR. As of today, Dividend Yield (TTM)% is 3.47%. Tracking Tech Mahindra Limited dividends might help you take more informed decisions.
Tech Mahindra Limited dividend yield was 3.68% in 2025, and payout ratio reached 93.96%. The year before the numbers were 3.17% and 93.74% correspondingly. See high-dividend stocks and find more opportunities for your portfolio.
As of Oct 14, 2026, the company has 147.62 K employees. See our rating of the largest employees — is Tech Mahindra Limited on this list?
EBITDA measures a company's operating performance, its growth signifies an improvement in the efficiency of a company. Tech Mahindra Limited EBITDA is 98.41 B INR, and current EBITDA margin is 15.73%. See more stats in Tech Mahindra Limited financial statements.
Like other stocks, TECHM shares are traded on stock exchanges, e.g. Nasdaq, Nyse, Euronext, and the easiest way to buy them is through an online stock broker. To do this, you need to open an account and follow a broker's procedures, then start trading. You can trade Tech Mahindra Limited stock right from TradingView charts — choose your broker and connect to your account.
Investing in stocks requires a comprehensive research: you should carefully study all the available data, e.g. company's financials, related news, and its technical analysis. So Tech Mahindra Limited technincal analysis shows the buy rating today, and its 1 week rating is buy. Since market conditions are prone to changes, it's worth looking a bit further into the future — according to the 1 month rating Tech Mahindra Limited stock shows the buy signal. See more of Tech Mahindra Limited technicals for a more comprehensive analysis.