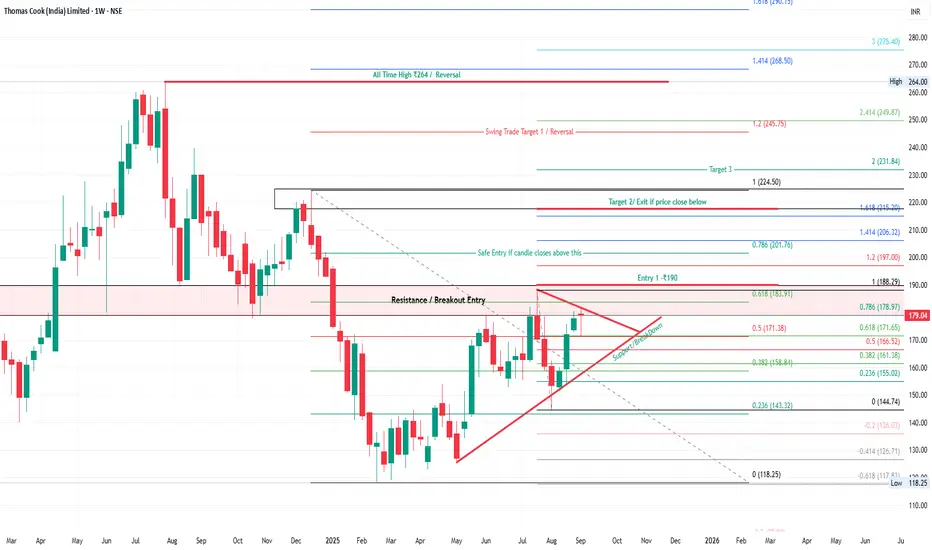
Thomas Cook – Triangle Breakout SetupThomas Cook is forming a triangle breakout structure on the weekly chart. Price is consolidating near resistance around ₹183–₹188. A weekly close above ₹190 will confirm breakout strength. Safe entry is above ₹190, with positional upside targets aligning with Fibonacci extensions.
📌 Key Technical Highlights:
Pattern: Symmetrical Triangle Breakout
Entry Zone: ₹183–₹190
Safe Entry: Above ₹190 on weekly close
Resistance Zone: ₹188–₹197
Support: ₹171, ₹158, ₹143
🎯 Upside Target Levels:
Target 1: ₹197
Target 2: ₹215
Target 3: ₹224
Target 4: ₹231
Swing Targets: ₹245 – ₹249
All-Time High: ₹264 (major reversal level)
⚠️ Downside Risk Levels:
₹171
₹158
₹143
₹118 (strong base support)
📈 Strategy Outlook:
Positional traders should wait for a strong weekly breakout above ₹190 for confirmation. Sustaining above this level can trigger momentum toward ₹224–₹245. A close below ₹171 weakens the setup.
Disclaimer:
This analysis is for educational purposes only and not financial advice. Do your own research before trading or investing.
THOMASCOOK trade ideas
THOMAS COOK: Bullish Momentum Confirmation Pending- Wait for the momentum to break the immdiate marked golden zone resistance.
- View is bullish. RRR looks favourable.
⚠️ Disclaimer: This is NOT a buy/sell recommendation. This post is meant for learning purposes only. Views are personal. Please, do your due diligence before investing.⚠️
💬 Share your thoughts in the comments below! ✌️
🔥 Trade Safe! ✅ 🚀
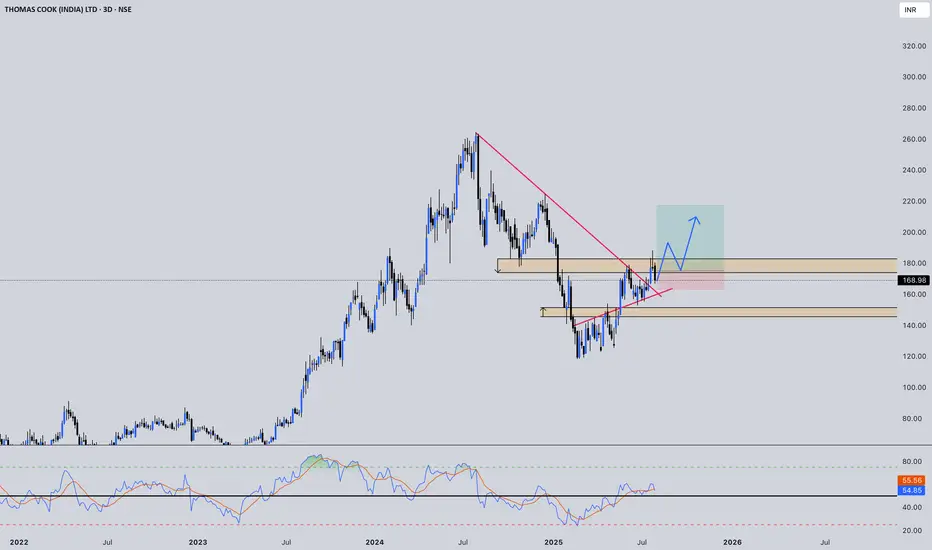
Breakout from Resistance| Element | Details |
| ----------- | -------------------------|
| Trend | Bullish |
| CMP | ₹172.62 |
| Stop Loss | ₹157-155 |
| Target 1 | ₹210 |
| Target 2 | ₹255 |
| Risk/Reward | Favorable (approx 1:2.5+) |

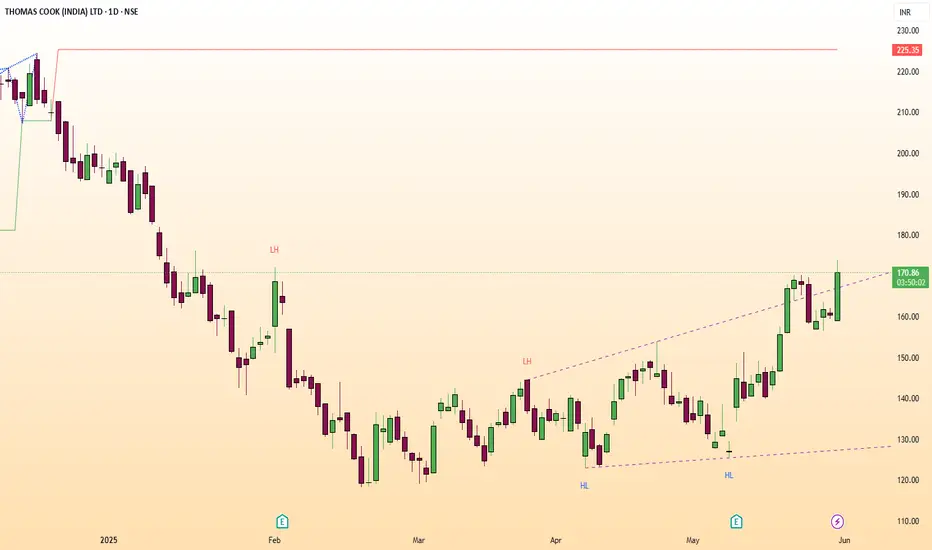
THOMASCOOK LONG ENTRY🚨 Breakout Watch: Thomas Cook 🚨
Bullish above ₹171 (Close). CMP ₹170. Target ₹200–₹240+. Invalid below ₹140.
Volume spiked 818%. RSI strong across timeframes (D: 65.97, W: 55.68, M: 53.65).
ADX 27.92 with 62.96% DMI spread — strong trend.
Price at upper Donchian. Bollinger Bands expanding (45.58%).
Watch ₹171 breakout!
(For Educational Purposes Only)
#ThomasCook
Thomas Cook - Early Trend Reversal SignalsNSE:THOMASCOOK Made Beautiful Chart Structure today Before Q4 Results with Good Price and Volume action.
Price Action and Base Formation Analysis:
Consolidation Base:
The stock has formed a critical consolidation base in the ₹130-140 zone:
1. Base Characteristics:
- Horizontal support zone marked in green
- Multiple tests of this zone (4-5 clear touch points)
- Tight price compression indicates potential energy buildup
2. Breakout Dynamics:
- Today's 13.91% surge represents a decisive breakout from the consolidation zone
- Penetration above ₹140 with strong momentum suggests a potential trend change
- The red arrow indicates the resistance level that might be overcome.
Volume Analysis:
Volume provides crucial insights into the price action:
- Today's volume at 2.46M shares is more than 2x the 20-day average
- Significant volume spikes are visible in February and March
- Recent volume pattern shows increasing participation
- Volume expansion coincides with today's breakout, confirming buying interest
Support and Resistance Levels:
Key Resistance Levels:
1. Immediate Resistance: ₹148-150 (recent swing high)
2. Major Resistance: ₹160-165 (previous structural resistance)
3. Psychological Resistance: ₹150 (round number)
Key Support Levels:
1. New Support: ₹130-140 (previous consolidation zone)
2. Secondary Support: ₹125 (lower boundary of recent base)
3. Strong Support: ₹118-120 (52-week low area)
Technical Pattern:
Several important patterns are evident:
1. Accumulation Base: The ₹130-140 zone represents a classic accumulation pattern
- Tight trading range
- Multiple support tests
- Decreasing volatility
2. Trend Reversal Signals:
- Higher lows forming since February
- Decreasing downward momentum
- Breakout with strong volume
My Take:
The combination of:
- Decisive breakout from a multi-month base
- Substantial volume confirmation
- Clear momentum shift
Suggests NSE:THOMASCOOK could be transitioning to a bullish trend Post Q4.
Price Projection:
1. Near-term Target: ₹160-165
2. Intermediate Target: ₹180-190
3. Long-term Potential: Retest of previous highs near ₹200
Critical Watch Points:
- Ability to sustain above ₹140
- Volume confirmation in subsequent sessions
- Holding the breakout without immediate retracement
Keep in the Watchlist.
NO RECO. For Buy/Sell.
📌Thank you for exploring my idea! I hope you found it valuable.
🙏FLLOW for more
👍BOOST if useful
✍️COMMENT below with your views.
Meanwhile, check out my other stock ideas on the right side until this trade is activated. I would love your feedback.
Disclaimer: "I am not SEBI REGISTERED RESEARCH ANALYST AND INVESTMENT ADVISER."
This analysis is intended solely for informational and educational purposes and should not be interpreted as financial advice. It is advisable to consult a qualified financial advisor or conduct thorough research before making investment decisions.

Thomas Cook - Approaching Trendline supportThomas Cook :
Approaching Trendline support
200 is a crucial level, if broken 190 seems feasible, watch out

THOMASCOOK BULLISH BREAKOUTIts a up flag breakout with good volume.Breakout is happened after a long consolidation

Thomascook is consolidating and looks promisingThomas Cook is looking good from a chart and risk perspective. Additionally, it has just gotten an AA rating from Crisil. This makes it a good candidate for some quick moves. I have tried to add some negative points as well to consider. Please note, this is only my view and do not invest your precious capital. I am learning and sharing.

Thomas Cook, one simple horizontal line setupTraveling is booming in India post covid.
And travel companies are enjoying this piece of pie.
-Posted growth YoY EPS growth, OPM% also improving.
-Near Major resistance, under which it is consolidating for 50 days (good consolidation)
-Good Shakeout, when price went below major ema (here 21 dema) and rally back (also known as MAU&R: Moving Avg Undercut and Rally)
-Tightness near resisantance.
-Signal Candle (5th n 7th June candles are white dot, which is more than 5% move with 1M vol) suggesting big players are buying. Retailer buyers cant create such volumes.
If it breaks this resistance level. with good vol (basically more than 10 day avg) then can expect good move.
No buy/sell recommendations.

THOMASCOOK | SWING BUY | FLAG BREAKOUTAnalysis: THOMASCOOK has formed a flag pattern and it has broken out and shows strong uptrend potential with solid technical indicators.
Entry: Consider current price
Disclaimer: For informational purposes only. Do your research or consult a financial advisor.

THOMASCOOK - Ichimoku Breakout📈 Stock Name - Thomas Cook (india) Limited
🌐 Ichimoku Cloud Setup:
1️⃣ Today's close is above the Conversion Line.
2️⃣ Future Kumo is Turning Bullish.
3️⃣ Chikou span is slanting upwards.
All these parameters are shouting BULLISH at the Current Market Price and even more bullishness anticipated AFTER crossing 227.
🚨Disclaimer: This is not a Buy or Sell recommendation. It's for educational purposes and a guiding light to learn trading in the market.
#CloudTrading
#IchimokuCloud
#IchimokuFollowers
#Ichimokuexpert
Excited about this analysis? Share your thoughts in the comments below!
👍 Like, Share, and Subscribe for daily market insights! 🚀
#StockAnalysis #MarketWatch #TradingEducation #ichimoku #midcap #smallcap #dycl


Thomas Cook - Flag Pattern Breakout !!!Thomas Cook is showing a flag pattern break-out. It is also at ATH, so a breakout from that will push the price above. The RSI is above 60, and MACD is improving (If you MACD at weekly time frame it is already positive).
Travel industry has again picked up, and we can expect a good QoQ growth in this segment. We can expect a price jump to ~150.
"Clean Chart, Easy Chart"
Learing and Earning !!!
Cheers!!

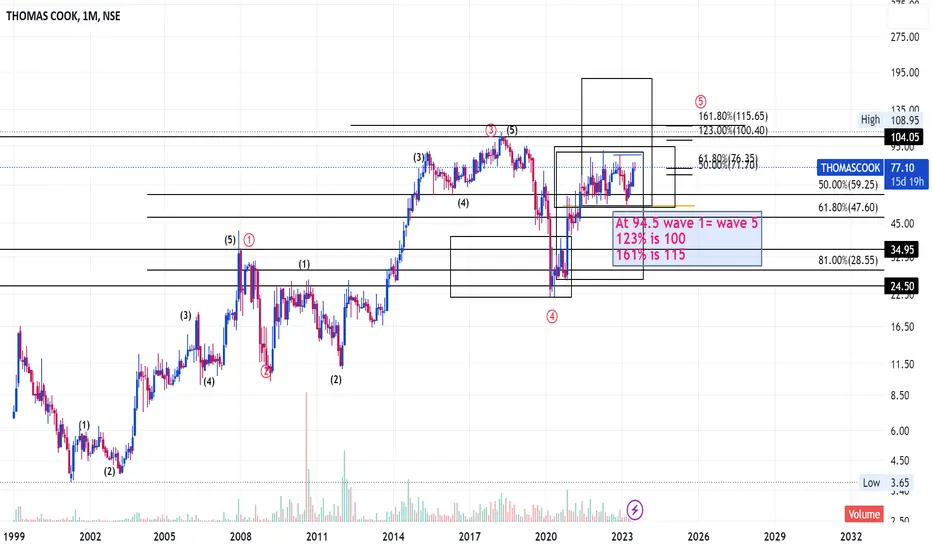
$NSE:THOMASCOOK It has a given a breakout today on the weekly charts above the levels of 90 and if it sustains and closes above it today and then breaks today's high on Monday it can go till the levels of 105-110 on a positional basis with 80 acting as a strong support on daily closing basis below which it will turn weak.
NOTE: NOT SEBI REGISTERED. THIS IS NOT AN INVESTMENT STRATEGY AND ONE SHOULD DO RESEARCH OR CONSULT WITH THEIR FINANCIAL ADVISOR BEFORE TAKING ANY INVESTMENT DECISIONS.THIS IS ONLY FOR EDUCATIONAL AND LEARNING PURPOSES.

THOMASCOOK - Ichimoku BreakoutStock Name - Thomas Cook (india) Limited
Ichimoku Cloud Setup :
1). Today's close is above the Conversion Line
2). Future Kumo is Turning Bullish
3). Chikou span is slanting upwards
All these parameters are showing bullishness at Current Market Price
and more bullishness AFTER crossing 143
#This is not Buy and Sell recommendation to any one. This is for education purpose and a helping hand to learn trading in Market.
#CloudTrading
#IchimokuCloud
#IchimokuFollowers
#Ichimokuexpert
I hope you all like my analysis.
Please do share your thoughts into comment section.
Please give a like, share & subscribe for daily analysis.

Thomas Cook ready for good profitMy personal view go long with thomas cook. After 15 days consolidate second swing ready for target 160 ++.
Buy cmp @120-123
Target 160 ++

Thomas Cook : Swing Trade / Momentum Trade#thomascook #swingtrade #momentumtrade #breakouttraade #swingtrading
📌 Thomas Cook : Range Breakout
Swing Trade / Momentum stock
>> Bullish structure along with Volume contraction seen on charts
>> Good strength in stock
>> Wait for Levels to break
Swing traders can lock thier profits at 10% and keep trailling
Please Like or comment if u r Liking the analysis & Learning from it. Keep showing ur Love
Disclaimer : This is not a Trade Recommendations & Charts/ stocks Mentioned are for Learning/Educational Purpose. Do your Own Analysis before Taking positions.

BUY TODAY SELL TOMORROW for 5% DON’T HAVE TIME TO MANAGE YOUR TRADES?
- Take BTST trades at 3:25 pm every day
- Try to exit by taking 4-7% profit of each trade
- SL can also be maintained as closing below the low of the breakout candle
Now, why do I prefer BTST over swing trades? The primary reason is that I have observed that 90% of the stocks give most of the movement in just 1-2 days and the rest of the time they either consolidate or fall
Trendline Breakout in THOMASCOOK
BUY TODAY SELL TOMORROW for 5%

Breakout in Thomas Cook (india) Limited...Chart is self explanatory. Levels of breakout, possible up-moves (where stock may find resistances) and support (close below which, setup will be invalidated) are clearly defined.
Disclaimer: This is for demonstration and educational purpose only. This is not buying or selling recommendations. I am not SEBI registered. Please consult your financial advisor before taking any trade.

Coming out after a tight Price consolidation 📌#BREAKOUTSTOCKS
✅Keep in your watchlist
#THOMASCOOK
- Coming out after a tight Price consolidation
- Supported with Volume
- Above Key EMAs
- Bullish RSI

3 Amazing swing trading ideas for 18 july markets I daily make educational content videos for swing / positional trading

Thomas CookThomas Cook - Multiple breakouts
Buy above 82 | Tgt 92
Keep on the radar to catch the momentum
