#ThomascookMajor Resistance is 104 levels
Analysis is on monthly charts
Small RSI not getting Oversold
Bigger RSI 58
Alligator (Indicator teeth/jaw are open)
ADX is 26+
Big move expected
THOMASCOOK trade ideas

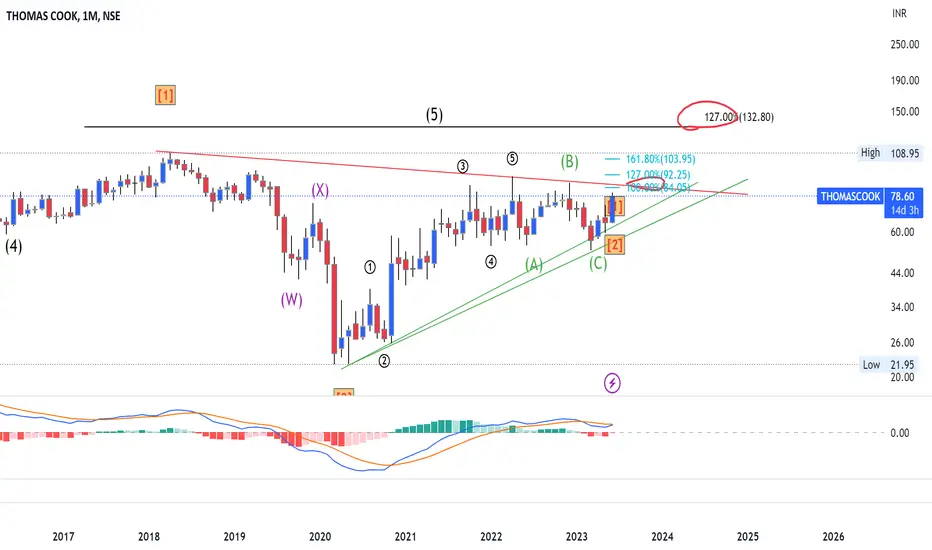
#Thomas CookWave analysis
Wave C - 161% will complete at 103
Final target coming to 132
Stock also forming Inverted H&S
#Thomas CookWave analysis
Wave C - 161% will complete at 103
Final target coming to 132
Stock also forming Inverted H&S


Resistance BreakoutPlease look into the chart for a detailed understanding.
Consider these for short-term & swing trades with 2% profit.
For BTST trades consider booking target for 1% - 2%
For long-term trades look out for resistance drawn above closing.
Please consider these ideas for educational purpose

Thomas Cook India Ltd - Double Digit + MACD Crossover📊 Script: THOMASCOOK (THOMAS COOK (INDIA) LIMITED)
📊 Nifty50 Stock: NO
📊 Sectoral Index: NIFTY 500
📊 Sector: Consumer Services
📊 Industry: Tour Travel Related Services
Key highlights: 💡⚡
📈 Script is trading at upper band of Bollinger Bands (BB) and giving breakout of it.
📈 MACD is giving crossover.
📈 Double Moving Averages may give crossover in next trading session.
📈 Volume is increasing along with price which is volume breakout.
📈 Current RSI is around 67.
📈 One can go for Swing Trade.
⏱️ C.M.P 📑💰- 81
🟢 Target 🎯🏆 - 91
⚠️ Stoploss ☠️🚫 - 75
⚠️ Important: Always maintain your Risk & Reward Ratio.
⚠️ Purely technical based pick.
✅Like and follow to never miss a new idea!✅
Disclaimer: I am not SEBI Registered Advisor. My posts are purely for training and educational purposes.
Eat🍜 Sleep😴 TradingView📈 Repeat🔁
Happy learning with trading. Cheers!🥂

THOMASCOOK - will it sustain the momentumTrend Changed to +ve Today with good volumes
Crossing 4-week High
On Daily time frame and Monthly Time frame Close is above 20-SMA.
Price Crossed Upside 50-SMA on Monthly time frame
Also NR7 - Breakout on the upside.
High on momentum.
Add to watch list - trade as per your own study.

THOMASCOOKA beautiful Consolidation Breakout on counter.
Thomas cook Volume price Action.
Looking spurt in volumes can be a good chance to acquire from this levels.
Oct to Jan consolidation time now ready to Break his previous levels of 2019 C.I.P levels.
BUY - 70-21
Stop Loss (closing Basis) - 62
Positional Targets - 82 & 90+
Keep holding and keep patience.
@TheBreakOut
@vivek_mashrani @TheBreakOut @ExtremeVolume @volumetrader

THOMASCOOK : 15 % UP IN 3 DAYSHello Traders!
This is a follow up analysis for this trade taken 3 days ago. Trade is 15% up.
Don't take entry at this level who has missed.
Juat wait for another one....
Thank you!

Thomas Cook - 4 month weekly closing highStock has closed at a 4 month weekly closing high with considerable volumes. In doing so it has breached a long term resistance level of 70.50 and closed above it.
Thomas Cook can be bought at CMP and on declines to 68
SL: 64 (3 week low)
Tgt: 87 (November 2021 high) and 104.

THOMASKOOK : TARGET 77%Hello Traders!
This is an analysis for Thomas Cook for long.
Breakout can be seen after a long consolidation.
Entry can be taken @cmp or little retracement.
SL and target are mentioned in the chart. RR in this trade is almost 7. For details refer to the chart.
If you have any questions, comment below.
Disclaimer :This is to share my Trading idea and not my recommendation.

THOMASCOOKIf you want (price action) of any charts then drop the stock keyword in the comment section.
For more chart patterns, follow me.
Thank you.
Note: Don't trade without stoploss because risk management is the main key in trading.
Disclaimer: I'm not responsible for any loss that you have made from this post. Do your own research then invest.

THOMASCOOKCMP: 80
Inverse Head and Shoulders breakout.
Breakout level: 72
Can be added in dips.
SL: 54
Target: 96, 100

THOMASCOOK#THOMASCOOK
CMP - 66.90
Can be traded in range of 64.35 to 65.85
OR Above 72
Next Levels can be expected 68.80, 71.25, 74.40
View will be negated below 56.90
Disclaimer : This idea is only for education purpose, Pls consult your financial advisor
We are not Sebi registered.
Retweet and Like

TRENDLINE BREAKOUT | THOMAS COOKTHOMASCOOK Daily: Swing buy above 64.5 (Day Closing Basis)
1) Trendline Breakout with heavy volumes
2) Target 1 - 67.7 , Target 2 - 71.4

Thomas Cook - 2yr Cup and Handle Breakout with volume
BUY GUIDANCE:
Never buy before 3PM (for positional trading). I have been burnt many times over. Try to buy between 3:15 - 3:30PM, later the better.
SL: Depending on your risk appetite: Below Weekly BO Candle / Below Daily BO Candle / 50% of Weekly BO candle / Below 20DMA
TGT: After a 10-15%+ vertical move, breakdown of 20DMA (on a daily close basis)
SELL GUIDANCE:
Selling in Profit:
Sell earlier in the session when the prices are higher, around 11AM.
Selling at SL:
Give your stock a chance to recover by end of session. If it doesn't recover, sell anywhere between 3:00 - 3:30PM.
Note: I reserve the right to be wrong.
DISCLAIMER:
I am not a SEBI registered analyst. Please consult your financial advisor before investing.

THOMAS COOK | Weekly1) Inverted Head & Shoulder pattern breakout.
2) Breakout accompanied with good volumes.
3) Momentum indicators looking good.
Nice stock to watch out for!!

Thomas Cook : readying to openup Read this chart of Thomas Cook, so many chart patterns on one single chart, someone may find a big rounding bottom , some may get hooked by a somewhat inverted head and shoulder , there is a cup and handle pattern , a rising channel pattern and the script is giving breakout out of each of this on a weekly chart , so you can look at it as per your choice of analogy, but what pinned my attraction for a longer time was the ATH price volume trend !!
So, as usual, DYOR !! and let me know what you discover on this scintillating chart !!

THOMASCOOK LongNSE:THOMASCOOK
Weekly breakout..
Buy at cmp 79.7, add more near 70-75 levels..
Tgts 92.75-109.4++
Holding period 10-15 weeks
SL below 58.75 weekly candle closing basis..

thomas cook keep eye on itlittle risky good for accumulate..
decide on ur own
b.o. level.
rest market

THOMAS COOK | POLE FLAG + SUPPORT CONFLUENCEREASONS FOR ENTERTING TRADE
1. A pole flag structure with the base of the flag bouncing off the 200EMA.
2.This 200EMA bounce point coincides with the long-term support trendline,
3. & the 61.8% retracement of the pole.
3. Price sustains above the flag range after retest
Buying above 65 for a projected price target which is set as the pole height, from the breakout point.
SL 56

Thomas Cook Flag pattern BreakoutFlag pattern breakout. The price has retested and is moving upwards.

Thomas Cook - Something is Cooking up !Looks like end of Downtrend
After break of trend now in consolidation
Possible buy 50% qty here and 50% after breakout
As downside now looks limited
