THOMASCOOK trade ideas
THOMASCOOKThomas Cook, the market leader of travel & tourism, may be the biggest beneficiary of the 5 lakh free tourist visas free till 31st March 2022 as tourism revives after the nationwide vaccination drive. A V shaped recovery in its fundamentals and stock price cannot be ruled out. Buy for a target of Rs.120.
THOMASCOOK | WEEKLY ANALYSIS | Be patient | 70-120% potentialThe stock was in downtrend. Now has changed its structure to HH, HL.
Stock is in congestion zone right now. Strong and decisive break needed above 70
17/6/21
- Parameter check
- Classic HH-HL structure on W
- D- (above all major ema) W - EMA 20-50 crossover
- Closing above 70-72 with VOL (check breakout momentum) will
- Ascending triangle breakout above 72 on W
- RSI in overbought zone at the moment
VCP Breakout: THOMASCOOK 🚢📌Levels are mentioned on chart for ❝Swing trading❞.
This stock looks good for medium to long term as well. Travel industry is expected to pick up with the withdrawal of second corona wave. It can be bought at current price or safe traders may wait for it to retrace back to the neckline and enter there.
☆ Kindly like & share ➥ this pattern. Comment ⎚ with what do you think. Follow me @ tradingview for more updates and like the chart ❤!!!
Clear Bullish breakout in Thomas CookThomas has broken out of its 3 month range with reasonably high volumes. As shown in the chart, the stock has closed above 50 after over 2 months of consolidation between 40-50.
The stock will probably target its recent early december high at 58 in the short term with any weekly move beyond the 58-61 area leading to its pre crash december 2019 levels of 70.
The stock can be bought with a daily closing basis stop loss of 46.5 with an immediate target of 58-61.
#THOMASCOOK (India) Ltd. WEEKLY CHART VIEW!!#THOMASCOOK (India) Ltd. WEEKLY CHART VIEW!!
The stock price is maintaining its flattish momentum above the rectangle pattern breakout.
On the upside immediate resistance comes at 50.50 and on the lower side 43.85 - 43 can be considered as supports.
Positive momentum above 51; can try to test 55-56-58-60 on the upside.
#THOMASCOOK WEEKLY CHART VIEW!!#THOMASCOOK WEEKLY CHART VIEW!!
The stock price gave a breakdown and now testing the trendline in the weekly time frame.
Technical parameters are flattish, where RSI is below 40 in weekly time frame.
26.65 -30.55 should be considered as support and resistance respectively.
Thomas Cook (India) Ltd. - WEEKLYThomas Cook (India) Ltd.
The stock price clearly maintaining a downtrend with negative momentum.
Technically there is no indication for a positive reversal witnessed yet.
On the higher side 34.50 - 35.70 are strong resistances. On the lower side 27.50 - 28.50(5Ma) likely to act as supports.
A breakdown below 27 can further increase weakness on the lower side further.
KEEP AN EYE!! #B-
#tradingedge_academy #SMTA_Institute
Thomas Cook (India) Ltd. - Positive Momentum in Bearish Trend !!Thomas Cook (India) Ltd.
As anticipated, a positive move was witnessed above 28 & the price closed near the weekly high.
Technical Indicators are Bearish.
Time-Trend Indicator is Bearish.
------->>> Even though the main trend is negative, the short term momentum might cause a Positive Move. <<<----------
Presently, 30.15 -34.85 -35.70 need to be considered as important resistances.
On the lower side 25 (5MA), 23.40 - 22 -21.95 are important Supports.
KEEP AN EYE!! #B-
#tradingedge_academy #SMTA_Institute
THOMAS COOK ...Showing Bullish Candle with Heavy VolumesTHOMAS COOK is showing some Bullish Signals through the FLAG & POLE PATTERN supported by Heavy Volumes.
Target 1 : Rs. 148
Target 2 : Rs. 152
STOP LOSS : Rs. 119
Always Remember TWO Points in Share Market..
1. ALWAYS PUT STOP LOSS TO PROTECT YOUR CAPITAL.
2. ALWAYS REMEMBER Point No.1.
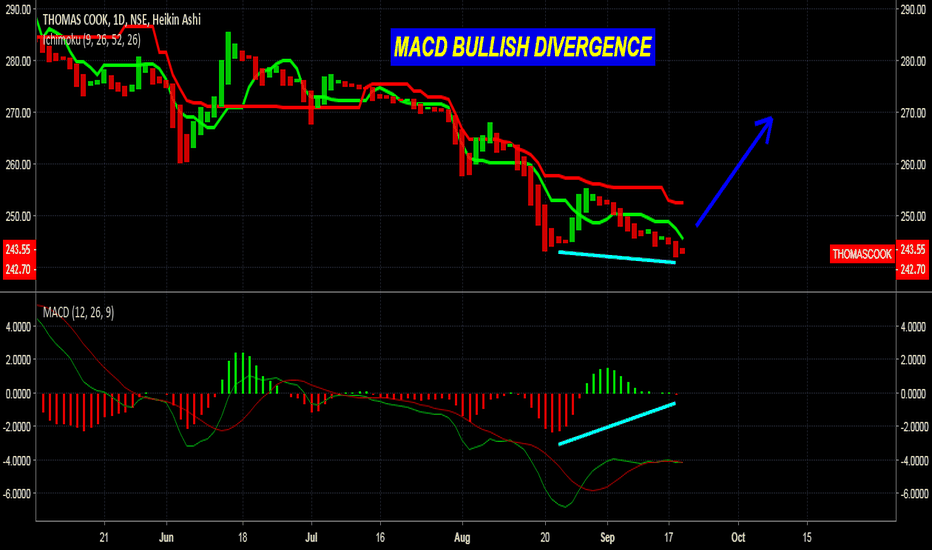
THOMAS COOK INDIA LTD - TREND TURNS TO POSITIVE THOMAS COOK INDIA LIMITED - LTP 232.35/-RS
SUPER TREND INDICATOR TURNS TO POSITIVE
CAN EXPECT A MORE POSITIVE ABOVE IT'S RESISTANCE LEVEL @ 235/-RS
KEEP STOP LOSS @ 220-RS PROFIT TARGET -242 TO 250/-RS LEVEL CAN EXPECT
EARNINGS FOR FY 2018-19 ANALYST'S NOT EXPECTING A GOOD EPS GROWTH, SO DON'T HOLD TILL RESULTS IT'S SHORT TERM/MOMENTUM TRADE ONLY.


