TITAN UPMOVE COMING TITAN upmove coming
After long consolidation, showing upmove
Look for Increase in volume , prices will increase with increasing volumes
Next report date
—
Report period
—
EPS estimate
—
Revenue estimate
—
46.55 INR
33.37 B INR
603.72 B INR
366.16 M
About Titan Company Limited
Sector
Industry
CEO
Venkataraman Coimbatore
Website
Headquarters
Bangalore
Founded
1984
Identifiers
2
ISININE280A01028
Titan Co. Ltd. is a holding company, which manufactures and sells watches, jewelry, eyewear, and other accessories and products in India and internationally. It operates through four segments: Watches, Jewellery, Eyewear, and Others. The firm offers watches under the Titan, Titan Clock, Nebula, Octane, Fastrack, Zoop, Sonata, Favre-Leuba, SF, Xylys, Titan Raga, and Helios brands. It also provides jewelry, including pendants, rings, bracelets, earrings, gold watches, and gold and diamond jewelry under the Mia, Caratlane, Tanishq, and Zoya brands; and bags, belts, sunglasses, helmets, wallets, and watches under the Fastrack brand, as well as Police, Anne Klein, and Kenneth Cole licensed brands. The company was founded on July 26, 1984 and is headquartered in Bangalore, India.
Related stocks

W. D. Gann–based Forecast (Titan Company – Daily Chart)W. D. Gann–based Forecast (Titan Company – Daily Chart)
(Educational analysis, not financial advice)
1️⃣ Price–Time Squaring (Most Important Gann Rule)
Major low formed near ₹3,000 (Mar–Apr 2025 zone).
From this low, price has respected ascending Gann angles (1x1 & 2x1).
Current price (~₹3,880–3,9

Titan on 1W TF1. Titan have taken support on long term support zone for 3 times.
2. Near support zone, it have formed bullish candlestick patterns.
In May 2025, it have formed Bullish Morubozu like candle which was last hit to support zone.
3. In first week of July 2025, there was a strong bearih candle with v

TITAN- DECISIVE BREAKOUT OF 3900 should hit 4326Swing analysis of TITAN depicts that a possible breakout of 3900 levels should lead to target of 4326 based on
1) Swing Analysis
2) Fibo levels
3) Inverted head and shoulder pattern
Any retracement should be considered as an opportunity to buy. All our Stock ideas for positional and intraday trad

TITAN RANGE BREAKOUT WEEKLYTitan breaking a range weekly basis
with good volume last many weeks
bullish RSI above 60
strong q2 earnings,trading at ATH
target 4200 according to pivot point
NO BUY/SELL RECOMENDATION

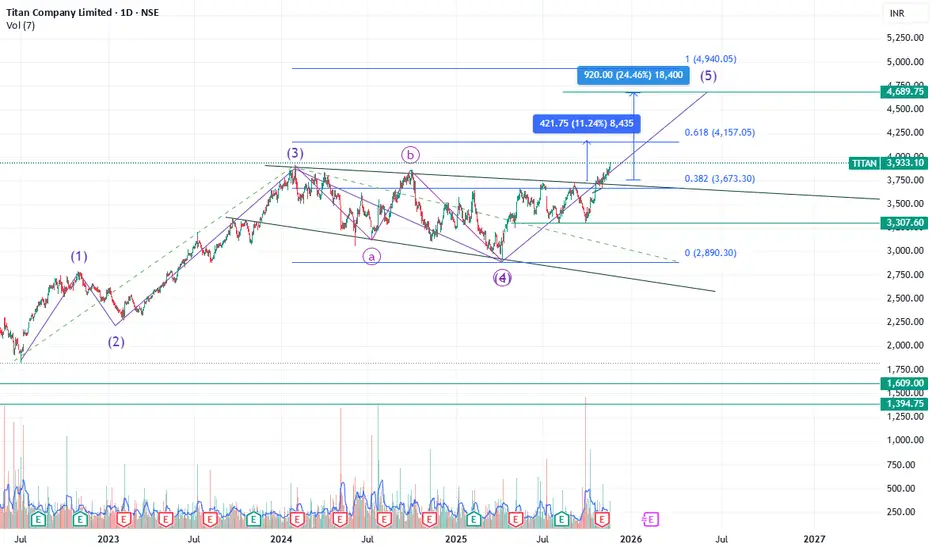
Titan Chart Explanation as per Elliott Wave.Titan Chart Explanation as per Elliott Wave
Your updated chart combines:
• Elliott Wave Count (1–5)
• A complete ABC correction for Wave 4
• Breakout from a long consolidation
• Fibonacci retracement projections
• Targets for Wave (5)
Below is the breakdown:
________________________________________
ATH Breakout TitanTitan is forming a large multi-month Rounding Bottom pattern, with the base created around ₹3050–3100 and the neckline placed at the strong resistance zone of ₹3800-3850.
The stock has tested this neckline multiple times, confirming it as a key supply level. Price is now has given breakout and clo

Titan Breakout Watch: Spotting the Ideal EntryTitan has confirmed a clean breakout on the weekly timeframe. Watching to see whether momentum continues or if a pullback offers a better risk-reward entry.

Titan Company: Supply Zone Test After Strong Q2Technical Analysis
Titan Company Limited showcases one of India's most spectacular wealth creation stories spanning over two decades. The stock has delivered a super bullish rally from less than ₹2 to reaching ₹3,886 in January 2024 - representing an extraordinary 1,900x+ growth over 20+ years.
T

Titan Company: Supply Zone Test After Strong Q2 🔍 Technical Analysis
Titan Company Limited showcases one of India's most spectacular wealth creation stories spanning over two decades. The stock has delivered a super bullish rally from less than ₹2 to reaching ₹3,886 in January 2024 - representing an extraordinary 1,900x+ growth over 20+ years.

See all ideas
Summarizing what the indicators are suggesting.
Neutral
SellBuy
Strong sellStrong buy
Strong sellSellNeutralBuyStrong buy
Neutral
SellBuy
Strong sellStrong buy
Strong sellSellNeutralBuyStrong buy
Neutral
SellBuy
Strong sellStrong buy
Strong sellSellNeutralBuyStrong buy
An aggregate view of professional's ratings.
Neutral
SellBuy
Strong sellStrong buy
Strong sellSellNeutralBuyStrong buy
Neutral
SellBuy
Strong sellStrong buy
Strong sellSellNeutralBuyStrong buy
Neutral
SellBuy
Strong sellStrong buy
Strong sellSellNeutralBuyStrong buy
Displays a symbol's price movements over previous years to identify recurring trends.
Frequently Asked Questions
The current price of TITAN is 3,902.50 INR — it has increased by 0.19% in the past 24 hours. Watch Titan Company Limited stock price performance more closely on the chart.
Depending on the exchange, the stock ticker may vary. For instance, on NSE exchange Titan Company Limited stocks are traded under the ticker TITAN.
TITAN stock has risen by 2.37% compared to the previous week, the month change is a 1.03% rise, over the last year Titan Company Limited has showed a 15.28% increase.
We've gathered analysts' opinions on Titan Company Limited future price: according to them, TITAN price has a max estimate of 4,700.00 INR and a min estimate of 3,450.00 INR. Watch TITAN chart and read a more detailed Titan Company Limited stock forecast: see what analysts think of Titan Company Limited and suggest that you do with its stocks.
TITAN reached its all-time high on Dec 19, 2025 with the price of 3,961.90 INR, and its all-time low was 1.35 INR and was reached on Sep 17, 2001. View more price dynamics on TITAN chart.
See other stocks reaching their highest and lowest prices.
See other stocks reaching their highest and lowest prices.
TITAN stock is 0.90% volatile and has beta coefficient of 0.91. Track Titan Company Limited stock price on the chart and check out the list of the most volatile stocks — is Titan Company Limited there?
Today Titan Company Limited has the market capitalization of 3.49 T, it has increased by 0.97% over the last week.
Yes, you can track Titan Company Limited financials in yearly and quarterly reports right on TradingView.
Titan Company Limited is going to release the next earnings report on Feb 10, 2026. Keep track of upcoming events with our Earnings Calendar.
TITAN earnings for the last quarter are 11.30 INR per share, whereas the estimation was 11.99 INR resulting in a −5.78% surprise. The estimated earnings for the next quarter are 13.99 INR per share. See more details about Titan Company Limited earnings.
Titan Company Limited revenue for the last quarter amounts to 165.34 B INR, despite the estimated figure of 155.14 B INR. In the next quarter, revenue is expected to reach 215.59 B INR.
TITAN net income for the last quarter is 11.20 B INR, while the quarter before that showed 10.91 B INR of net income which accounts for 2.66% change. Track more Titan Company Limited financial stats to get the full picture.
Yes, TITAN dividends are paid annually. The last dividend per share was 11.00 INR. As of today, Dividend Yield (TTM)% is 0.28%. Tracking Titan Company Limited dividends might help you take more informed decisions.
Titan Company Limited dividend yield was 0.36% in 2024, and payout ratio reached 29.24%. The year before the numbers were 0.29% and 27.92% correspondingly. See high-dividend stocks and find more opportunities for your portfolio.
As of Dec 24, 2025, the company has 17.82 K employees. See our rating of the largest employees — is Titan Company Limited on this list?
EBITDA measures a company's operating performance, its growth signifies an improvement in the efficiency of a company. Titan Company Limited EBITDA is 69.16 B INR, and current EBITDA margin is 9.44%. See more stats in Titan Company Limited financial statements.
Like other stocks, TITAN shares are traded on stock exchanges, e.g. Nasdaq, Nyse, Euronext, and the easiest way to buy them is through an online stock broker. To do this, you need to open an account and follow a broker's procedures, then start trading. You can trade Titan Company Limited stock right from TradingView charts — choose your broker and connect to your account.
Investing in stocks requires a comprehensive research: you should carefully study all the available data, e.g. company's financials, related news, and its technical analysis. So Titan Company Limited technincal analysis shows the buy rating today, and its 1 week rating is buy. Since market conditions are prone to changes, it's worth looking a bit further into the future — according to the 1 month rating Titan Company Limited stock shows the strong buy signal. See more of Titan Company Limited technicals for a more comprehensive analysis.
If you're still not sure, try looking for inspiration in our curated watchlists.
If you're still not sure, try looking for inspiration in our curated watchlists.