UNIONBANK - Cup & Handle Breakout for New HighsThe Core Idea: Classic Bullish Pattern Completion
The Weekly Chart for Union Bank of India is displaying a large, well-defined Cup & Handle Continuation Pattern. The "Cup" formed by the previous rally and consolidation, and the recent sideways movement below the 52-week high (₹160.15) constitutes
Next report date
—
Report period
—
EPS estimate
—
Revenue estimate
—
24.21 INR
180.27 B INR
1.30 T INR
1.93 B
About Union Bank of India Limited
Sector
Industry
CEO
Asheesh Pandey
Website
Headquarters
Mumbai
Founded
1919
IPO date
Feb 15, 2006
IPO offer price
2.49 USD
Identifiers
2
ISININE692A01016
Union Bank of India engages in the provision of commercial banking services. It also offers personal and corporate loans. The firm operates through the following segments: Treasury Operations, Corporate and Wholesale Banking, Retail Banking Operations and Other Banking Operations. The company was founded on November 11, 1919 and is headquartered in Mumbai, India.
Related stocks

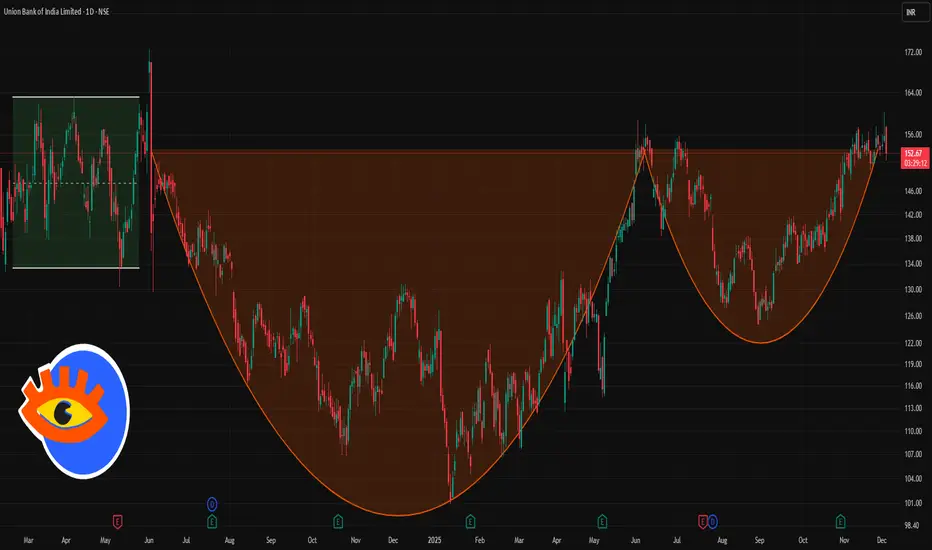
UNIONBANK 1 Day Time Frame 📊 Key Price Levels Today
Recent closing / last traded price: ~ ₹ 152.9 – ₹ 153.
Day’s high / observed swing high: ~ ₹ 160.10 – ₹ 160.15.
Day’s low / support area: ~ ₹ 151–152 zone (recent low and current price region).
52‑week high: ~ ₹ 160.15
52‑week low: ~ ₹ 100.81
✅ What This Means for Trad
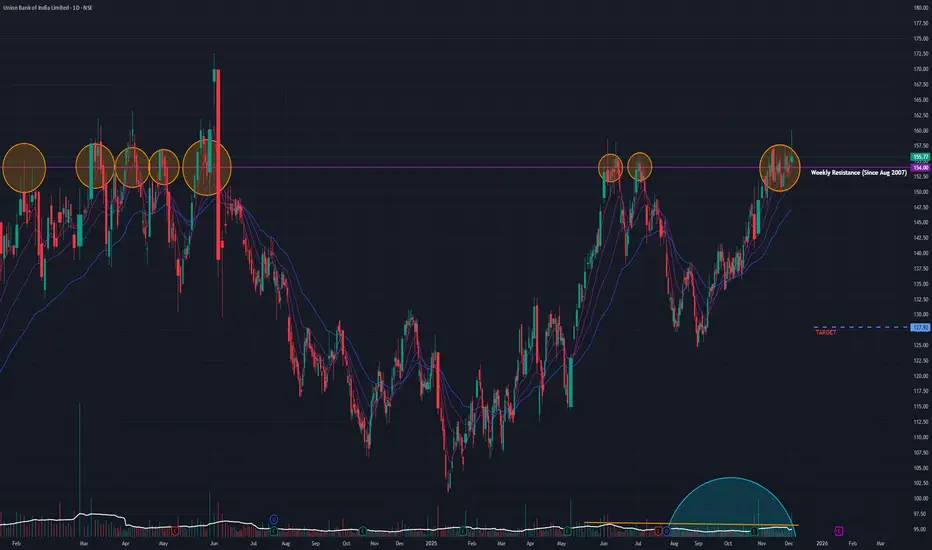
Union Bank (D): Cautiously Bullish - Breakout with RejectionTimeframe: Daily | Scale: Linear
The stock has attempted a breakout from a massive 15-year structural resistance, driven by index inclusion news. However, the daily price action signals strong profit-taking at higher levels, making the breakout fragile.
🚀 1. The Fundamental Catalyst (The "Why")
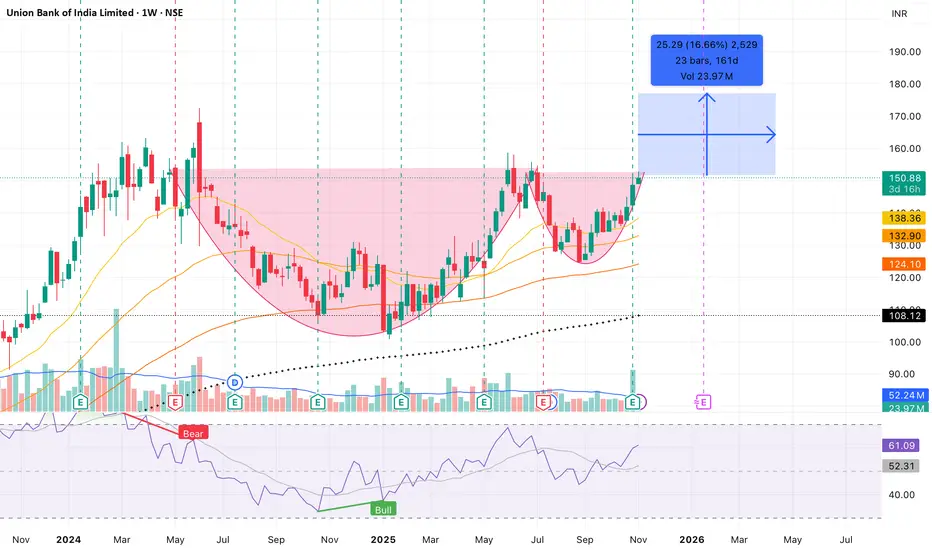
UNION BANK - 50% upside in next 1 year suggest Weekly chartsUNION BANK - 50% upside in next 1 year suggest Weekly charts
LTP - 155
Targets - 230+ {50% upside}
Timeframe - 12-18 Months.
Union bank weekly chart suggest Breakout from existing CUP & Handle Pattern.
Happy Investing.

UNIONBANK 1 Week Time Frame 🔎 Current snapshot
Share price recently around ₹152.85–₹156.94.
52-week trading range: ~₹100.81 (low) to ~₹158.65 (high).
Fundamentals wise: low P/E vs peers, reasonable book value / dividend yield.
📈 Short-term (1-week) “Levels to watch”
Based on technical-forecast projections from providers:

Union Bank of India – Cup and Handle Breakout Formation on Week.Union Bank (NSE: UNIONBANK) is displaying a classic Cup and Handle formation on the weekly timeframe, indicating a potential continuation of the long-term uptrend.
Technical Overview:
• Pattern: Cup & Handle
• Breakout Zone: ₹150–155
• Target Zone: ₹175–180 (≈16–17% potential)
• Support Levels: ₹13
UNIONBANKUNIONBANK
bullish trend is Showing on the chart.
buy signals in
technical indicators and
A head and shoulders pattern is forming
Watch for a level 172/175 and 150/153 to sustain the bullish trend. If the resistance holds, there could be a retest towards 110/115 and an uptrend from here.

UNIONBANK: Cup & Handle Sets Stage for UpsideThe chart for Union Bank of India Limited (NSE: UNIONBANK) shows a classic "Cup and Handle" pattern forming over a multi-year period, which is a bullish technical setup supported by steadily increasing volume and positive price action.
• The cup portion covers a deep, rounded bottom with a gradua

union bank of indiaweeky chart cup and handle forming entry target SL as shown in chart union bank of india

UNIONBANK | Cup & Handle breakout aheadUNIONBANK | Cup & Handle breakout ahead
CMP : 149
Something interesting is coming up from this counter

See all ideas
Summarizing what the indicators are suggesting.
Neutral
SellBuy
Strong sellStrong buy
Strong sellSellNeutralBuyStrong buy
Neutral
SellBuy
Strong sellStrong buy
Strong sellSellNeutralBuyStrong buy
Neutral
SellBuy
Strong sellStrong buy
Strong sellSellNeutralBuyStrong buy
An aggregate view of professional's ratings.
Neutral
SellBuy
Strong sellStrong buy
Strong sellSellNeutralBuyStrong buy
Neutral
SellBuy
Strong sellStrong buy
Strong sellSellNeutralBuyStrong buy
Neutral
SellBuy
Strong sellStrong buy
Strong sellSellNeutralBuyStrong buy
Displays a symbol's price movements over previous years to identify recurring trends.
EEDM
iShares IV PLC - iShares MSCI EM CTB Enhanced ESG UCITS ETF Unhedged USDWeight
0.14%
Market value
11.67 M
USD
EDM2
iShares IV PLC - iShares MSCI EM CTB Enhanced ESG UCITS ETF Accum Shs Unhedged USDWeight
0.14%
Market value
11.67 M
USD
Explore more ETFs
Frequently Asked Questions
The current price of UNIONBANK is 152.00 INR — it has decreased by −0.29% in the past 24 hours. Watch Union Bank of India Limited stock price performance more closely on the chart.
Depending on the exchange, the stock ticker may vary. For instance, on NSE exchange Union Bank of India Limited stocks are traded under the ticker UNIONBANK.
UNIONBANK stock has fallen by −0.65% compared to the previous week, the month change is a −0.42% fall, over the last year Union Bank of India Limited has showed a 28.02% increase.
We've gathered analysts' opinions on Union Bank of India Limited future price: according to them, UNIONBANK price has a max estimate of 192.00 INR and a min estimate of 140.00 INR. Watch UNIONBANK chart and read a more detailed Union Bank of India Limited stock forecast: see what analysts think of Union Bank of India Limited and suggest that you do with its stocks.
UNIONBANK reached its all-time high on Oct 27, 2010 with the price of 426.95 INR, and its all-time low was 14.60 INR and was reached on Oct 17, 2002. View more price dynamics on UNIONBANK chart.
See other stocks reaching their highest and lowest prices.
See other stocks reaching their highest and lowest prices.
UNIONBANK stock is 0.90% volatile and has beta coefficient of 1.86. Track Union Bank of India Limited stock price on the chart and check out the list of the most volatile stocks — is Union Bank of India Limited there?
Today Union Bank of India Limited has the market capitalization of 1.17 T, it has increased by 0.95% over the last week.
Yes, you can track Union Bank of India Limited financials in yearly and quarterly reports right on TradingView.
Union Bank of India Limited is going to release the next earnings report on Jan 19, 2026. Keep track of upcoming events with our Earnings Calendar.
UNIONBANK earnings for the last quarter are 5.58 INR per share, whereas the estimation was 5.07 INR resulting in a 10.17% surprise. The estimated earnings for the next quarter are 5.01 INR per share. See more details about Union Bank of India Limited earnings.
Union Bank of India Limited revenue for the last quarter amounts to 138.08 B INR, despite the estimated figure of 134.63 B INR. In the next quarter, revenue is expected to reach 136.85 B INR.
UNIONBANK net income for the last quarter is 44.26 B INR, while the quarter before that showed 44.28 B INR of net income which accounts for −0.04% change. Track more Union Bank of India Limited financial stats to get the full picture.
Yes, UNIONBANK dividends are paid annually. The last dividend per share was 4.75 INR. As of today, Dividend Yield (TTM)% is 3.11%. Tracking Union Bank of India Limited dividends might help you take more informed decisions.
Union Bank of India Limited dividend yield was 3.76% in 2024, and payout ratio reached 20.11%. The year before the numbers were 2.35% and 18.79% correspondingly. See high-dividend stocks and find more opportunities for your portfolio.
As of Dec 24, 2025, the company has 73.94 K employees. See our rating of the largest employees — is Union Bank of India Limited on this list?
Like other stocks, UNIONBANK shares are traded on stock exchanges, e.g. Nasdaq, Nyse, Euronext, and the easiest way to buy them is through an online stock broker. To do this, you need to open an account and follow a broker's procedures, then start trading. You can trade Union Bank of India Limited stock right from TradingView charts — choose your broker and connect to your account.
Investing in stocks requires a comprehensive research: you should carefully study all the available data, e.g. company's financials, related news, and its technical analysis. So Union Bank of India Limited technincal analysis shows the neutral today, and its 1 week rating is buy. Since market conditions are prone to changes, it's worth looking a bit further into the future — according to the 1 month rating Union Bank of India Limited stock shows the strong buy signal. See more of Union Bank of India Limited technicals for a more comprehensive analysis.
If you're still not sure, try looking for inspiration in our curated watchlists.
If you're still not sure, try looking for inspiration in our curated watchlists.