UPL (W): Strongly Bullish, Fundamentally-Driven BreakoutBased on Weekly Timeframe, Logarithmic Scale
This is a high-conviction breakout. The stock has decisively broken a 4.5-year angular resistance, driven by a blockbuster quarterly earnings report that confirmed a strong business turnaround. The alignment of high-timeframe indicators suggests a new l
Next report date
—
Report period
—
EPS estimate
—
Revenue estimate
—
26.10 INR
7.59 B INR
464.51 B INR
558.19 M
About UPL Limited
Sector
Industry
CEO
Jaidev Rajnikant Shroff
Website
Headquarters
Mumbai
Founded
1969
ISIN
INE628A01036
FIGI
BBG000JN71Q0
UPL Ltd. engages in the business of manufacturing and sale of pesticides, insecticide, and micronutrients. It operates through the following segments: Crop Protection, Seeds Business, and Non-Agro. The Crop Protection segment includes the manufacture and marketing of conventional agrochemical products, and other agricultural related products. The Seeds Business segment manufactures seeds. The Non-Agro segment focuses on the manufacturing and marketing of industrial chemical and other non-agricultural related products. The company was founded by Rajnikant Devidas Shroff on May 29, 1969 and is headquartered in Mumbai, India.
Related stocks
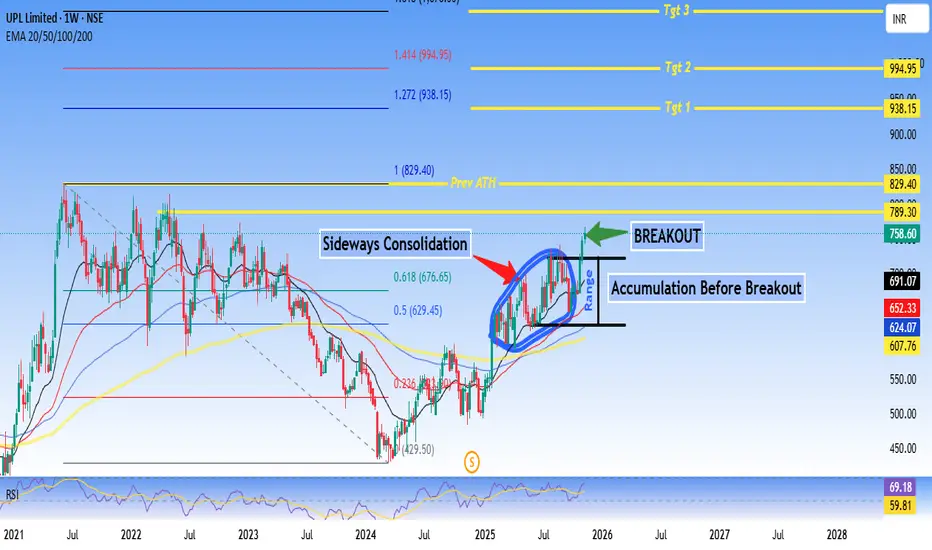
UPL Limited approaching Prev ATH - Technical AnalysisUPL Limited - #Breakout Setup After #Accumulation Phase
Current Price: 691.07
Good For Swing to Short-term Trading.
Technical Summary:
UPL is showing a classic accumulation-to-breakout pattern after an extended sideways #consolidation phase. The stock has broken out from a well-defined range with
UPL Limited – Weekly Chart Analysis
📊 UPL Limited – Weekly Chart Analysis
Company Overview:
UPL Limited is a global leader in sustainable agricultural solutions, ranked among the top five agricultural solutions companies worldwide. The company operates across multiple countries, offering an integrated portfolio of patented and po
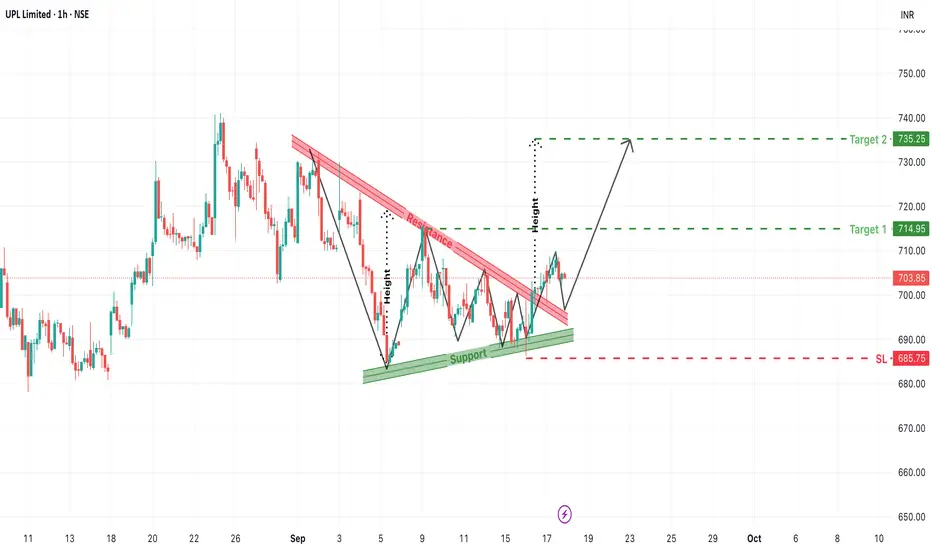
UPL - Multi time frame analysisThe price is consolidating between the range of 710 to 720. Buying levels are 710, 720, depending on your trading style. As per the daily chart, the price is giving a trend line breakout.
Buy above 715 to 718 with the stop loss of 705 for the targets 724, 736, 748 and 756.
If the price shows bearis
Short to be expected A small move to down wards to be expected from the chart above. Just chart analysis simple price action.
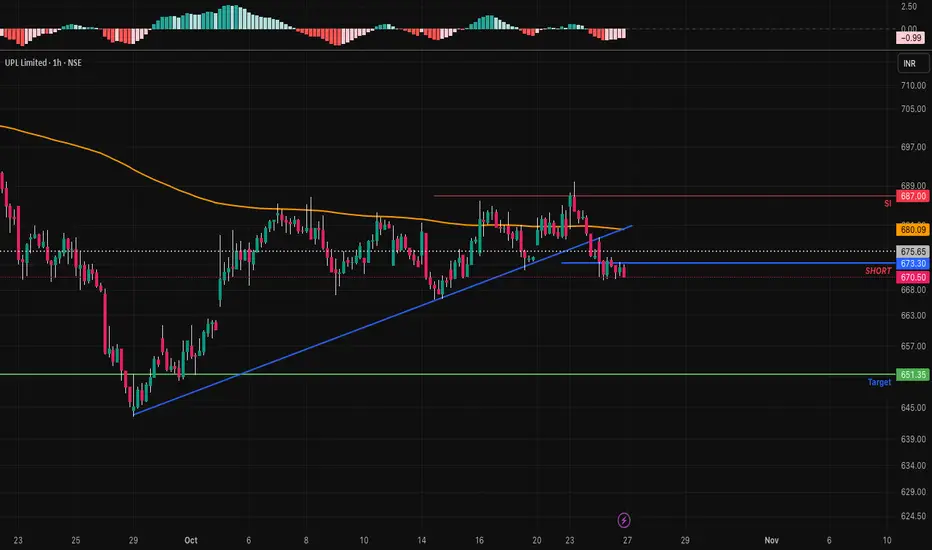
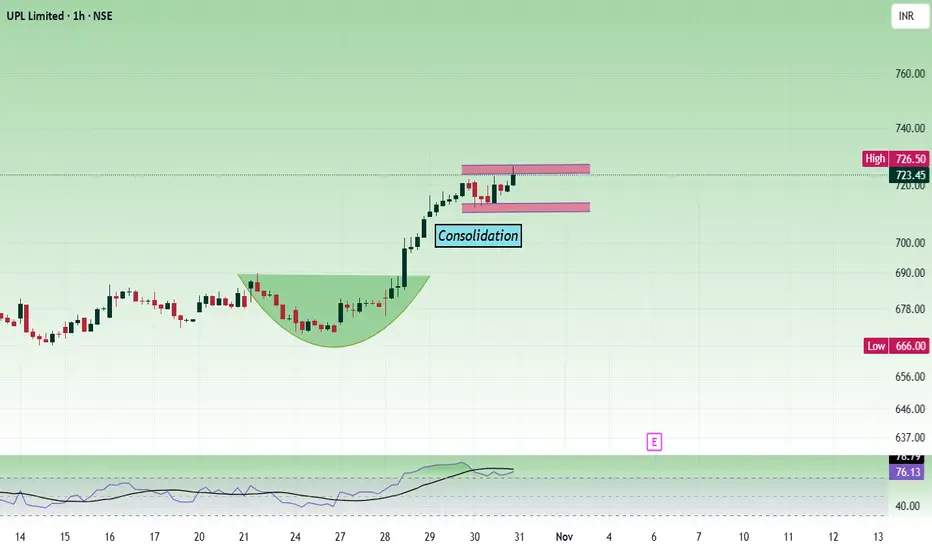
UPL Breakout from Falling Wedge: Bullish Continuation Ahead?The chart for UPL Limited (1-Hour, NSE) presents a promising bullish breakout scenario, emerging from a well-defined falling wedge (descending channel). Traders and investors watching for breakout opportunities will want to monitor this move closely as the price breaks above resistance with potentia
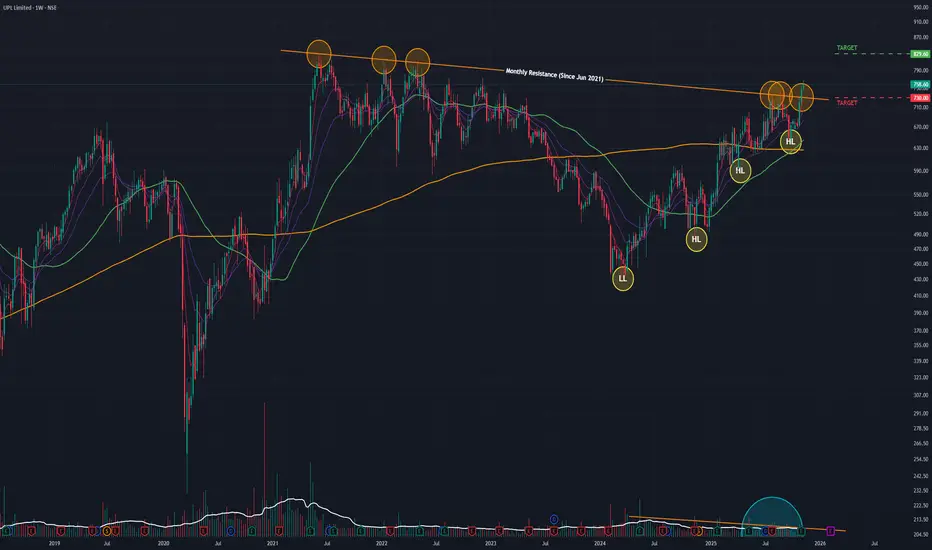
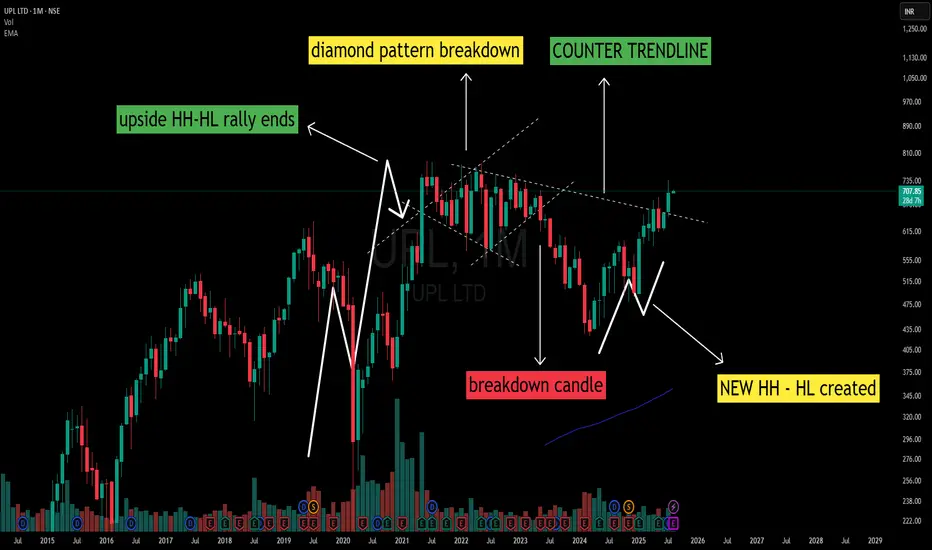
UPL – Diamond Pattern Breakdown to W-Bottom Reversal The monthly chart of UPL reflects a complete structural cycle:
1️⃣ Uptrend Phase:
A clear sequence of Higher Highs – Higher Lows (HH-HL) marked the early rally.
2️⃣ Diamond Pattern at Peak:
A diamond-shaped consolidation developed at the top of the rally, a common occurrence near trend maturity.
3️
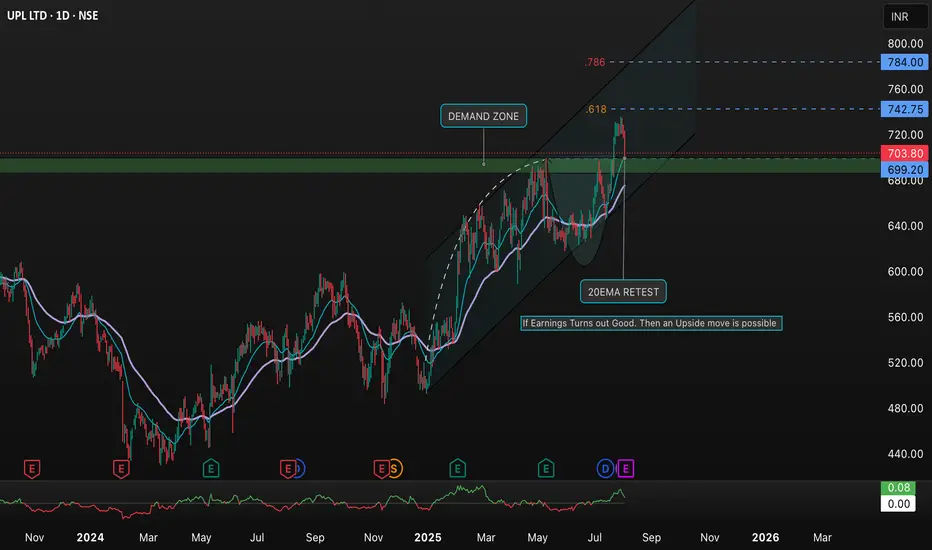
UPL LTD - Daily Chart Analysis with Demand Zone & Key ResistanceDescription:
This chart analyzes UPL LTD (NSE:UPL) on the daily timeframe. Key highlights include:
• Demand Zone: The chart marks a demand zone where buying interest is expected to be strong.
• Fibonacci Levels: Major resistance at the 0.618 and 0.786 Fibonacci retracement zones (around 720 and 78
UPL# Watchlist
#UPL (W) is looking good above 740/750 for tgt 800/850 soon.
Weakness below 670.
Cup and Handle Breakout + Resistance Trendline + Horizontal Resistance Breakout.
# Disclaimer: View shared it for educational purposes only.

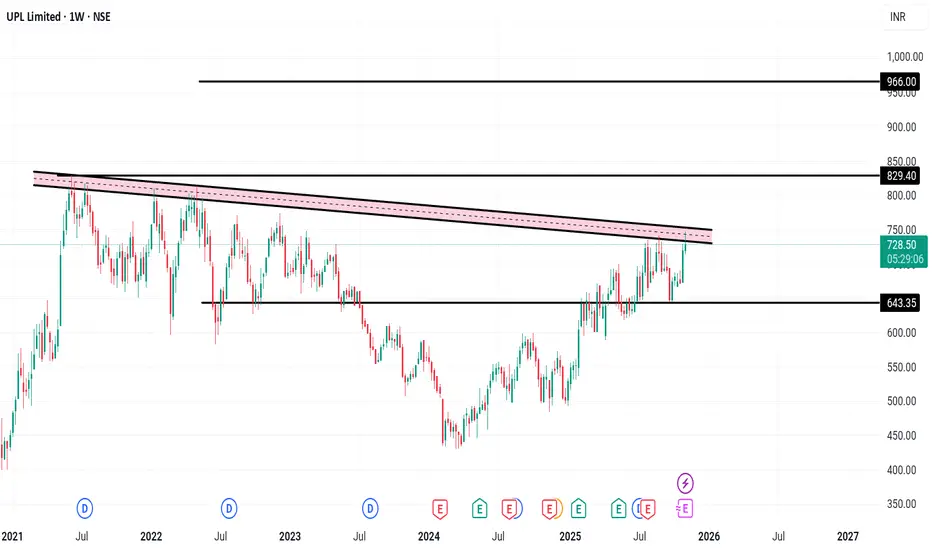
UPL LTD Date 27.07.2025
UPL
Timeframe : Weekly
Technical remark :
Amid heavy correction in broader market, Upl is holding strong after the breakout from symmetrical triangle.
Keep 670 as swing stop-loss & trail
About :
UPL is principally engaged in the business of agrochemicals, industrial chemic

See all ideas
Summarizing what the indicators are suggesting.
Neutral
SellBuy
Strong sellStrong buy
Strong sellSellNeutralBuyStrong buy
Neutral
SellBuy
Strong sellStrong buy
Strong sellSellNeutralBuyStrong buy
Neutral
SellBuy
Strong sellStrong buy
Strong sellSellNeutralBuyStrong buy
An aggregate view of professional's ratings.
Neutral
SellBuy
Strong sellStrong buy
Strong sellSellNeutralBuyStrong buy
Neutral
SellBuy
Strong sellStrong buy
Strong sellSellNeutralBuyStrong buy
Neutral
SellBuy
Strong sellStrong buy
Strong sellSellNeutralBuyStrong buy
Displays a symbol's price movements over previous years to identify recurring trends.
UPLC5000773
UPL Corporation Limited 4.625% 16-JUN-2030Yield to maturity
6.36%
Maturity date
Jun 16, 2030
UPLC4611648
UPL Corporation Limited 4.5% 08-MAR-2028Yield to maturity
5.98%
Maturity date
Mar 8, 2028
78KL45
Kerala Enviro Infrastructure Ltd. 7.8% 02-NOV-2045Yield to maturity
—
Maturity date
Nov 2, 2045
See all UPL bonds
GUNR
FlexShares Morningstar Global Upstream Natural Resources Index FundWeight
0.71%
Market value
38.51 M
USD
EEDM
iShares IV PLC - iShares MSCI EM CTB Enhanced ESG UCITS ETF Unhedged USDWeight
0.20%
Market value
16.24 M
USD
EDM2
iShares IV PLC - iShares MSCI EM CTB Enhanced ESG UCITS ETF Accum Shs Unhedged USDWeight
0.20%
Market value
16.24 M
USD
Explore more ETFs
Frequently Asked Questions
The current price of UPL is 760.60 INR — it has increased by 1.37% in the past 24 hours. Watch UPL Limited stock price performance more closely on the chart.
Depending on the exchange, the stock ticker may vary. For instance, on NSE exchange UPL Limited stocks are traded under the ticker UPL.
UPL stock hasn't changed in a week, the month change is a 12.93% rise, over the last year UPL Limited has showed a 39.56% increase.
We've gathered analysts' opinions on UPL Limited future price: according to them, UPL price has a max estimate of 980.00 INR and a min estimate of 580.00 INR. Watch UPL chart and read a more detailed UPL Limited stock forecast: see what analysts think of UPL Limited and suggest that you do with its stocks.
UPL stock is 2.24% volatile and has beta coefficient of 0.82. Track UPL Limited stock price on the chart and check out the list of the most volatile stocks — is UPL Limited there?
Today UPL Limited has the market capitalization of 632.23 B, it has increased by 3.37% over the last week.
Yes, you can track UPL Limited financials in yearly and quarterly reports right on TradingView.
UPL Limited is going to release the next earnings report on Feb 14, 2026. Keep track of upcoming events with our Earnings Calendar.
UPL earnings for the last quarter are 5.80 INR per share, whereas the estimation was 3.25 INR resulting in a 78.46% surprise. The estimated earnings for the next quarter are 4.90 INR per share. See more details about UPL Limited earnings.
UPL Limited revenue for the last quarter amounts to 120.19 B INR, despite the estimated figure of 113.92 B INR. In the next quarter, revenue is expected to reach 118.31 B INR.
UPL net income for the last quarter is 5.53 B INR, while the quarter before that showed −880.00 M INR of net income which accounts for 728.41% change. Track more UPL Limited financial stats to get the full picture.
Yes, UPL dividends are paid annually. The last dividend per share was 6.00 INR. As of today, Dividend Yield (TTM)% is 0.80%. Tracking UPL Limited dividends might help you take more informed decisions.
As of Nov 26, 2025, the company has 12 K employees. See our rating of the largest employees — is UPL Limited on this list?
EBITDA measures a company's operating performance, its growth signifies an improvement in the efficiency of a company. UPL Limited EBITDA is 92.13 B INR, and current EBITDA margin is 17.17%. See more stats in UPL Limited financial statements.
Like other stocks, UPL shares are traded on stock exchanges, e.g. Nasdaq, Nyse, Euronext, and the easiest way to buy them is through an online stock broker. To do this, you need to open an account and follow a broker's procedures, then start trading. You can trade UPL Limited stock right from TradingView charts — choose your broker and connect to your account.
Investing in stocks requires a comprehensive research: you should carefully study all the available data, e.g. company's financials, related news, and its technical analysis. So UPL Limited technincal analysis shows the strong buy rating today, and its 1 week rating is buy. Since market conditions are prone to changes, it's worth looking a bit further into the future — according to the 1 month rating UPL Limited stock shows the buy signal. See more of UPL Limited technicals for a more comprehensive analysis.
If you're still not sure, try looking for inspiration in our curated watchlists.
If you're still not sure, try looking for inspiration in our curated watchlists.