Vedanta: Strength Looks Simple — Patience Makes It ProfitableEveryone wants to catch the trend,
but few can sit through it without second-guessing themselves.
That’s what separates disciplined traders from impulsive ones.
🔎 Technical Context
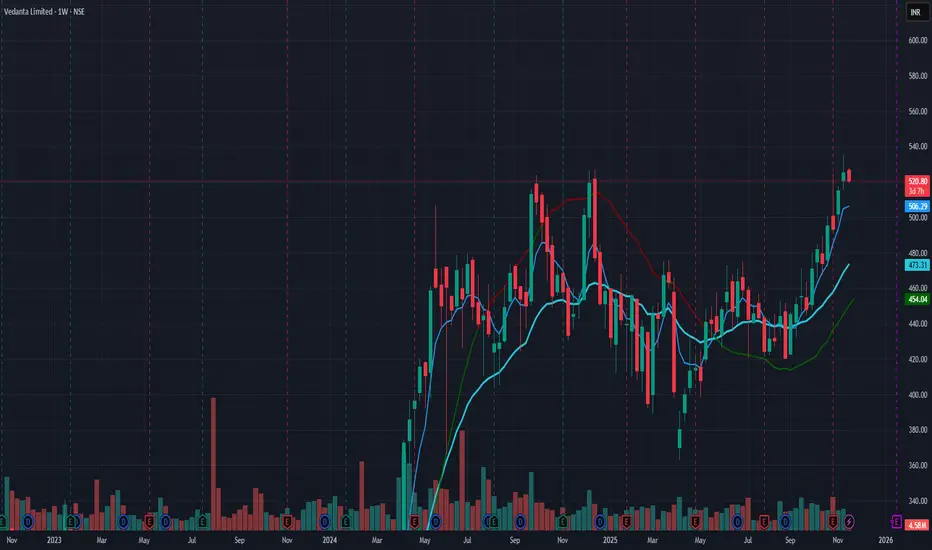
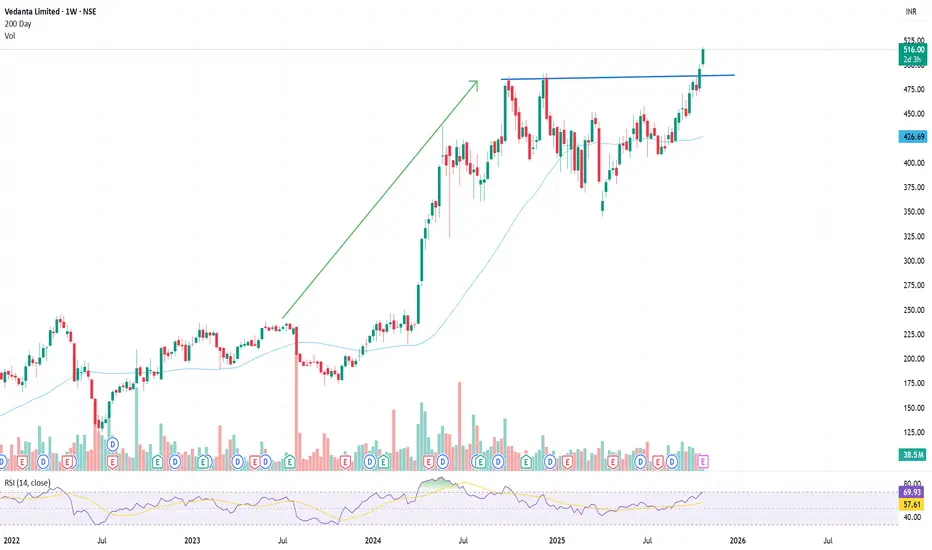
On the daily chart, price is in a clean uptrend — higher highs, higher lows.
Currently hovering around ₹520, testing
Next report date
—
Report period
—
EPS estimate
—
Revenue estimate
—
30.75 INR
149.88 B INR
1.54 T INR
1.62 B
About Vedanta Limited
Sector
Industry
Website
Headquarters
Mumbai
Founded
1965
ISIN
INE205A01025
FIGI
BBG000CZGB60
Vedanta Ltd. is a natural resource company, which engages in the exploration, extraction, and processing of minerals, oil, and gas properties. It operates through the following segments: Copper, Aluminum, Iron Ore, Power, and Oil & Gas. The Copper segment focuses in custom smelting and also include a copper smelter, a refinery, a phosphoric acid plant, a sulphuric acid plant, a copper rod plant, and three captive power plants. The Aluminum segment comprises refinery and a captive power plant at Lanjigarh and a smelter, a thermal coal based captive power facility at Jharsuguda both situated in the State of Odisha in India. The Iron Ore segment explores, mines, and processes iron ore, pig iron, and metallurgical coke. The Power segment consists 600 MW thermal coal-based commercial power facility at Jharsuguda in the State of Odisha in Eastern India. The Oil and Gas segment involves in the exploration and development and production of oil and gas. The company was founded by Dwarka Prasad Agarwal on June 25, 1965 and is headquartered in Mumbai, India.
Related stocks
Long VEDL 560after a good consolidation Vedl has given a breakout today, looks it can move 5-7% in coming days.
Long VEDL
SL 523
Target 560
time 1 week

Vedanta Ltd.(VEDL)Time Cycle is a routine that allows you to map the movement of a stock by measuring the high and low levels of the stock on a day or period. However, it does not prove whether a reversal will occur in the next time cycle; it is only a probability. But it makes you profitable 80% of the time.
Regard

VEDL 1 Month View 📐 Key levels to watch (1-month horizon)
Support zones
Strong near-term support: ~ ₹ 503.
Next support layer: ~ ₹ 490-483 zone.
If broader breakdown: ~ ₹ 451-466 area (per monthly Fibonacci/Support).
Resistance zones
Immediate resistance: ~ ₹ 522-525.
🎯 My estimated “target & risk” for next m
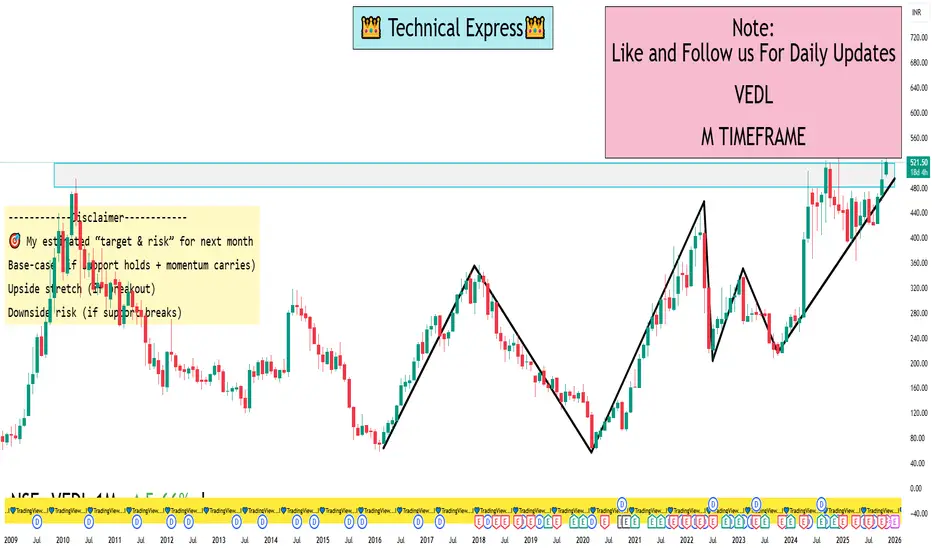
Vedanta (M): Bullish, but at a critical decision point.The stock is currently consolidating in a tight range after a historic, multi-decade breakout. The price is now coiling for its next major move. The key is whether the old resistance at ₹490 holds as new support.
📈 1. The Long-Term Context (The "Big Picture")
- Historic Breakout: After a lon
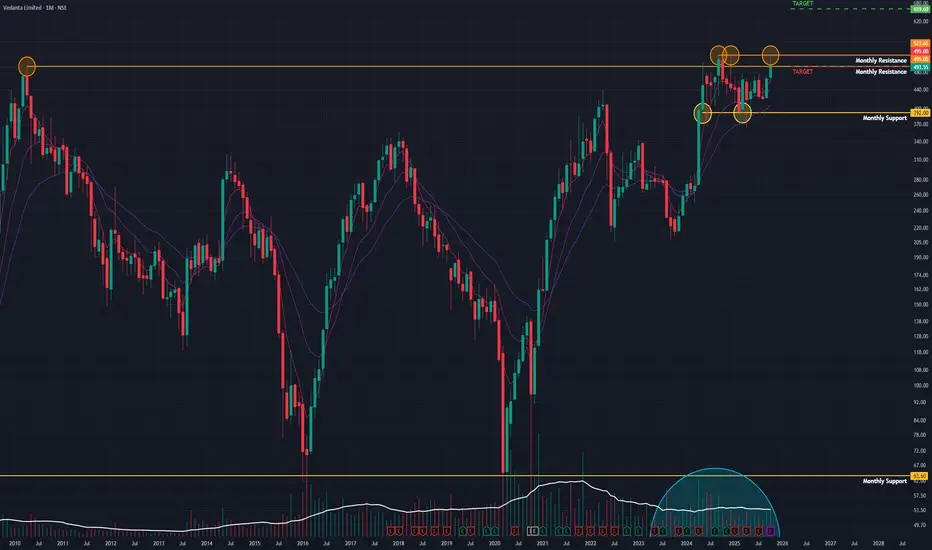
VEDL 1 Month Time Frame 🧭 Key levels to watch in the next ~4-5 weeks
Here are support and resistance levels relevant for the 1-month horizon:
🔷 Resistance
~ ₹501.40 — Monthly pivot/standard resistance level.
More immediate short-term resistance around ~ ₹497-₹500 zone based on recent highs.
🔻 Support
First key support
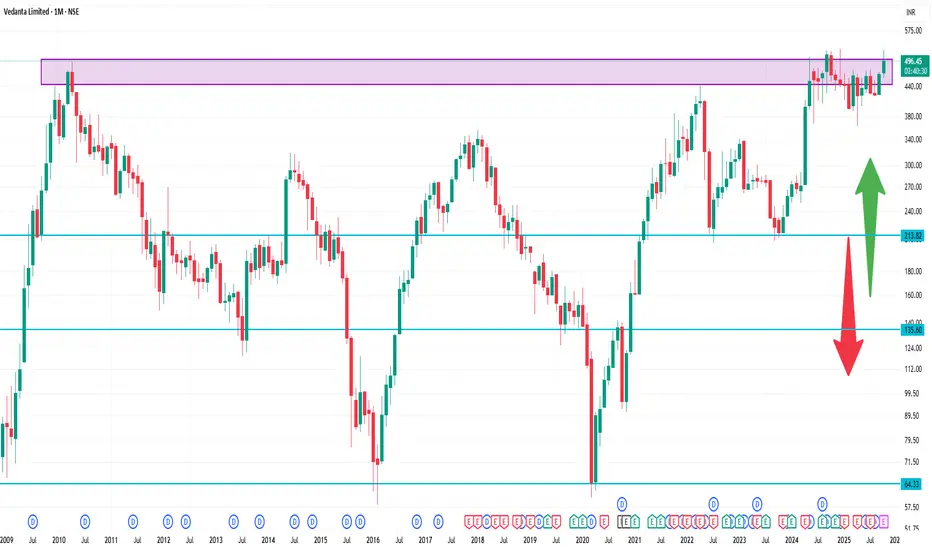
vedl Strong Multi-year 𝗕𝗿𝗲𝗮𝗸𝗼𝘂𝘁 Candidate!
VEDL
Watch for a breakout above 500/510 to sustain the bullish trend. If the resistance holds, there could be a retest towards 400/410 and an uptrend from here.
- Market Cap₹ 1,95,910 Cr.
- FY25 Revenue: ~₹1.5 lakh crore
- Net Profit: ~₹18,000 Cr
- ROE: ~38.5

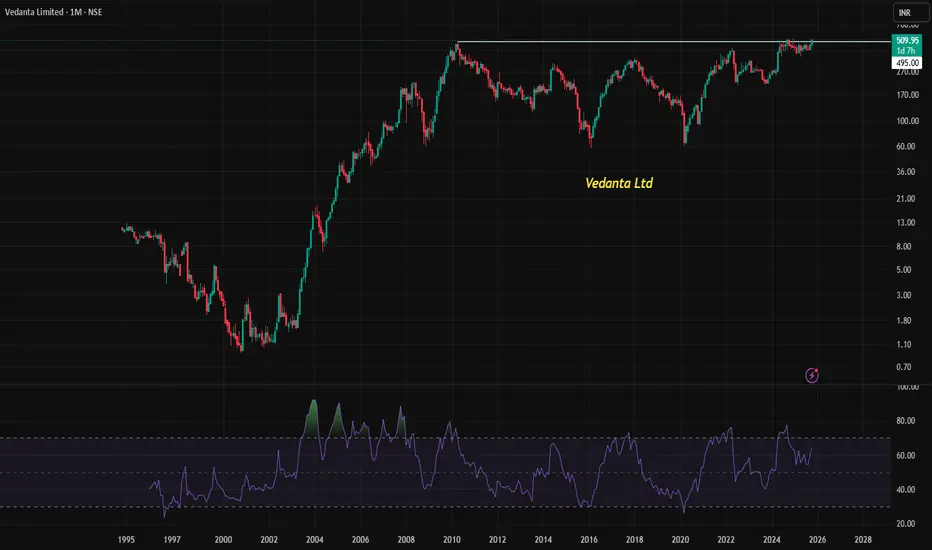
Vedanta Limited is experiencing a major technical breakoutVedanta Limited is experiencing a major technical breakout, surpassing its previous lifetime high from 2010, with strong RSI momentum signaling bullish strength.
📈 Vedanta Limited: A Technical Breakout After 15 Years
Vedanta Limited (NSE: VEDL), a major player in the metals and mining sector, is cu
VEDLStrong Breakout Candidates!
#VEDL
1- Bottom Formation bo.
2- Uptrend is Still Intact
3- Trading above all key moving averages
Keep on Radar.
Potential Upside Stocks!
#Disclaimer: View shared it for educational purposes only.
Follow for more upcoming charts.

I see a Cup and handle pattern, Do You?Stock has an underlying tailwind. Price of Aluminium and it is certainly reflecting now in the price. Baseline breakout level plus depth of the cup is the target
See all ideas
Summarizing what the indicators are suggesting.
Neutral
SellBuy
Strong sellStrong buy
Strong sellSellNeutralBuyStrong buy
Neutral
SellBuy
Strong sellStrong buy
Strong sellSellNeutralBuyStrong buy
Neutral
SellBuy
Strong sellStrong buy
Strong sellSellNeutralBuyStrong buy
An aggregate view of professional's ratings.
Neutral
SellBuy
Strong sellStrong buy
Strong sellSellNeutralBuyStrong buy
Neutral
SellBuy
Strong sellStrong buy
Strong sellSellNeutralBuyStrong buy
Neutral
SellBuy
Strong sellStrong buy
Strong sellSellNeutralBuyStrong buy
Displays a symbol's price movements over previous years to identify recurring trends.
95VL27
Vedanta Limited 9.5% 20-AUG-2027Yield to maturity
—
Maturity date
Aug 20, 2027
94VL27
Vedanta Limited 9.4% 20-FEB-2027Yield to maturity
—
Maturity date
Feb 20, 2027
874VL32
Vedanta Limited 8.74% 29-JUN-2032Yield to maturity
—
Maturity date
Jun 29, 2032
931VL27
Vedanta Limited 9.31% 03-DEC-2027Yield to maturity
—
Maturity date
Dec 3, 2027
92VL30
Vedanta Limited 9.2% 25-FEB-2030Yield to maturity
—
Maturity date
Feb 25, 2030
VL050625
Vedanta Limited FRN 04-JUN-2027Yield to maturity
—
Maturity date
Jun 4, 2027
945VL28
Vedanta Limited 9.45% 05-JUN-2028Yield to maturity
—
Maturity date
Jun 5, 2028
See all VEDL bonds
Curated watchlists where VEDL is featured.

Frequently Asked Questions
The current price of VEDL is 495.15 INR — it has decreased by −0.25% in the past 24 hours. Watch Vedanta Limited stock price performance more closely on the chart.
Depending on the exchange, the stock ticker may vary. For instance, on NSE exchange Vedanta Limited stocks are traded under the ticker VEDL.
VEDL stock has fallen by −6.03% compared to the previous week, the month change is a 1.05% rise, over the last year Vedanta Limited has showed a 11.58% increase.
We've gathered analysts' opinions on Vedanta Limited future price: according to them, VEDL price has a max estimate of 686.00 INR and a min estimate of 480.00 INR. Watch VEDL chart and read a more detailed Vedanta Limited stock forecast: see what analysts think of Vedanta Limited and suggest that you do with its stocks.
VEDL reached its all-time high on Nov 13, 2025 with the price of 535.50 INR, and its all-time low was 0.95 INR and was reached on Oct 24, 2000. View more price dynamics on VEDL chart.
See other stocks reaching their highest and lowest prices.
See other stocks reaching their highest and lowest prices.
VEDL stock is 1.96% volatile and has beta coefficient of 1.82. Track Vedanta Limited stock price on the chart and check out the list of the most volatile stocks — is Vedanta Limited there?
Today Vedanta Limited has the market capitalization of 1.94 T, it has increased by 2.81% over the last week.
Yes, you can track Vedanta Limited financials in yearly and quarterly reports right on TradingView.
Vedanta Limited is going to release the next earnings report on Jan 23, 2026. Keep track of upcoming events with our Earnings Calendar.
Vedanta Limited revenue for the last quarter amounts to 398.68 B INR, despite the estimated figure of 386.39 B INR. In the next quarter, revenue is expected to reach 419.60 B INR.
VEDL net income for the last quarter is 17.98 B INR, while the quarter before that showed 31.85 B INR of net income which accounts for −43.55% change. Track more Vedanta Limited financial stats to get the full picture.
Vedanta Limited dividend yield was 9.37% in 2024, and payout ratio reached 111.63%. The year before the numbers were 10.86% and 258.74% correspondingly. See high-dividend stocks and find more opportunities for your portfolio.
As of Nov 25, 2025, the company has 117.26 K employees. See our rating of the largest employees — is Vedanta Limited on this list?
EBITDA measures a company's operating performance, its growth signifies an improvement in the efficiency of a company. Vedanta Limited EBITDA is 424.78 B INR, and current EBITDA margin is 28.51%. See more stats in Vedanta Limited financial statements.
Like other stocks, VEDL shares are traded on stock exchanges, e.g. Nasdaq, Nyse, Euronext, and the easiest way to buy them is through an online stock broker. To do this, you need to open an account and follow a broker's procedures, then start trading. You can trade Vedanta Limited stock right from TradingView charts — choose your broker and connect to your account.
Investing in stocks requires a comprehensive research: you should carefully study all the available data, e.g. company's financials, related news, and its technical analysis. So Vedanta Limited technincal analysis shows the sell today, and its 1 week rating is buy. Since market conditions are prone to changes, it's worth looking a bit further into the future — according to the 1 month rating Vedanta Limited stock shows the strong buy signal. See more of Vedanta Limited technicals for a more comprehensive analysis.
If you're still not sure, try looking for inspiration in our curated watchlists.
If you're still not sure, try looking for inspiration in our curated watchlists.