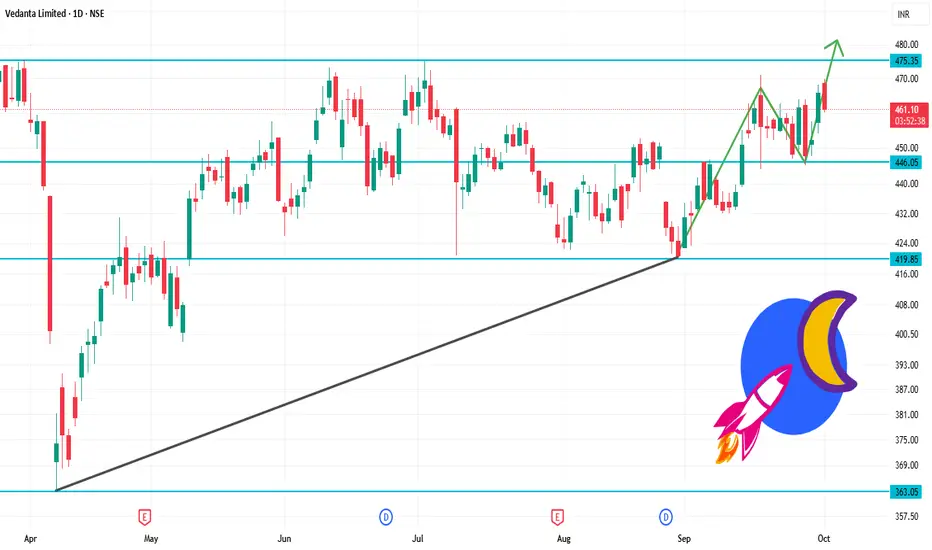
VEDL 1D Time frameOpening Price: ₹468.55
Closing Price: ₹461.40
Day Range: ₹463.00 – ₹469.85
Volume: 2,730,213 shares traded
📉 Trend Analysis
Short-Term Trend: Bearish – The stock is trading below key moving averages, confirming the bearish trend.
Medium-Term Trend: Neutral – The stock is in a consolidation phase, characterized by lower highs and lower lows.
Long-Term Trend: Neutral – No significant trend identified; the stock is trading within a range.
🔮 Conclusion
Vedanta Ltd. is in a bearish trend with weak momentum.
Break below ₹460.00 could lead to further decline toward ₹455.00.
Break above ₹475.00 would indicate a potential trend reversal.
VEDL trade ideas
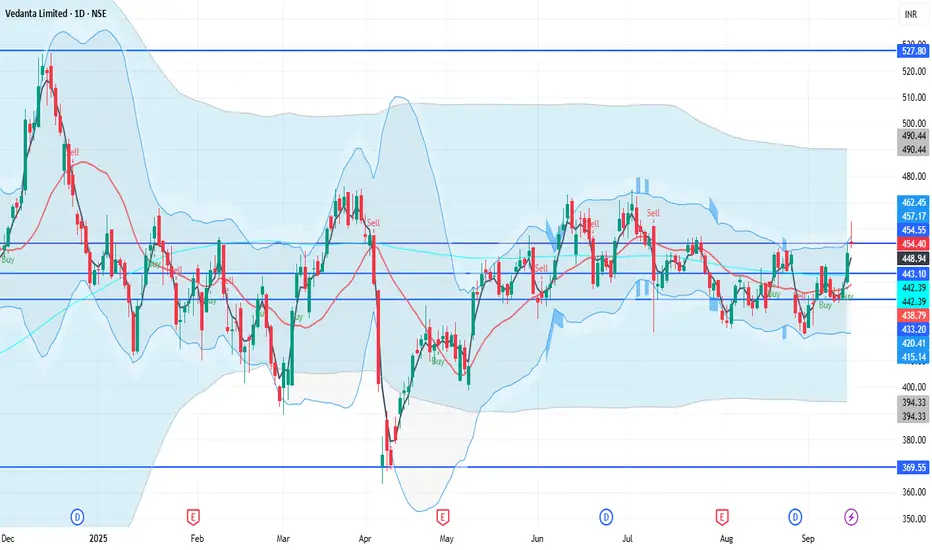
VEDL 1D Time frameCurrent Price
₹454.20
🔹 Market Snapshot
Day’s Range: ₹454.15 – ₹462.80
Previous Close: ₹450.90
52-Week Range: ₹363.00 – ₹526.95
Market Cap: ₹1.80 lakh crore
P/E Ratio (TTM): 12.37
P/B Ratio: 4.81
Dividend Yield: 9.44%
Book Value per Share: ₹95.87
EPS (TTM): ₹37.25
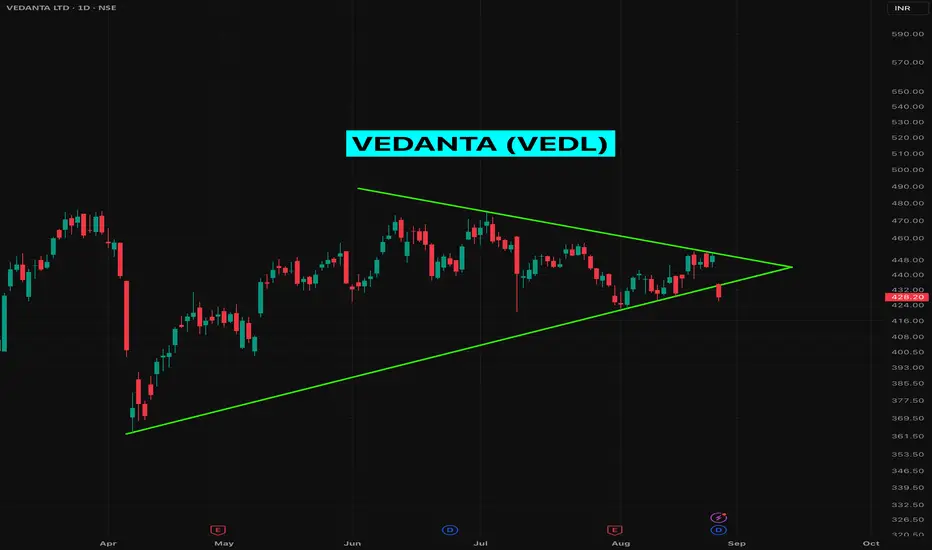
VEDL Bearish Triangle Breakdown!Vedanta (VEDL) is breaking down from a symmetrical triangle pattern on the daily chart, signaling potential downside momentum.
I secured my short position in VEDL before the closing bell today.
Amid bearish technicals, fundamentals add pressure: Vedanta's deleveraging efforts face trust issues with the Indian government, which accuses its oil business of accounting lapses and opposes the proposed split into five units.
The Ministry of Petroleum objects over a legal tussle on $578M dues from Cairn Oil & Gas, withholding payments despite an ongoing appeal. Watch for further declines if support breaks—targeting lower levels. Risk management advised.
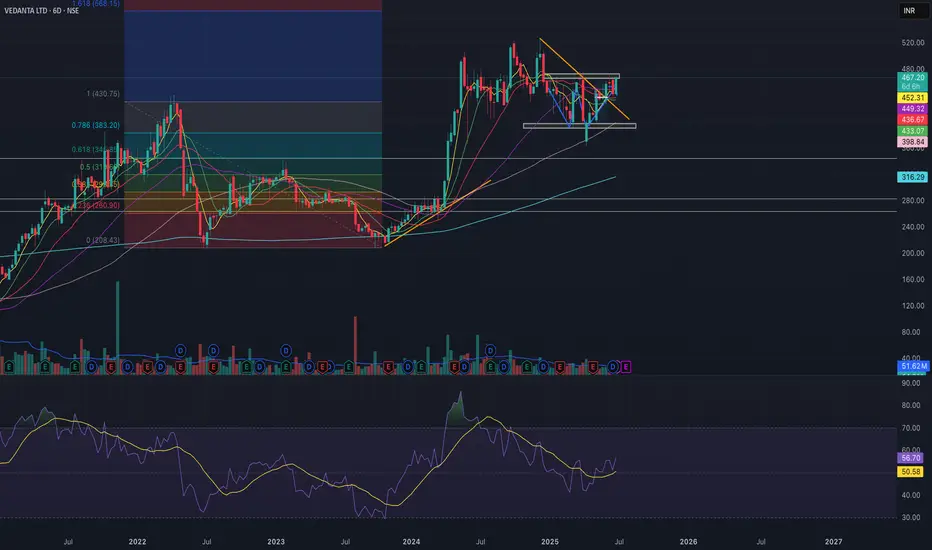
More room on the upsideVedanta CMP 447
Elliott - the next tgt from the mid point at 337 is giving a tgt of 549. That is a good 22% from the CMP.
Expansion and Contraction
Elliott - Here two swings are chosen that mark only the 50%. If the second swing is higher than the first one then the stock is expanding. If it is below then it is contracting and if it is very close or on top of each other it means its a symmetrical move, neither expanding nor contracting.
Since the second swing marked in blue is very near the first one its an indication that the stock will move up but not majorly.

VEDANTA Swing Trade with 1:3 RR (Long)Sellers failed to take price below the demand zone and a clear Change of Character (market structure shift) happened that shows buyers have taken control of the price of Vedanta.
So if Nifty and Metal sector are not bearish in coming sessions, then it is high probability that Vedanta will touch Rs 475.
Don't use hard SL. Manage position sizing as it is a high probability setup.
Connect with me if you have any questions. I am happy to help.
ChoCh - Change of Character
Sw or Sweep - Liquidity Sweep
BoS - Break of Structure

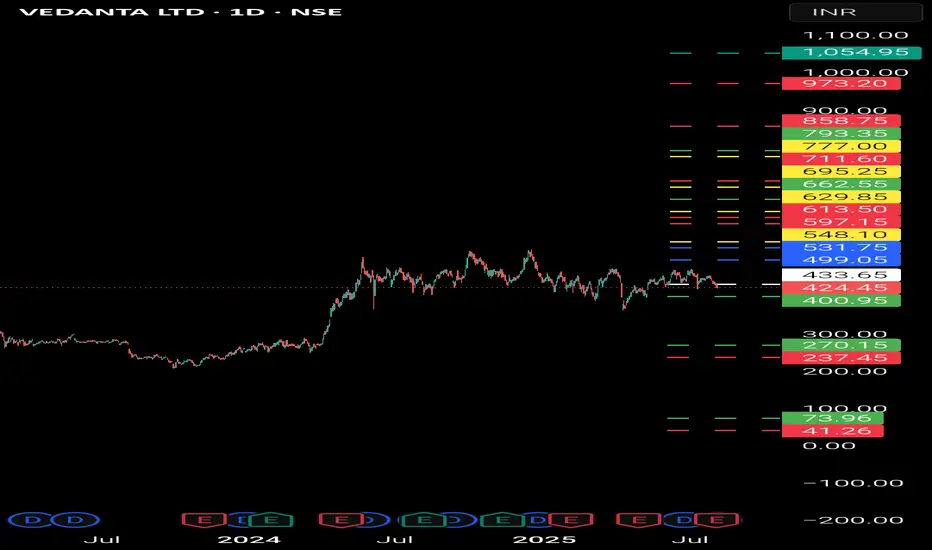
VEDL (Vedanta Ltd)- Analysis Bullish Levels -if sustain above 499 (early entry risky) then 531 to 548 safe entry if sustain above this for 2 weeks) target can be around 597 to 613 or 629 then 662 if sustain above for a week or two then we expect more upside and wait for targets around 695 to 711 then 777 to 793 then 858 then 973 then 1054 if sustains above for week or two then hold for long term 1700 to 1800
Bearish levels :- if sustain below 433 then 400 mild support swing trade exit below this if sustains for 2-3 days then 270 good support with SL of 236 if sustains below this for 2-5 days for long term investors below this more bearish. It seems to be better option to wait for the price to come around this level as risk will be small. And also around March 2024 it has shown a good movement from this price range. However, If it does not comes to this level then track the bullish levels.
**Consider some Points buffer in above levels
**Disclaimer -
I am not a SEBI registered analyst or advisor. I does not represent or endorse the accuracy or reliability of any information, conversation, or content. Stock trading is inherently risky and the users agree to assume complete and full responsibility for the outcomes of all trading decisions that they make, including but not limited to loss of capital. None of these communications should be construed as an offer to buy or sell securities, nor advice to do so. The users understands and acknowledges that there is a very high risk involved in trading securities. By using this information, the user agrees that use of this information is entirely at their own risk.
Thank you.
VEDL all set to touch 550W pattern in weekly TF.
Broken the W trendline.
RSI has turned positive with divergence.
Resistance at 470 levels.
CMP: 466, SL: 430, TGT : minimum 10%
VEDANTA: 30% Upside Potential!⚡️Price Analysis:
1️⃣ Price showing strength.
2️⃣ Price structure is bullish.
3️⃣ Overall Sector is strong.
4️⃣ Broke the ATH resistance level.
✨ Key Observations:
➡️ RRR favourable at CMP.
➡️ Price did retest of the trendline confirming strength.
➡️ Fast momentum should start post 500 level till than it might struggle to move fast.
⚠️ Disclaimer: This is NOT a buy/sell recommendation. This post is meant for learning purposes only. Views are personal. Please, do your due diligence before investing.⚠️

Vedanta: Bullish Momentum with Volume Surge — Breakout or Bull TVedanta Ltd is currently showing signs of bullish momentum backed by a strong volume spike. After consolidating in a tight range, the stock has managed to break out with a solid green candle, accompanied by above-average volume (10.48M vs. average 7.5M), indicating genuine buying interest.
Key Technical Observations:
• Support Levels: ₹430 and ₹433 (near the 50 & 200 EMA).
• Resistance Zone: ₹470–₹480 remains a key hurdle from earlier price rejection.
• Volume: Today’s breakout is supported by strong volume, strengthening the bullish case.
• Moving Averages: Price is now trading above both the 50 EMA and 200 EMA, which is a positive signal for trend continuation.
• RSI: Currently at 59.42 — showing strength but still below the overbought zone, giving room for further upside.
If this breakout sustains, we may see a move toward ₹470+ levels. A retest of the breakout zone (₹440–₹443) could offer a good risk-reward entry.
🔐 Risk Management is key — always place stop-loss below the support zone and size your position wisely.
⸻
Analysis By Mayur Jayant Takalikar --For LEARNING & OBSERVATIONAL USE ONLY.
⚠️ Disclaimer:
I am not a SEBI-registered advisor. This analysis is for educational and informational purposes only. Please do your own research or consult a qualified advisor before making any investment decisions.

VEDL ready to breakout for target of 500W patterns in wewkly.
resistance at 450.
RSI divergence in W timeframe with RSI above 50.
wait for breakout beyond 450 for atleast 10% upside.
#VEDL🧠 Technical Analysis (Weekly Timeframe):
Key Levels Marked:
Resistance: ₹506.45 (Marked in blue)
Support: ₹379.40 (Marked in teal)
🔍 Price Action Insight:
Major Resistance Zone – Around ₹506:
This level has been tested multiple times without a breakout.
Price faced strong rejection from this zone.
Psychological round figure as well.
Support Retest Successful – Around ₹379:
Price recently tested this support and gave a bullish reversal candle.
The long wick and green body indicate buying pressure at this level.
Current Price: ₹400.05
Trading near the middle of the support-resistance range.
Strong weekly bullish candle after a pullback.
+5.23% gain with healthy volume – signals potential continuation.
📊 Volume Analysis:
Last bullish candle formed with 28.47M volume, higher than previous few weeks.
Indicates institutional activity at support level.
🔔 What to Watch:
If price sustains above ₹400, next target could be ₹440–₹460.
Above ₹506 on weekly close = fresh breakout & possible upside continuation.
Breakdown below ₹379 = weak structure & potential fall to ₹340–₹320 zone.
🧾 Disclosure:
This is a technical analysis based on historical price behavior, not a stock recommendation.
Please consult a SEBI-registered advisor before making any investment decisions.
I do not hold any position in Vedanta Ltd at the time of this analysis.

Vedanta weak trend 450Vedanta weak trend 450
Market Cap: ₹1.82 trillion.
Dividend Yield: 9.31%.
Price-to-Earnings Ratio (P/E): 13.95
Operates in sectors like aluminum, copper, iron ore, power, and oil & gas
Recently acquired a nickel and cobalt plant, making it the sole producer of nickel in India

Vedanta LimitedVedanta Limited, a subsidiary of Vedanta Resources, operates as a diversified natural resource company with a business model that encompasses various sectors, including mining, oil and gas, and power generation. Here's an overview of its business model:
1. Diversified Operations:
o Mining: Vedanta Limited is involved in the extraction and processing of minerals such as iron ore, zinc, aluminum, and copper.
o Oil and Gas: The company has significant operations in the oil and gas sector, primarily through its acquisition of Cairn India.
o Power Generation: Vedanta operates commercial power stations in India, contributing to the country's energy needs.
2. Integrated Value Chain:
o Vedanta controls the entire value chain for its products, from extraction to processing and distribution. This integration helps in achieving operational efficiency and maintaining high-quality products.
3. Strategic Acquisitions:
o The company has made several strategic acquisitions to expand its operations and strengthen its position in the mining and energy sectors. Examples include the acquisition of Sesa Goa and Cairn India.
4. Geographical Presence:
o Vedanta has operations in India, Africa, Australia, and Zambia, providing access to significant natural resources and diverse markets.
5. Investment and Expansion:
o The company is investing heavily in new projects across various sectors, including aluminum, zinc, iron ore, steel, and oil and gas. This investment strategy aims to enhance its EBITDA and expand its revenue streams.
Strengths:
• Diversified Portfolio: Reduces dependence on a single commodity or market.
• Strong Operational Track Record: Consistent performance across key business segments.
• Significant Natural Resources: Access to large reserves in Africa and India.
Challenges and Opportunities:
• Market Volatility: Fluctuations in commodity prices can impact profitability.
• Environmental and Social Governance (ESG): The company is committed to improving its ESG performance, which is crucial for long-term sustainability.
• Expansion into New Sectors: Vedanta has explored opportunities in technology, such as semiconductor manufacturing, though some ventures have been discontinued.
Overall, Vedanta Limited's business model is designed to leverage its diversified operations, strategic acquisitions, and strong operational capabilities to drive growth and profitability in the natural resources sector.

Vedanta swing tradeSL day candle close only, Target Trigger Price
All detail for chat. good entry at mark price only. and must stoploss minimum risk and good profit. risk ratio 1:1 to manage modified SL. This is not call, Just my idea. Please understand your risk and take full responsibility of your actions

VEDL VEDANTA LTD is a potential short candidateBearish Signs Supporting a Short Trade:
Multiple Tests of Support:
The stock is testing a key horizontal support level (around 410-415) multiple times, as indicated by the blue arrows.
A decisive break below this level with increased volume would confirm a shorting opportunity.
Moving Averages Bearish Cross:
The stock is trading below key moving averages (red, green, and purple lines), indicating weakness.
The shorter-term moving averages (e.g., 50-day and 150-day) appear to be sloping downward
Failure of Past Rally Attempts:
There have been multiple failed attempts to bounce back, which suggests distribution rather than accumulation.
stocks will struggle to rally above key resistance levels (e.g., moving averages).
High-Volume Breakdown Potential:
Volume spikes on red candles indicate institutional selling, which is a key characteristic of a stock ready to decline.
Risk Factors to Watch Before Shorting :
Support Not Broken Yet:
The stock is still holding support. waiting for a confirmed breakdown (ideally on high volume) before initiating a short position.
If the stock bounces again, shorting prematurely could lead to a short squeeze.
Market Conditions:
In my advise shorting in weak overall market conditions. If the general market is bullish, shorting individual stocks carries higher risk.
Bearish Pattern Confirmation:
If a clear topping pattern, such as a head and shoulders breakdown, forms with a strong move below support, the short setup will be more reliable.

This stock will lead the metal packVEDL CMP 455.80
Fibs- the correction halted at 38.2%, that it has come from a higher swing is tremendous strength. Once the highs are broken one should see 594 on this.

Vedanta SL day candle close only, Target Trigger Price
All detail for chat. good entry at mark price only. and must stoploss minimum risk and good profit. risk ratio 1:1 to manage modified SL. This is not call, Just my idea. Please understand your risk and take full responsibility of your actions

view on vedanta ltdVedanta Ltd
Current price: 444 as on 1/02/2025
Stock has taken support at 416 in daily time frame, if it crosses 456, we may upside move to 476-500. However, if stock fails to cross these levels, bearish target would be 410-390

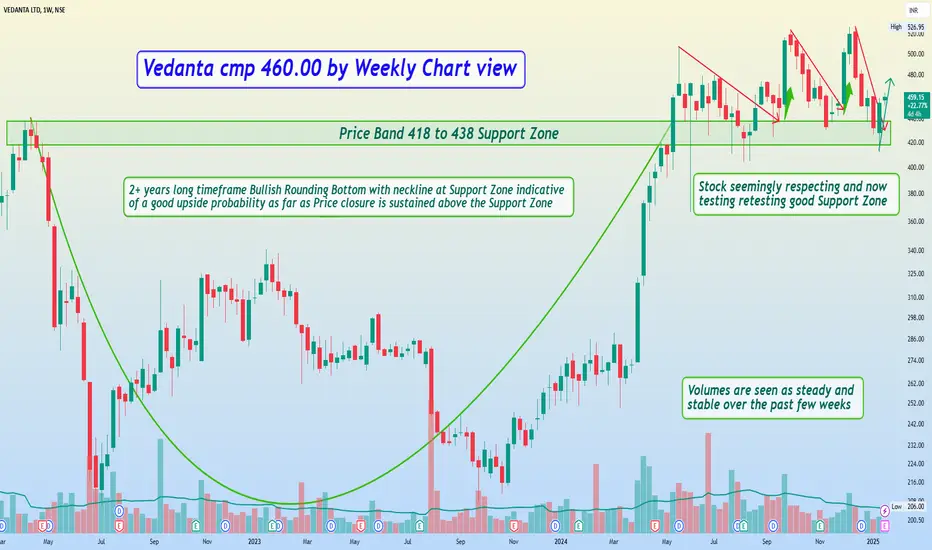
Vedanta cmp 460.00 by Weekly Chart viewVedanta cmp 460.00 by Weekly Chart view
- Price Band 418 to 438 Support Zone
- Volumes are seen as steady and stable over the past few weeks
- Stock seemingly respecting and now testing retesting good Support Zone
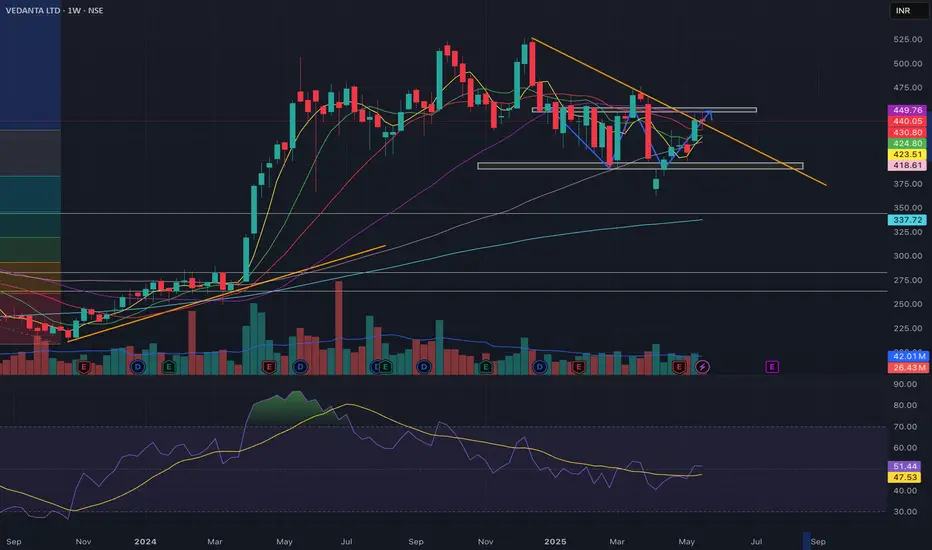
Vedanta cmp 449.75 by Weekly Chart viewVedanta cmp 449.75 by Weekly Chart view
- Price Band 418 to 436 Support Zone
- Next Support Zone 321 to 331 at Price Band
- Volumes are seen as steady and stable over the past few weeks
- Stock seemingly respecting and testing retesting good Support Zone 420 to 440
- 2+ years long timeframe Bullish Rounding Bottom with neckline at Support Zone
- Technical setup indicative of good upside probability until Price closure sustains above Support Zone

Long Side View on VEDANTA Vedanta on a weekly timeframe is in a Parallel Channel.
The stock can be bought positionally at CMP or any dip upto 440 with Stop Loss of 420 on weekly closing basis for Target of 560.
Disclaimer: All information give is for educational purposes. Please consult your financial advisor before investing.
If you like such content please subscribe and share it with your Trader Friends or Family Members.
For more such content. Stay Tuned.

More correction on the wayVEDL CMP 477
Gaps- Use gaps with all ur tools they are an imp marker on the chart. the stock made an attempt but could not close the gap.
Fibs- Hence the start from the Gap and the end at imp swing lows. Hence the most imp support right now is 455 and below that to the swing low at 429.
Conclusion - in my view the stock will rush to these two zones.

Vedanta Ltd view for Intraday 20th Dec #VEDL
Vedanta Ltd view for Intraday 20th Dec #VEDL
Resistance 523-524 Watching above 525 for upside movement...
Support area 505 Below 518 ignoring upside momentum for intraday
Support 505 Watching below 505 or downside movement...
Resistance area 523-524
Above 510 ignoring downside move for intraday
Charts for Educational purposes only.
Please follow strict stop loss and risk reward if you follow the level.
Thanks,
