vedanta shows distributionon hourly chart vedant shows divergence .
1.RSI in negative territory.
2. MACD going downward
3. symmetrical triangle pattern.
although market is bullish but hence not try to short.
VEDL trade ideas

#VEDL Swing Trade || #RathrolaTradesThis is only for educational purpose, don't consider this as Recommendation, am not responsible for your losses/Gains.
Reasons to Trade:
a) Price is near Resistance level
b) After a long uptrend, expecting some retracement untill down the support line drawn
#powerofpriceaction #rathrolaTrades #tradingviewindia
Regardd,
Rathrola


[Basket] VEDL Short Term BetYou can not short 100PE and play it because the risk to reward is too bad. VEDL 100PE is trading at 1.4
You can not buy call options because metal cycles will not give breakout till US presidency selection is normalized.
The stop loss will be deep in the case of futures buy.
Buy stocks! :)

vedlAll level mentioned on chart.
Watch my other charts to understand simple price action used for all of the analysis. Keep your charts simple and free from lagging indicators. If you check all previous charts, you will understand how beautiful price action trading is and how one can become independent trader by following some simple rules.
Reach out if you wish to learn powerful technical analysis based on simple price action.
Thanks

VEDL, LETS MAKE MONEY FROM THIS MINNING COMP (CHART# 396)All level mentioned on chart
Watch my other charts to understand simple price action used for all of the analysis. Keep your charts simple and free from lagging indicators. Reach out if you wish to learn powerful technical analysis based on simple price action.
Thanks
Piyush Gupta


VEDL - Cup and HandleNSE:VEDL cup and handle. also a good entry above previous intermittent high of 142.

VEDANTA - OBSERVE THE PRICE MOVEMENTIT IS OBSERVED THAT THE PRICE IS GETTING GOOD SUPPORT OF THE SHORT TERM AVG.

VEDL recovering from a short term backsetVedanta had shown a breakdown when the company failed to de-list. Since then, there has been an unbelievable rise in the stock's price. So much so that has almost recovered from the breakdown.
Great stock to hold for a slightly longer term.
Go long in VEDL.
Please like and follow.
NSE:VEDL


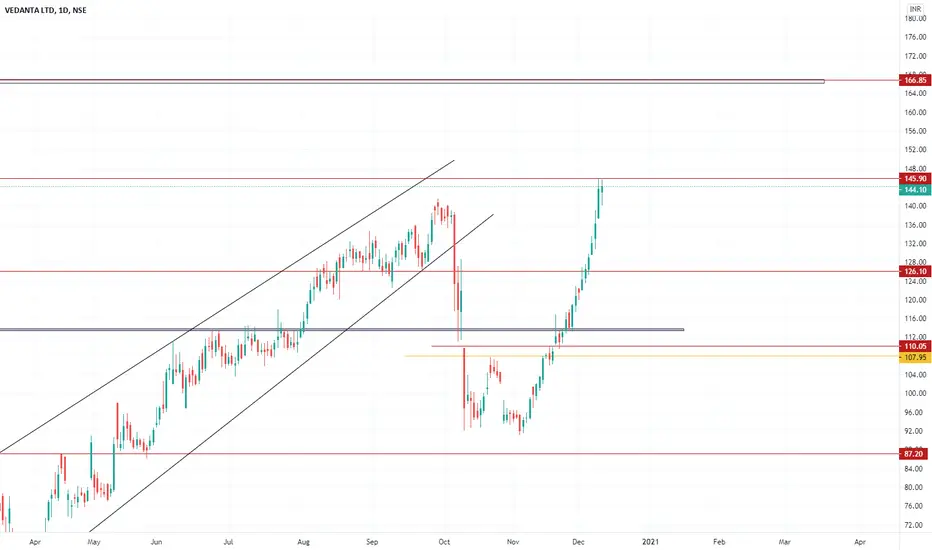
VEDL: Neckline of Double BottomBuy above 108 for 109.5, 112; SL as per your lot size and Risk appetite

Double bottomBroke out from the double bottom pattern. May retest the 200 SMA.
Buy @ 109 - 108
Target: 123
SL: 107 (200 SMA)


Double bottom in VedantaClear indication that correction is over and it is heading for
next up move.

Vedl postional trade on monthly time frameSimple Price Action with Support and Resistance and Counter Trendline breakout will give 100%+ returns on Monthly time frame

Short VEDLVEDL has given two candle stick patterns at the top of an uptrend indicating shorting opportunity. Stock was in an uptrend and got rejection from 200 days EMA on 19th Nov and formed a shooting star candle. The next candle was a bearish dark cloud cover candle. These two are indicating short for VEDL.
Short VEDL @ CMP (Safe traders can wait for Monday's candle to be bearish and take entry at EOD)
Target: 92 (Immediate support)
SL: 116.85 (High of shooting star candle)
Please share your views on this


#VEDL CASH : LOOKS GOOD ABOVE 110.10#VEDL CASH -POSITIONAL CALL
19.11.2020
LOOKS GOOD ABOVE 110.10
STOPLOSS 103
TARGET 117/125
CMP 108.90
