VEDL trade ideas


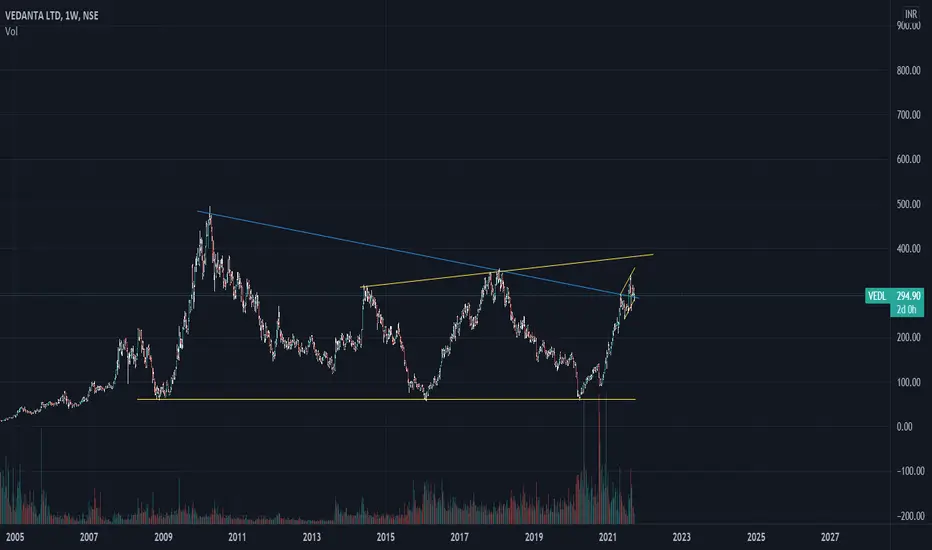
buy opportuniy1.fag pattern break in upper side then buy
2.entry when near 275 price because high support level
3.take position and enjoy profit

VEDANTA : Stock To Buy For Swing TradingIf vedanta gives breakout and price siustained above 295 then it will be a good stock to long for swing trading.


Metals look to bounce back ! Vedanta in spotlightWith DXY coming down ...metals will again look to shine ...Go long on Vedanta for a target of 310 ...stop at 293.


VEDANTA (VEDL) Stock AnalysisThe stock price is at major RESISTANCE and it is tested many times. It is also trying to the making of DOUBLE TOP PATTERN. If there is any reversal candle then short trade can be initiated and we can confirm the double top pattern. But for going long you should wait for the closing of 15 min candle with good volumes.
HOW DOUBLE TOP PATTERN WORKS
A double top is an extremely bearish technical reversal pattern that forms after an asset reaches a high price two consecutive times with a moderate decline between the two highs. It is confirmed once the asset's price falls below a support level equal to the low between the two prior highs.
KEY POINTS
1. A double top is a bearish technical reversal pattern.
2. It is not as easy to spot as one would think because there needs to be a confirmation with a break below support

vedl bullishvedl will remain bullish till the three white soldiers' first candle low does not break and maybe it consolidate at this point because of the good rally. but remains bullish


Buy Vedl 315 CE once CMP crosses today high 312Buy Vedl 315 CE once CMP crosses today high 312
SL : Today low i.e 309
Target : 330


VEDANTA: BEARISH A steep fall which can be counted as 12345 impulse , suggests that vedanta stock is taking a correction in the form of a ZIGZAG pattern. The current rise looks like a corrective sequence of short term bearish trend which will complete this zigzag correction. One should look for short opportunity near 310 zone. keeping sl of 328 & target for the region of 260 /240 .

Double Bottom Formation on VedantaVendata Formed Double bottom pattern on monthly time frame. Can be good for long position

Long call for VEDLVEDL is making a strong pattern as shown.Might expect a long call to achieve the target for 7 to 10 days.

Possible bounce at the trendlineAdded small qty. Will add more at the support.
The bullish signal bar is yet to appear.

Breakout in Vedanta limited very soonLow risk, high reward trade in Vdedanta. This is Darvis trading stretegy. If the price comes out of this box, it usually means a sure breakout. The risks are minimum. Also put a stop loss according to your convenient.

VEDL - Triangle Pattern- LongHi Friends,
Right now we are going to analysis the script VEDL
Script was in the Long Trend.
Script was touched the Area of Value with confluence to EMA50 & EMA79 which acts as dynamic Support and Horizonal Support 260.
Stochastic RSI in Daily, 2hr and Weekly was in the oversold region .
MACD was also in the Oversold area
Volatility was in the peak at ATR.
Trend was in the uptrend and Descending triangle pattern was formed which was braked and retested now.
CPR : Script was in the range of CPR . CPR was Bullish Bias.
Based on the above:
We are Bullish on VEDL.
Buy: Tomorrow Open Price
Target - Previous Swing High & Trail your SL further.
SL: 276 - 1ATR
EMA50 and EMA79: Dynamic Support
Stochastic RSI
MACD:
ATR:
CPR:
Triangle Pattern:

#VEDL: Swing Trading With Positive Divergence StrategyOn the hourly time-frame chart we can observe the positive divergence against the prices.
As the candles have broken out from the trend line it was a good entry confirmation.
Stop-loss will be the low of the swing.
First target level will be 291 levels.


For Swing TradeVedanta for selling. Shares has fallen and good for short it for swing if closing candle below horizontal line.
