Triangle Breakout!!TRADING PSYCHOLOGY : The stock forms a triangle pattern when the tug of war between BULLS and BEARS is at the end stage where one is bound to give up.
AC line will act as resistance line.
BD line will act as support line.
when to trade : The candlestick has to break the support/resistance line with increasing volume to confirm the direction.
STOP LOSS: If the breakout is upwards then support line will act as stop loss.
If the breakout is downwards then resistance will act as stop loss.
PS : This is 15 minute candlestick chart so the targets are most likely to achieve in 1-2 days.
The accuracy of this strategy is 80%.
VEDL trade ideas

vedl good to short below 104if open below 104 and hold their
vedl going down ,
1st target 101.85 and target 96.95
stop loss 111.1
Disclaimer: All posts/views are for educational purpose only..!!
Kindly contact financial adviser before taking position/decision.


VEDANTA Trade SetupThis Analysis Is Done Only For Educational & Intelligence Purpose, Invest Or Trade At your Own Risk & Will.


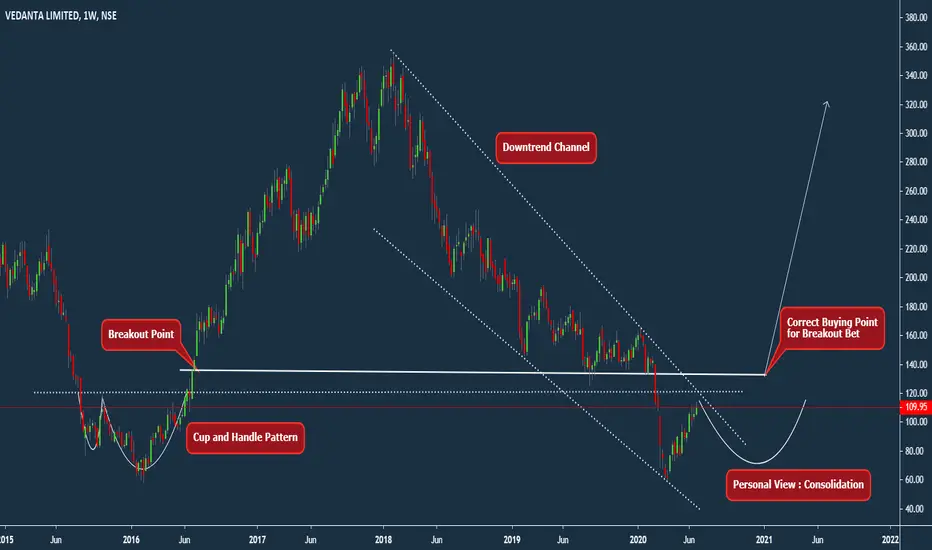
VEDL : A proper gainer_ Vedl is in the consolidation mode right now
_ You can clearly see consolidation happening if you check the 15 min time frame
_ If it breaks up, that'll be a clear shot bullish trend
_ Let's hope that it'll be a bullish breakout

VEDL - Bearish Cloud CoverNote: This is for educational purpose only.
The price of VEDL is moving in a channel but there is a bearish cloud cover formation in VEDL which indicates there is a bearish sentiment. Expecting price to touch the lower part of the channel. Based on the price action when price reaches at the lower part of the channel, further trend can be determined.

VEDL SHortIf it close below 100 then we can see to 96.5
To go long it must close above 104
Plan your trade according to your risk(View educational purpose).


Vedanta - sell at upper levelSell > 110
tg 103
daily clbs sl 112.6
buy If you get at lower levels
Buy < 98 upto 94
tg 116

Vedanta 08/06 Trade Setup Disclaimer: All charts are purely for educational and information purpose only. Invest or Trade at your own risk.
This Chart idea is on Basis of Volume Breakout that doesn't mean the stock price can go up but yes has high probability to do so..
Intraday Players Can also take position using trailing SL


VEDANTA LIMITEDBuy VEDL above Rs. 106 for the Target of Rs. 130 - 160
Stoploss Rs. 85 .....
Follow.....
Comment your views.......

Buy with stoploss 97.30 target 125.30 and 133Monthly -
1- It is downward channel.
2- Higher High and lower low in last 3 month
3- RSI cmp from over sold territory
Weekly :
1- Macd and RSI are positive
2- Made big candle after 2 week consolidation
3- VEDL has strong weekly resistance Near 125.30
Daily :
1- RSI above 70 Little bit overbougth
2- Volume in upward cruve
3- Crossed Important Resistance (97.90)
4- From last four days making higher High and Higher Low
5- Macd is not inc arsing but positive
6 Today crossed 100 DEMA with almost double volume
7- 125 is reistance weekly-200 MA and channel as well
:
Plan buy in deep with stoploss of 97.90 closing base and exit Near 120-125 try to buy some put Near 125-130
Pattern :
Ascending tryangle breakout occured Breakout height is 35 rs/-
Approx Target is : Near 130

VEDANTA Trade SetupThis Analysis Is Done Only For Educational & Intelligence Purpose, Invest Or Trade At your Own Risk & Will.

Vedanta - Gravestone Doji may pause its uptrend from here.NSE:VEDL has witnessed a gravestone doji formation at the supply zone.
Looks like NSE:CNXMETAL may pause its rally from here.
