Venus Pipes: A Breakout Story in the MakingNSE:VENUSPIPES : A Breakout Story in the Making
Price Action Analysis:
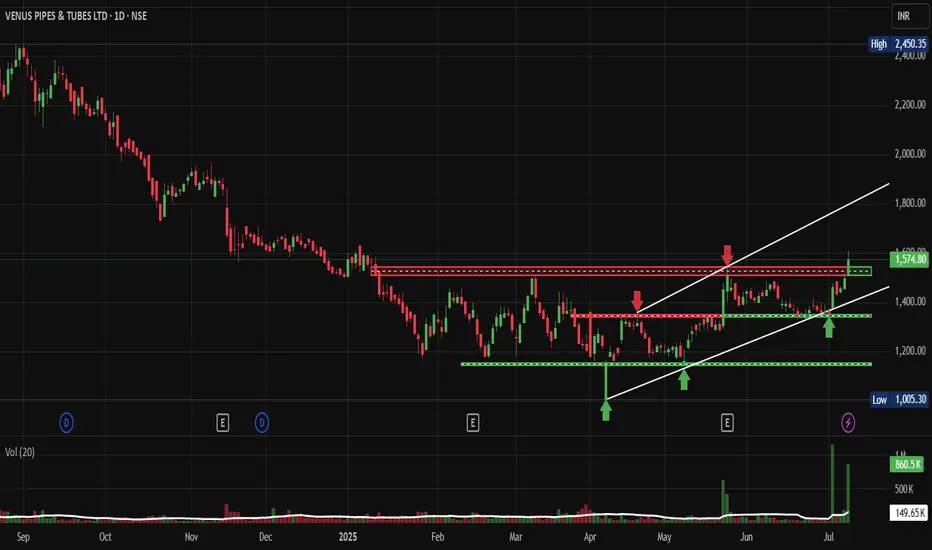
• Price consolidated between 1,200-1,600 levels from January 2025 to June 2025
• Recent breakout above 1,600 resistance with strong volume confirmation
• Currently trading at 1,574.80 after hitting a high of 2,450.35
• Pullback to retest the breakout level suggests healthy consolidation
Volume Spread Analysis:
• Significant volume spike during the recent breakout phase
• Volume increased from an average of 149.65K to 860.5K, indicating institutional interest
• Higher volume during up moves compared to down moves shows buying pressure
• Volume pattern supports the breakout thesis with strong participation
Key Technical Levels:
Support Levels:
• Primary Support: 1,200 (previous base level)
• Secondary Support: 1,400 (mid-range support)
• Immediate Support: 1,500 (recent pullback low)
Resistance Levels:
• Immediate Resistance: 1,650 (recent high)
• Major Resistance: 2,450 (lifetime high)
• Psychological Resistance: 2,000 and 2,500
Base Formation:
• Strong base formed between 1,200-1,400 levels over 6 months
• Multiple retests of support levels showing accumulation
• Base provides a strong foundation for upward movement
Technical Patterns:
Primary Pattern:
• Bullish continuation pattern with horizontal resistance at 1,600 and rising support line
• Pattern duration: 8 months (Jan 2025 to July 2025)
• Breakout confirmed with volume expansion
Secondary Patterns:
• Higher low pattern indicating underlying strength
• Volume-price divergence resolved with a recent breakout
Trade Setup:
Entry Strategy:
• Conservative Entry: On pullback to 1,500-1,520 levels
• Aggressive Entry: Current levels around 1,570-1,580
• Breakout Entry: Above 1,650 with volume confirmation
Exit Strategy:
• Target 1: 1,800 (immediate target)
• Target 2: 2,100 (50% retracement of lifetime high)
• Target 3: 2,400-2,500 (lifetime high retest)
Stop-Loss Levels:
• For entries around 1,570: Stop at 1,450 (below base support)
• For entries around 1,500: Stop at 1,350 (below key support)
• Trailing stop: 8-10% below recent swing highs
Risk Management:
Position Sizing:
• Risk per trade: Maximum 2% of portfolio
• Position size calculation: Portfolio value × 2% ÷ (Entry price - Stop loss)
• Gradual position building is recommended, given the volatility
Risk Assessment:
• Risk-Reward Ratio: 1:2 to 1:3 for current setup
• Time horizon: 3-6 months for primary targets
• Market correlation: Monitor broader market sentiment
Sectoral Backdrop:
Steel Pipes and Tubes Industry:
• Infrastructure spending boost under government initiatives
• Demand from the oil and gas sector supports growth
• Housing sector recovery driving construction demand
• Water supply projects creating additional opportunities
Industry Trends:
• Consolidation phase in the sector, favouring established players
• Raw material cost pressures being managed through pricing power
• Export opportunities emerging in neighbouring markets
• Technology upgrades improving operational efficiency
Fundamental Backdrop:
Company Overview:
• Venus Pipes & Tubes is a leading manufacturer of steel pipes and tubes
• Established presence in water supply, structural, and industrial applications
• Strong distribution network across India
• Focus on quality and customer service
Recent Developments:
• Capacity expansion plans to meet growing demand
• Strategic partnerships with infrastructure companies
• Improved working capital management
• Strong order book visibility for coming quarters
Financial Health:
• Steady revenue growth trajectory
• Improving margin profile
• Healthy balance sheet with manageable debt levels
• Strong cash flow generation capabilities
My Take:
Short-term View (1-3 months):
• Consolidation expected around current levels
• Potential for retest of breakout levels
• Volume patterns to be monitored for direction
Medium-term View (3-6 months):
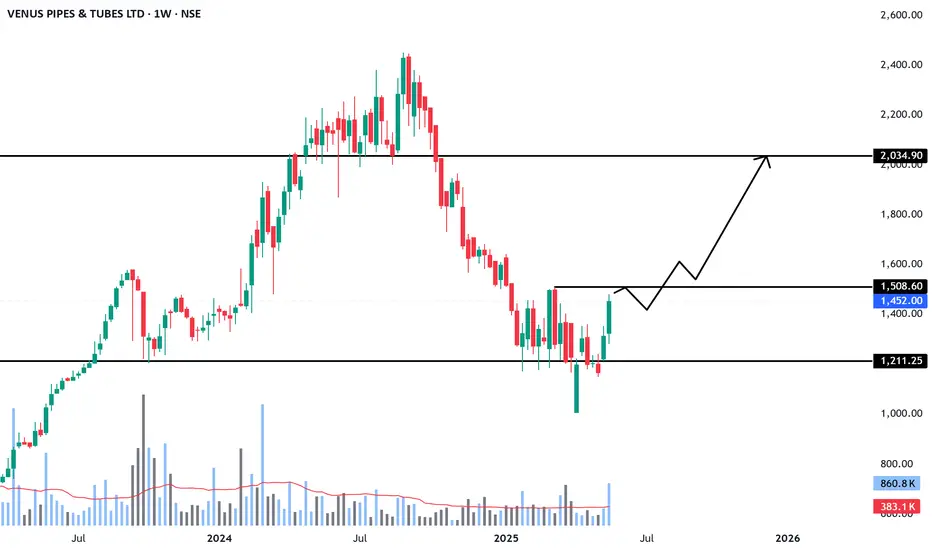
• Upside potential to 2,000-2,200 levels
• Sector rotation could benefit the stock
• Infrastructure spending cycle supporting fundamentals
Long-term View (6-12 months):
• Structural growth story intact
• Market leadership position strengthening
• Potential for significant value creation
Keep in the Watchlist.
NO RECO. For Buy/Sell.
📌Thank you for exploring my idea! I hope you found it valuable.
🙏FOLLOW for more
👍BOOST if you found it useful.
✍️COMMENT below with your views.
Meanwhile, check out my other stock ideas on the right side until this trade is activated. I would love your feedback.
Disclaimer: "I am not a SEBI REGISTERED RESEARCH ANALYST AND INVESTMENT ADVISER."
This analysis is intended solely for informational and educational purposes and should not be interpreted as financial advice. It is advisable to consult a qualified financial advisor or conduct thorough research before making investment decisions.
Venus Pipes & Tubes Ltd.
No trades
Trade ideas
VENUSPIPES Good to Study for longNSE:VENUSPIPES
Good to keep on the radar
Always respect SL & position sizing
========================
Trade Secrets By Pratik
========================
Disclaimer
NOT SEBI REGISTERED
This is our personal view and this analysis
is only for educational purposes
Please consult your advisor before
investing or trading
You are solely responsible for any decisions you take on the basis of our research.
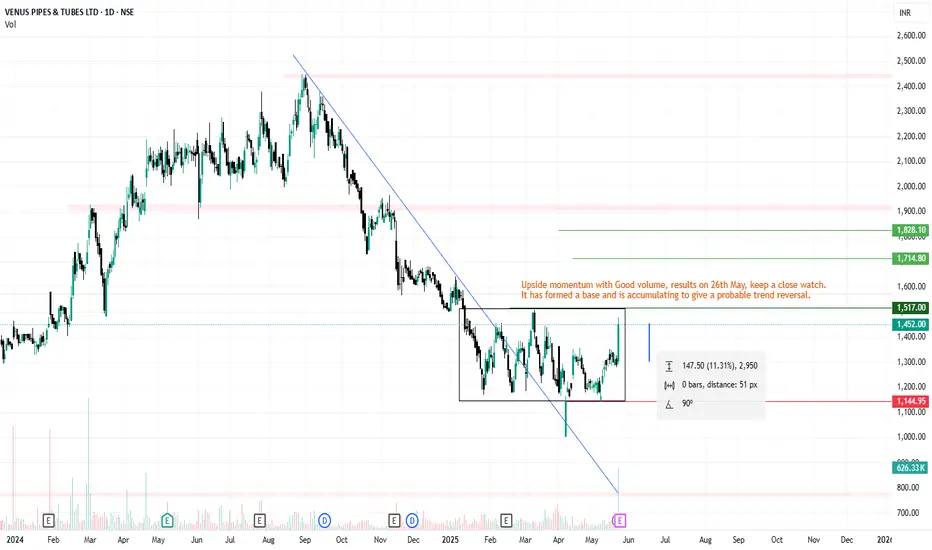
Venus Pipes Explodes 12% Breaking Out of 6-Month BaseNSE:VENUSPIPES Explodes 12%: Breaking Out of 6-Month Base Could Target ₹1,600 as it made a Beautiful Chart Structure Just Before Q4 FY25 Results.
Price Action Analysis
NSE:VENUSPIPES is experiencing a significant breakout moment, currently trading at ₹1,452.00 with an impressive 12.37% gain (₹159.80). The stock has decisively broken above a critical resistance zone around ₹1,400-1,420 after consolidating in a well-defined base for nearly six months. This breakout comes with strong momentum and represents a potential shift from accumulation to the markup phase.
Volume Analysis:
Volume is exceptionally strong at 626.33K shares compared to the average of 85.02K - nearly 7.5x times normal volume. This massive surge in participation validates the breakout and suggests institutional buying interest. The volume spike coinciding with the price breakout is a textbook confirmation signal that significantly increases the probability of continuation.
Key Support & Resistance Levels:
- Newly Broken Resistance: ₹1,400-1,420 zone (now potential support)
- Next Major Resistance: ₹1,500-1,520 (psychological level and previous resistance)
- Ultimate Target Resistance: ₹1,900-1,950 (red horizontal line - major resistance from earlier highs)
- Strong Base Support: ₹1,100-1,150 zone (multiple green arrows showing successful tests)
- Immediate Support: ₹1,380-1,400 (previous resistance becomes support)
Technical Patterns:
1. Rectangle Breakout: Clean break above the 6-month consolidation range (₹1,100-1,420)
2. Multiple Bottom Formation: Several tests of the ₹1,100-1,150 support zone (marked with green arrows)
3. Ascending Triangle: Recent price action shows higher lows approaching the ₹1,420 resistance
4. Volume Breakout Pattern: Classic high-volume breakout from a prolonged base
Trade Setup - Breakout Continuation
Primary Entry Strategy:
- Entry Point: ₹1,440-1,460 (current levels or minor pullback)
- Aggressive Entry: ₹1,420-1,430 (on any retest of breakout level)
Target Levels:
- First Target: ₹1,520-1,540 (psychological resistance and measured move)
- Second Target: ₹1,650-1,680 (extension target based on base width)
- Ultimate Target: ₹1,800-1,850 (major resistance zone approach)
Risk Management:
- Stop Loss: ₹1,350 (below the breakout zone and recent support)
- Tight Stop: ₹1,390 for short-term traders
- Position Size: Maximum 2-3% of portfolio at risk
Alternative Setup - Conservative Approach
For risk-averse traders:
- Entry: ₹1,480-1,500 (after clearing first resistance convincingly)
- Stop Loss: ₹1,420 (below confirmed breakout level)
- Targets: ₹1,600, ₹1,750
Pattern Analysis:
The stock has formed a solid 6-month base between ₹1,100-1,420, allowing for significant accumulation. The multiple tests of support around ₹1,100-1,150 (green arrows) demonstrate strong buying interest at lower levels. The recent ascending triangle formation within the larger rectangle pattern suggests building momentum that has now been released.
Risk-Reward Assessment:
- Primary Setup R:R: 1:2.8 (Entry ₹1,450, Stop ₹1,350, Target ₹1,730)
- Breakout Target: Rectangle pattern suggests potential for 25-30% move
- Failure Risk: Breakdown below ₹1,380 would invalidate the bullish setup
Key Technical Factors:
The convergence of multiple bullish signals - rectangle breakout, volume confirmation, successful base building, and momentum surge - creates a high-probability setup. The stock has spent considerable time building this base, and the breakout with such strong volume suggests genuine institutional participation rather than retail speculation.
Trading Strategy:
Traders should look for any minor pullbacks to the ₹1,420-1,440 zone as ideal entry opportunities. The key is to ensure the breakout level holds as support. A sustained move above ₹1,500 would confirm the pattern and likely attract momentum buying, potentially accelerating the move toward the ₹1,650-1,700 zone.
Monitor for any evening star or shooting star patterns at resistance levels, which could signal temporary exhaustion and provide profit-taking opportunities.
Keep in the Watchlist.
NO RECO. For Buy/Sell.
📌Thank you for exploring my idea! I hope you found it valuable.
🙏FOLLOW for more
👍BOOST if you found it useful.
✍️COMMENT below with your views.
Meanwhile, check out my other stock ideas on the right side until this trade is activated. I would love your feedback.
Disclaimer: "I am not SEBI REGISTERED RESEARCH ANALYST AND INVESTMENT ADVISER."
This analysis is intended solely for informational and educational purposes and should not be interpreted as financial advice. It is advisable to consult a qualified financial advisor or conduct thorough research before making investment decisions.

VENUSPIPES Trend ReversalVENUSPIPES Trend Reversal. Accumulation happening and FIIs are interested because of a very good FY25. The company looks solid both technically and fundamentally. Long term investors can be interested as the stock is at a fair discount right now.
Venus Pipes, Squeezing tight 1920 targetVenus pipes forming triangle pattern, company is growing good and technically also seems good. Target 1920 from CMP.
🚨 DYOR
🚨 SL must it depends on your risk appetite

Venus Pipes Rectangular breakoutVenus Pipes weekly MaCD breakout. Daily chart RSI breakout. Very strong fundamental stock.

LONG VENUS PIPESOne can long Venus pipes with an SL of 1200. Please consider that I am not a SEBI Reg. Analyst. Do your own research before trading or investing.

Inside bar rises the bar Can go long above the high of the candle
safe traders can exit at the mentioned target
Stoploss can be little down at the previous swing low but its for high capital traders


Venus Pipes- v shape recovery and neckline breakout-v shape recovery and neckline breakout
-Also all time high breakout with strong candle
-Volume rising in lower time frame
-No sharp selling from resistance area

Ready to Break Symmetrical Triangle ?After a big rally consolidated the stock, and trying to give a breakout from the Bullish Symmetrical Triangle pattern. Possible upside movement expected from current levels 1400 with risk of 10% , 1280 .

Venuus pipe weekly Breakout retesting Second run is going to start in Venus pipe 😀 . Ascending triangle breakout on weekly chart. Long on this chart as whole sector is breaking out on same time.

VENUSPIPES
The stock has been in an uptrend since its listing.
In February 2024, the stock cleared its recent consolidation phase by clearing its previous all time high, along with Weekly MACD crossing above its Trigger line.
Past price behavior suggests that rally could be strong and quick.
Conservative target (decreasing FR sequence) is around 2800.
Bullish view remains intact as long as price is above 1580.

Venus Pipes Long PositionalDate : 02-03-2024
Buy Venus Pipes above 1925
Target of 2041, 2157, 2381, 2616, 2847
SL 1440
Strategy : SBO + RSI > 60 + EMA above 20 & 50
Duration few Weeks To Months
Please consult your financial advisor before investing
All research for educational purposes only.
Stock is ready to cross past barriers with good volumes

Bluesky Breakout with Volume.#VENUSPIPES
It is a manufacturer and exporter of stainless steel pipes and tubes.
Market Cap₹ 3,417 Cr.
ROCE 22.9%
InstHold 13.1%
Growth YOY :-
SALES 52%
PAT 106%
Bluesky Breakout with Volume.

Cup with handle Stock in uptrend
Creating life time high
Profit booking in stock
Mentioned Target in chart
No recommendation for buy and sell
1500 is good support for the stock

Short term to Long Term Investment Trade : Target 2500% Returns About Company:-
Venus Pipes & Tubes Limited is a manufacturer and exporter of stainless steel pipes and tubes. The company is manufacturing stainless steel tube products in two broad categories - seamless tubes/pipes and welded tubes/pipes under which five categories of products are manufactured namely, stainless steel high precision & heat exchanger tubes, stainless steel hydraulic & instrumentation tubes, stainless steel seamless pipes, stainless steel welded pipes and stainless steel box pipes.
Market Cap
₹ 1,605 Cr.
Current Price
₹ 782
High / Low
₹ 822 / 316
Stock P/E
41.3
Book Value
₹ 147
Dividend Yield
0.06 %
ROCE
36.3 %
ROE
37.6 %
Face Value
₹ 10.0
Debt
₹ 53.0 Cr.
EPS
₹ 20.5
PEG Ratio
Promoter holding
48.2 %
Intrinsic Value
₹
Pledged percentage
0.00 %
EVEBITDA
24.9
PROS
Company is expected to give good quarter
Company has a good return on equity (ROE) track record: 3 Years ROE 47.0%
CONS
Working capital days have increased from 94.1 days to 150 days
Stock is looking good on chart. Breakout already taken place and retest also done now for this sky only the limit. If anyone is going for just trading please follow given levels. For investor no need any stop loss just invest and forget. Company Business Model is futuristic and this is the main reason i am thinking for long term in it. I am seeing it minimun 25 times from here, in coming next decade.
If anyone like my work plesae like, and follow krne me kanjooshi mat karna.
Thankyou:))

Flagggg Pattern in $VENUSPIPESChart is showing everything, what it is not showing is Targets and SLs and other indicators. I am terrible with targets so find it yourself. Now let's talk about SLs, First at 6% and next 9%, now you can Accumulate at 6 and sell at 9 or Sell at 6 or Sell at 9, it's totally upto you. Other indicators are bullish. Volume is good. And 'I' think it's enough to trade in stocks. Enjoy.
Note - This is not a Financial Advice. Just a prediction done by me. So always do your own research before trading.

Venus Pipes - Capex StoryWith the stock nicely consolidating. THe co has done 3x capex along with backward integration.
The stock will have a triangle breakout above 1450 and a more confirmed one above 1480.
There will also be a new high breakout above 1590.
Long above 1480 & double up above 1590.
SL for the first trade below 1330 and next trade trailing the 50EMA.

Venus Pipes - Good result expectationWith capacity expansion..backward integration plus low base YOY on results..
The stock has all the ingredients to do well..
The setup too is saying its primed to breakout after a 3 month consolidation.. (Triangle breakout)
Long above 1415 with a double up above 1485.
Stoploss of the first trade at 1290 ideally but for shorter term traders either below 1330 or even below 1360 if your horizons are super short term.

Buy Venus Pipes & TubesBuy Venus Pipes & Tubes (NSE:VENUSPIPES)
Buy Range- 920 - 940
Target- 1000 - 1020
StopLoss- below 885
Potential Return- 8-10%
Approx trade duration 12 - 14 days

VenuspipeVenus pipe capacity expansion by from 12000 tonnes
To 36000 tonnes will be operational by end of fy23
Or fy24 Q1
And Ashish kacholia bought 4lakh quantity at 750₹
Looking good for long term or midium term
I think easily 1:2 Target achieve after Target book half money that you invest
