VIMTALABS: Probable pyramid entries
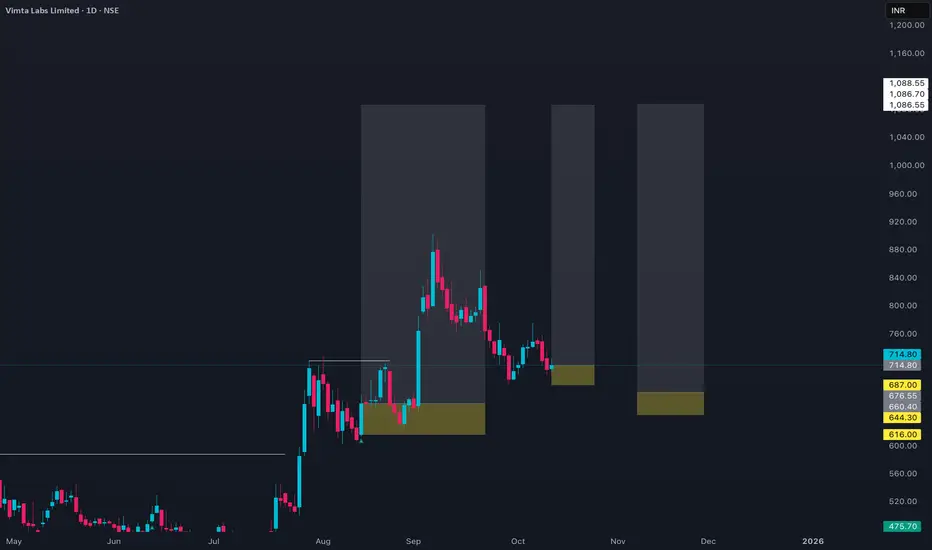
- Current Price: Around ₹715 as of early October 2025, with daily price fluctuations between approximately ₹700 and ₹723.
- 52-week Range: The stock has traded from a low near ₹270 to a high around ₹903, showing strong growth over the past year.
- Market Capitalization: About ₹3,180 Crores.
- Valuation: PE ratio stands near 45, indicating a moderately high valuation relative to earnings.
- Earnings: EPS is about ₹15.9.
- Moving Averages: The 50-day average price is roughly ₹719, and the 200-day average is near ₹545, indicating medium-term momentum in an uptrend.
- Dividend Yield: Very low at around 0.14%, consistent with growth-oriented companies.
- Volume: Recent trading volumes average about 60 lakh shares daily, indicating good liquidity.
- Price Trend: The stock has experienced some volatility but sustained gains overall, with occasional pullbacks and rebounds, reflecting investor confidence in the company’s niche testing and laboratory services sector.
- The stock price structure indicates a bullish phase supported by improving fundamentals and positive market sentiment.
Overall, Vimta Labs shows strong upward price momentum with a solid growth profile, trading at a premium that reflects optimism about its expanding testing services business.
Trade ideas
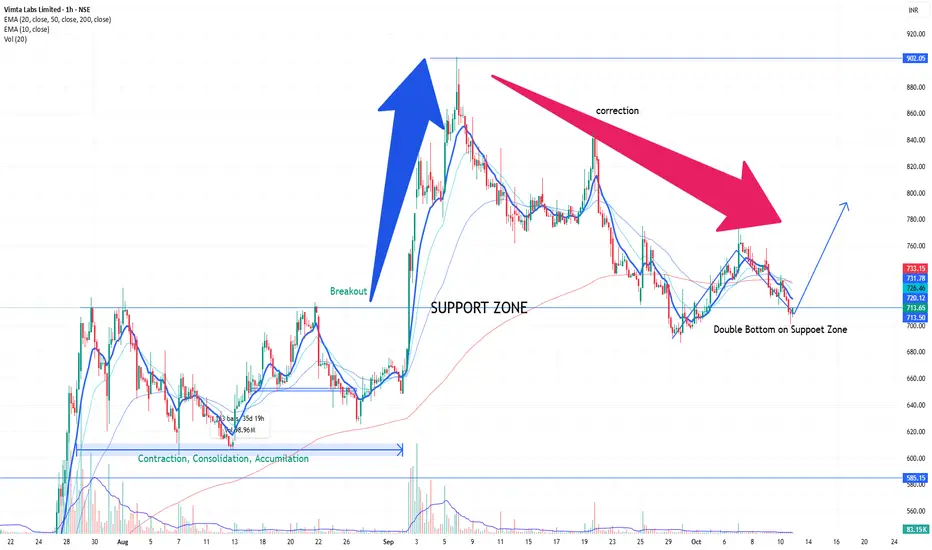
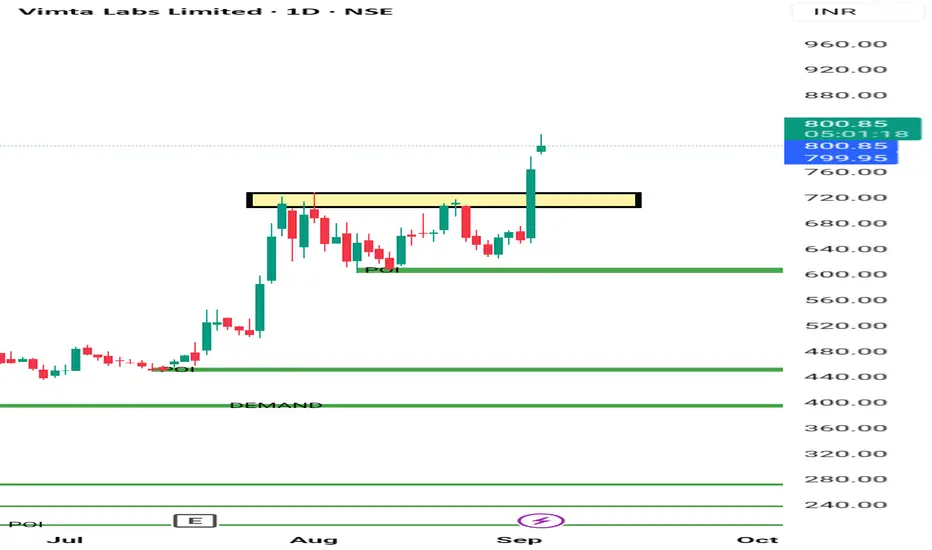
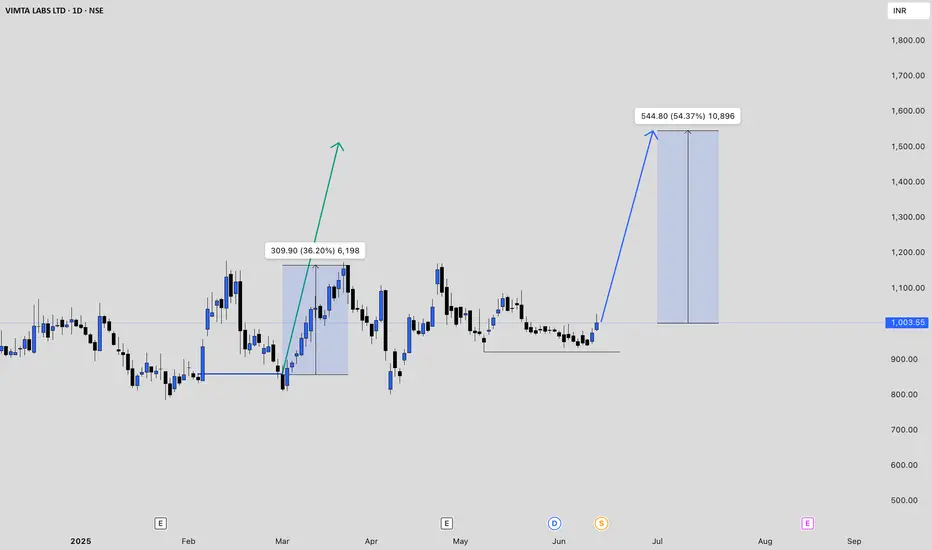
VIMTA LABS - SWING TRADE ACTIVATEDThe chart is pretty much self explainatory.
The script Brokeout and conslidated on 1h time frame.
Any close on 15 min time frame above 713 is buyable with 15 points as SL.
In some stocks you don't need to sweat out.
Such simple charts are the best charts to trade there is no noise.
Calculate your risk before any trade, I am not responsible for your WIN & LOSS.
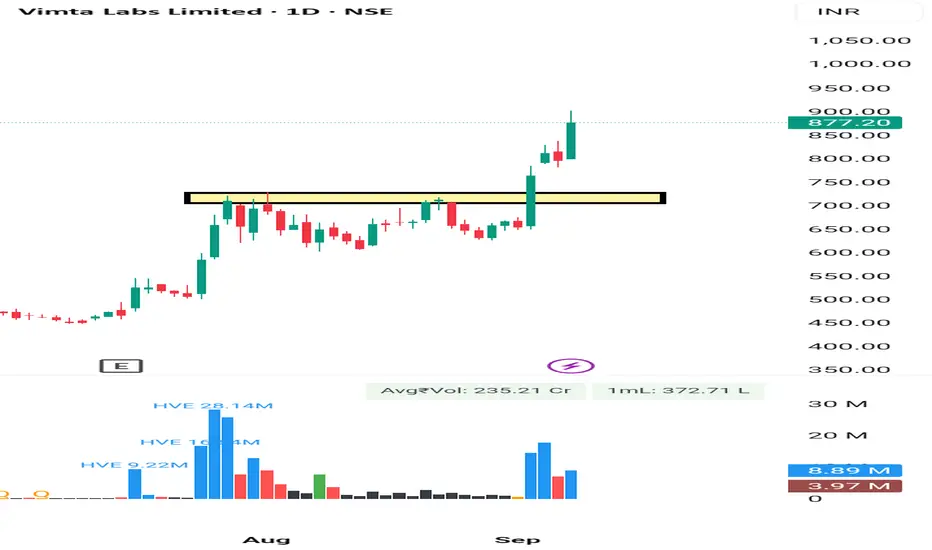
Vimta Lab Rounding Pattern Breakout Vimta Lab given Rounding Pattern Breakout on 1 Day as well as on 1 Week . It's a good movement after a good consolidation phase of 1 Month Approx . It may move 10 -15% Easily .
Entry Was Near 730
SL 5%
Tgt - Trial Basis . No body knows . Kitna Up jayega. So. Trail SL.
Consult your financial advisor before making any position in stock market.
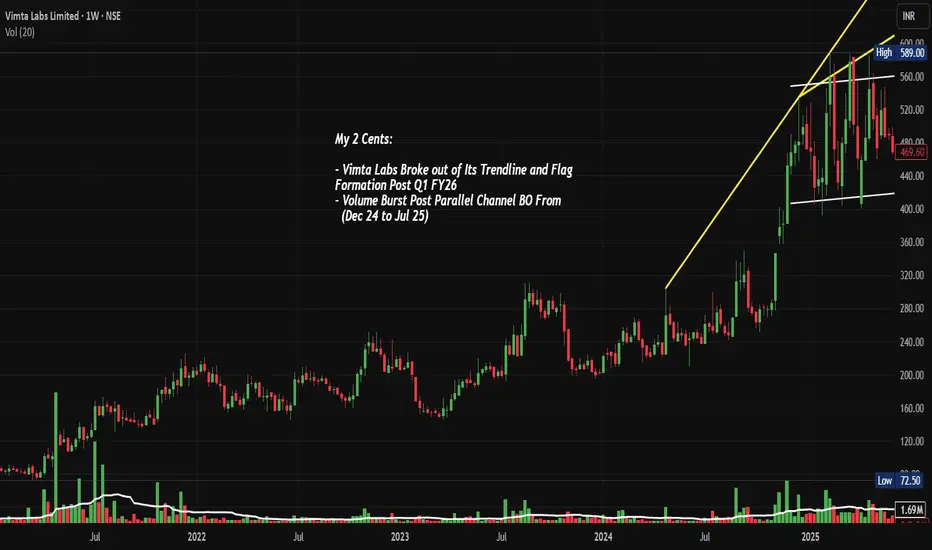
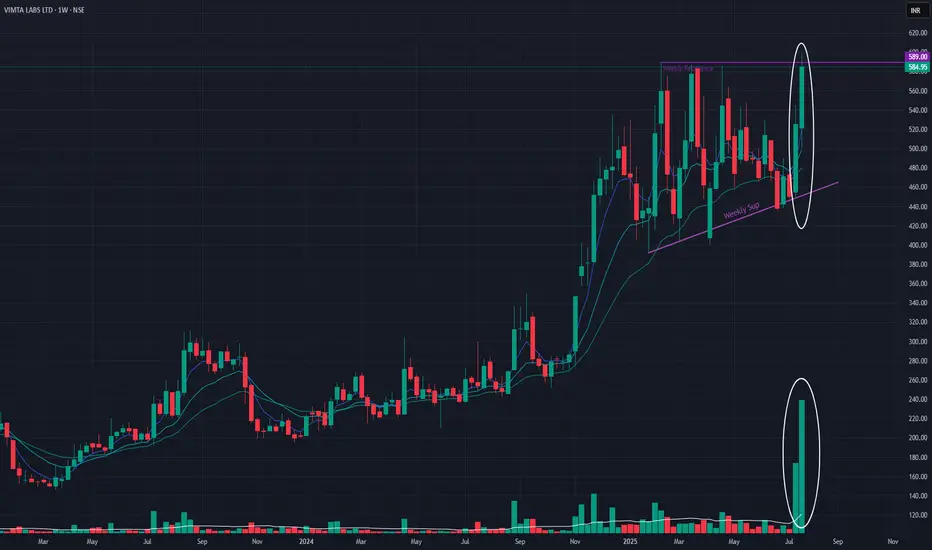
VIMTALABS: Parallel Channel & Flag BO, Chart of the WeekNSE:VIMTALABS Explodes 50%: From Parallel Channel Prison to Trendline Freedom Post Q1 FY26 Flag Breakout. Let's analyse it in the "Chart of the Week"
As per the Latest SEBI Mandate, this isn't a Trading/Investment RECOMMENDATION nor for Educational Purposes; it is just for Informational purposes only. The chart data used is 3 Months old, as Showing Live Chart Data is not allowed according to the New SEBI Mandate.
Disclaimer: "I am not a SEBI REGISTERED RESEARCH ANALYST AND INVESTMENT ADVISER."
This analysis is intended solely for informational purposes and should not be interpreted as financial advice. It is advisable to consult a qualified financial advisor or conduct thorough research before making investment decisions.
Price Action Analysis:
- Current Price: ₹887.20 (as per chart)
- 52-Week Range: ₹252 to ₹903
- Market Cap: ₹3,901 Crores
- Recent Performance: Stock has shown exceptional momentum with 171% returns in the past year
Volume Spread Analysis:
- Breakout Volume: Exceptional volume spike during the August 2025 breakout
- Volume Confirmation: Higher volumes on up-moves, lower on corrections
- Accumulation Phase: Steady volume during the consolidation phase indicates smart money accumulation
Chart Patterns:
- Long-term Ascending Trendline: Yellow trendline acting as dynamic support since May 2024
- Parallel Channel Breakout: Stock consolidated in a 6-month parallel channel (₹400-550) from December 2024 to July 2025
- Flag and Pennant Formation: Classic continuation pattern post Q1 FY26 results
- Volume Breakout: Massive volume surge accompanying the breakout, confirming genuine momentum
Key Technical Levels:
- Base Formation: ₹400-450 level established during Dec 2024 - Jul 2025 consolidation
- Primary Support: ₹550-600 (previous resistance turned support)
- Secondary Support: ₹500 (parallel channel upper boundary)
- Immediate Resistance: ₹700-750 (psychological levels)
- Final Resistance: ₹900-1000
Fundamental and Sectoral Backdrop:
Company Overview:
- Contract Research and Testing Organization serving biopharmaceutical, food, consumer goods, electronic, electrical, agrochemical, healthcare, and medical device sectors
Financial Performance:
- Q1 FY26 Results: Net profit rose 53.83% to ₹19 Crore, sales increased 30.29% to ₹98 crore
- Recent Quarter: EBITDA margins at 35.7%
- Debt Position: The Company is almost debt-free
Sector Dynamics:
- CRO/CRAMS Sector: Strong tailwinds from global pharmaceutical outsourcing
- Biologics Focus: Company expanding in high-growth biologics testing segment
- Regulatory Compliance: Successfully completed US FDA GCP certification
Other Highlights:
- Consistent revenue growth across quarters
- Strong margin expansion and operational efficiency
- Debt-free balance sheet providing financial flexibility
- Expanding service offerings in high-margin biologics
- Beneficiary of the global pharma outsourcing trend
Key Risk Factors:
- High valuation metrics post recent rally
- Dependence on the pharmaceutical sector cycles
- Regulatory compliance requirements
- Competition from larger CRO players
Market Sentiment:
- Recent 31% surge to hit a new 52-week high of ₹902, reflecting strong investor interest
- Strong institutional interest evidenced by consistent buying
- Positive analyst coverage post strong quarterly results
Full Coverage on my Newsletter this Week
Keep in the Watchlist and DOYR.
NO RECO. For Buy/Sell.
📌Thank you for exploring my idea! I hope you found it valuable.
🙏FOLLOW for more
👍BOOST if you found it useful.
✍️COMMENT below with your views.
Meanwhile, check out my other stock ideas on the right side until this trade is activated. I would love your feedback.
As per the Latest SEBI Mandate, this isn't a Trading/Investment RECOMMENDATION nor for Educational Purposes, it is just for Informational purposes only. The chart data used is 3 Months old, as Showing Live Chart Data is not allowed according to the New SEBI Mandate.
Disclaimer: "I am not a SEBI REGISTERED RESEARCH ANALYST AND INVESTMENT ADVISER."
This analysis is intended solely for informational purposes and should not be interpreted as financial advice. It is advisable to consult a qualified financial advisor or conduct thorough research before making investment decisions.
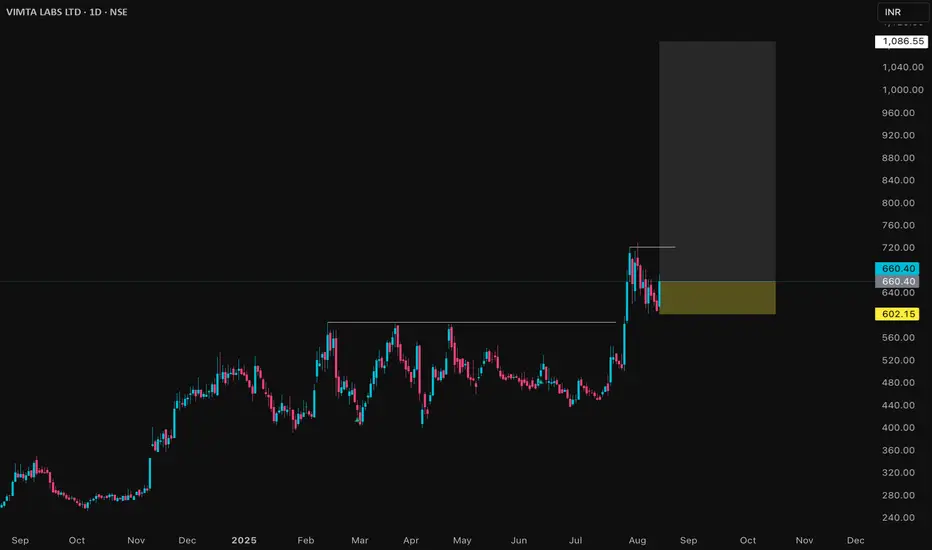
VIMTALABS Price Action## Vimta Labs Ltd – Price Analysis (August 2025)
### Price & Market Metrics
- Current share price is around ₹646–₹659 as of August 13, 2025.
- Market capitalization is approximately ₹2,900 crore.
- The 52-week price range is ₹241.30 (low) to ₹728.95 (high).
- The all-time high was ₹728.95 recorded in early August 2025.
- Recent price movement shows a strong rebound with gains around 6-7.5% over the past day.
### Returns & Volatility
- Over the last 1 year, the stock has surged by approximately 150-160%.
- The 6-month growth pace is about 14-16%.
- Weekly price moves have shown notable volatility, with recent declines around 7.5% in a short time frame.
- The stock exhibits moderate volatility consistent with strong recent price momentum.
### Valuation
- Price/Earnings (P/E) ratio is around 38.
- Price/Book (P/B) ratio is low, roughly 0.14 based on some sources, though others note around 3.6, indicating possible variation in book value interpretation.
- Dividend yield data is not prominent, indicating limited or no regular payout.
### Business & Fundamentals
- Vimta Labs is in the testing, inspection, and certification sector focused on quality control and laboratory testing services.
- The company benefits from growth in industrial and infrastructure sectors fueling demand for quality and compliance services.
- Recent market action indicates investor interest fueled by strong earnings growth expectations.
### Technical & Sentiment Overview
- The stock hit a fresh 52-week high recently but has shown some corrective pullbacks.
- Volume remains healthy reflecting active trading interest.
- The stock price is trading well above average levels, supported by positive market sentiment and sector tailwinds.
***
### Summary
Vimta Labs Ltd has exhibited a strong price rally in the past year with over 150% gains, reaching new highs in early August 2025. The current valuation by P/E stands elevated at about 38, reflecting growth optimism. The share price volatility is moderate but notable due to recent sharp moves. Market capitalization is close to ₹2,900 crore, with the stock trading near its peak levels. Investors should consider the premium valuation against ongoing growth prospects and sector dynamics, while monitoring for potential short-term price fluctuations or corrections.
Overall, Vimta Labs appears to be a growth-oriented stock with robust recent performance, but with valuation levels demanding careful risk assessment for new investors.
Vimta High Momentum & Breakout Stock As we can see in chart Vimta Lab is Bullish In Last some weeks . Its given clear breakout. It's moving in a parttern . It can move 5 -10% very fast In upcoming days. Keep SL near breakout levels near 710.
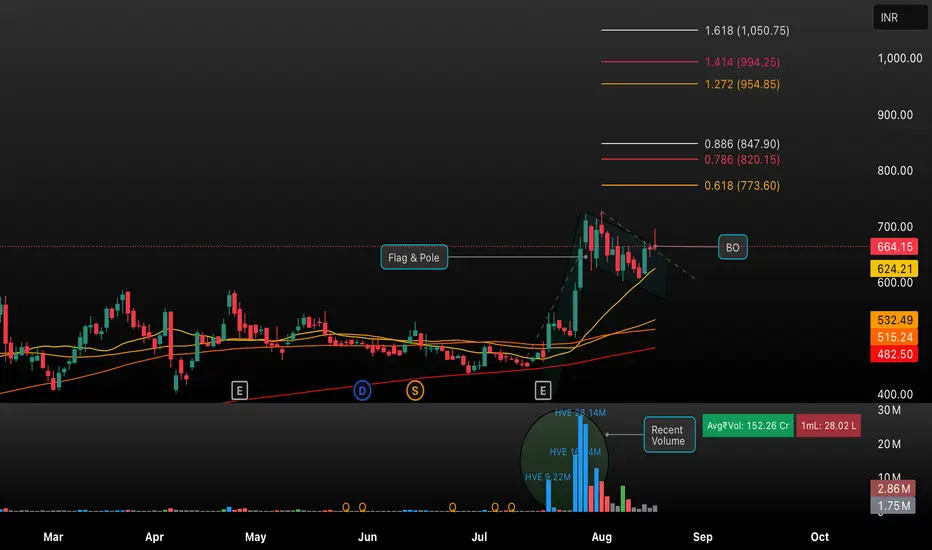
VIMTALABS: Bullish Flag Breakout Confirmed – Volume & Fibonacci Vimta Labs has just triggered a textbook breakout from its classic Flag & Pole pattern, supported by surging volumes and strong momentum indicators. After a sustained consolidation, price action has decisively moved above the resistance line, confirming a bullish continuation with potential targets at key Fibonacci extensions (773, 820, 847, 954, 994, and 1,050 INR).
Daily, weekly, and monthly RSI show increasing strength, and price trades above all major moving averages, reinforcing the bullish setup. Watch for follow-through towards ₹800 and ₹890, with stop-loss suggested near ₹625 to manage risk.
This setup is ideal for traders looking to ride trend continuation post-breakout. Will Vimta Labs reach new highs? Share your views and trading plans below!
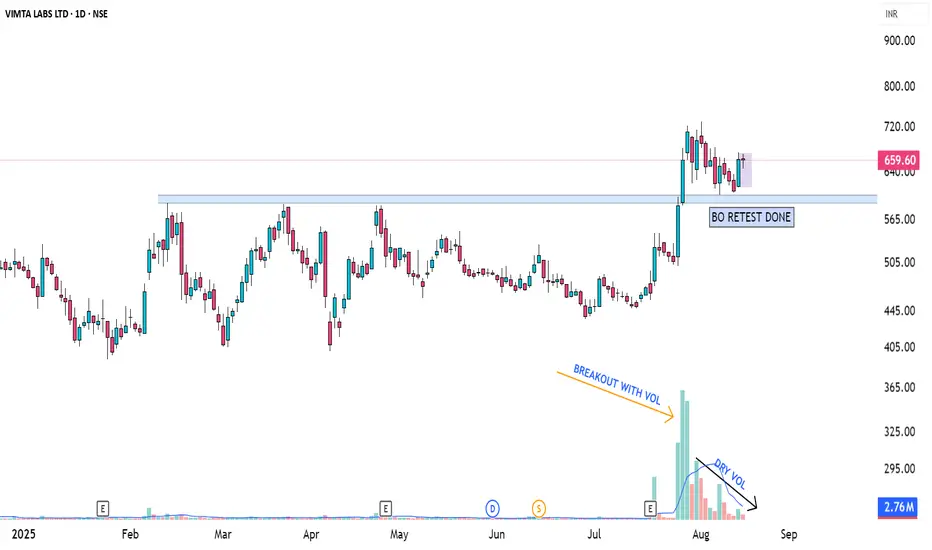
VIMTA LABS DAILY CHART OF VIMTA LABS
Good long base breakout with volumes.
Retest done after breakout with declining volumes.
showing signs of reversal after retest.
DETAILS ON CHART
BUY TODAY SELL TOMORROW for 5%DON’T HAVE TIME TO MANAGE YOUR TRADES?
- Take BTST trades at 3:25 pm every day
- Try to exit by taking 4-7% profit of each trade
- SL can also be maintained as closing below the low of the breakout candle
Now, why do I prefer BTST over swing trades? The primary reason is that I have observed that 90% of the stocks give most of the movement in just 1-2 days and the rest of the time they either consolidate or fall
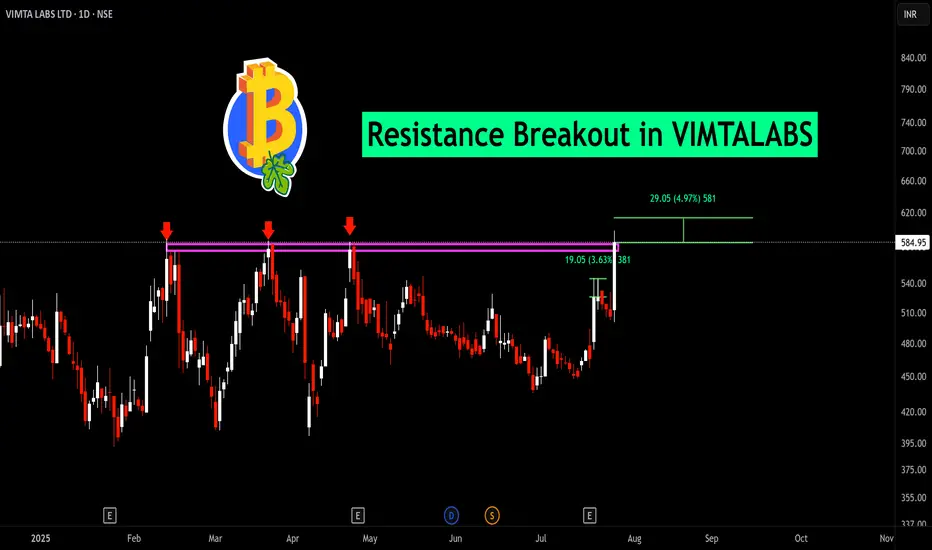
Resistance Breakout in VIMTALABS
BUY TODAY SELL TOMORROW for 5%
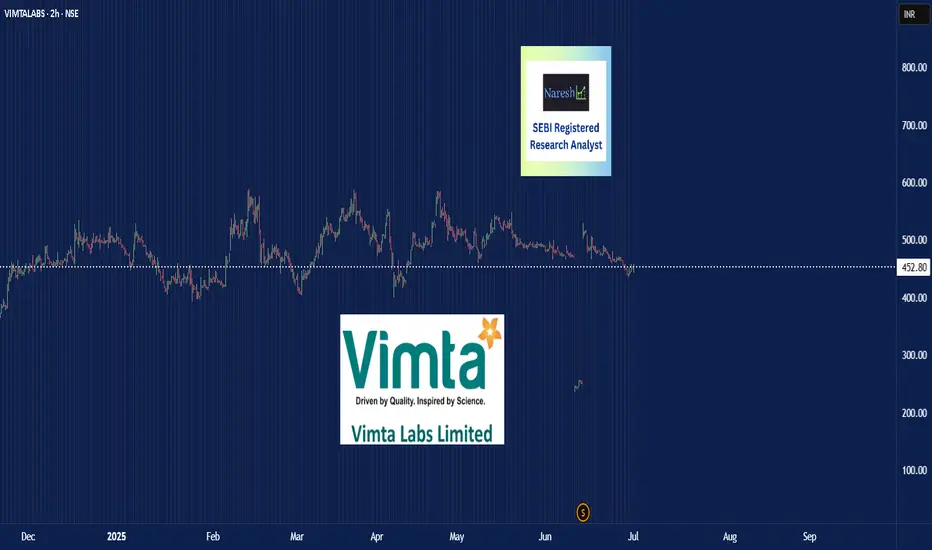
Vimta Labs - Swing Opportunity CMP 452
Add on dips till 430
SL CLB 405
Expected Tgt's 500 & 550
📌 Stick to levels. Follow discipline. Let the trade work for you.
📌Please Follow TSL (Trailing Stop Loss)
To help maximize your profits and protect gains as the trade progresses.
Let’s stay hopeful that the move continues as per our expectations! 📈
💡 Liked the idea?
Then don’t forget to Boost 🚀 it!
For more insights & trade ideas,
📲 Visit my profile and hit Follow
Warm regards,
Naresh G
SEBI Registered Research Analyst
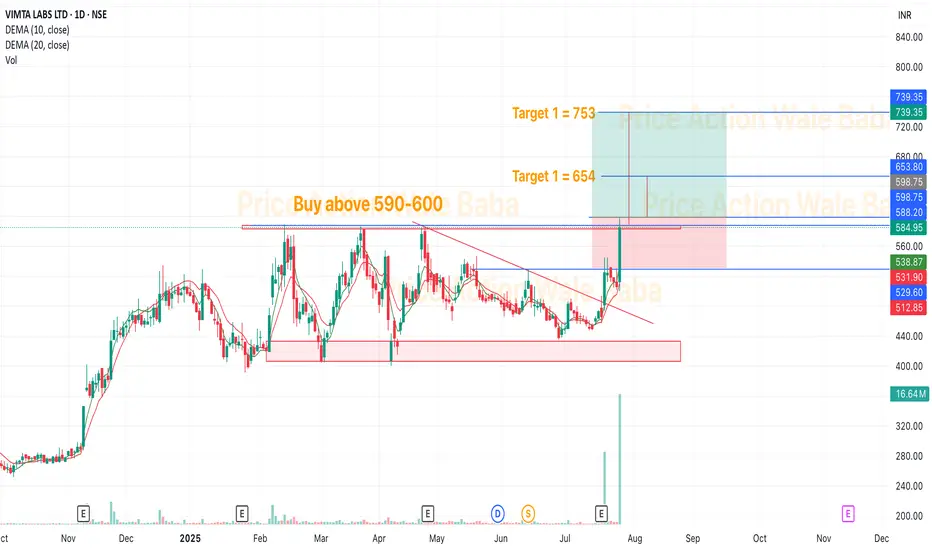
Vimata Labs - Stock Analysis Overview TGT 755Vimata Labs - Stock Analysis Overview
Current Market Price (CMP): ₹691
Target Price (TGT): ₹755
Support Level: ₹585
Key Insights:
Current Market Price (CMP): ₹691
As of the latest market update, Vimata Labs is trading at ₹691. This price represents the current valuation of the stock in the market.
Volatility Factor: At this price point, the stock has experienced some fluctuations, but it remains within an acceptable range for most investors.
Target Price (TGT): ₹755
The target price of ₹755 suggests a potential upside of about 9.2% from the current CMP.
This target price is often set by analysts based on projected growth, future performance, and market sentiment.
Why ₹755? This price is based on several factors such as:
Strong Fundamentals: Solid revenue growth, effective cost management, and consistent performance.
Positive Market Sentiment: Expectations that the stock will perform well due to strong product or service offerings, market conditions, or favorable industry trends.
Technical Indicators: Breakout signals or upward momentum patterns.
Support Level: ₹585
Support level refers to the price point where the stock has consistently found buying interest in the past, preventing it from falling further.
₹585 is the level at which the stock is expected to face a strong buying interest if the price falls to this point.
If the price dips to ₹585, it could be seen as a buying opportunity, as the support level acts as a cushion for the stock price.
Risk Mitigation: Investors can consider ₹585 as the threshold for stopping losses if the stock doesn’t show signs of recovery above this level.
Vimta LabsVimta Labs
VLL is is in the business of contract research and testing in the fields of biologics, small molecules, agro -chemicals, food & beverages, electronics, clinical diagnostics, medical devices, home and personal care products, and environment testing
On July 12th 2024, company approved the scheme of amalgamation of its Wholly Owned Subsidiary company viz. Emtac Laboratories Pvt. Ltd. with the Holding Company
Market Cap: ₹ 2,603 Cr.
Promoter holding: 36.7 %
FII holding: 3.49 %
DII holding: 1.42 %
Public holding: 58.4 %
Debt: ₹ 8.52 Cr.
Debt 3Years back: ₹ 19.0 Cr.
Looks good to buy and hold for the given Targets.
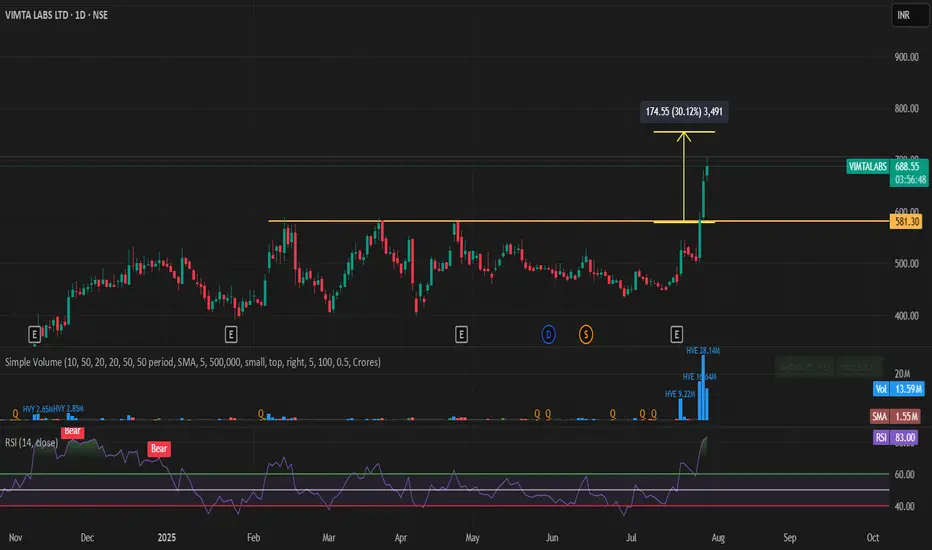
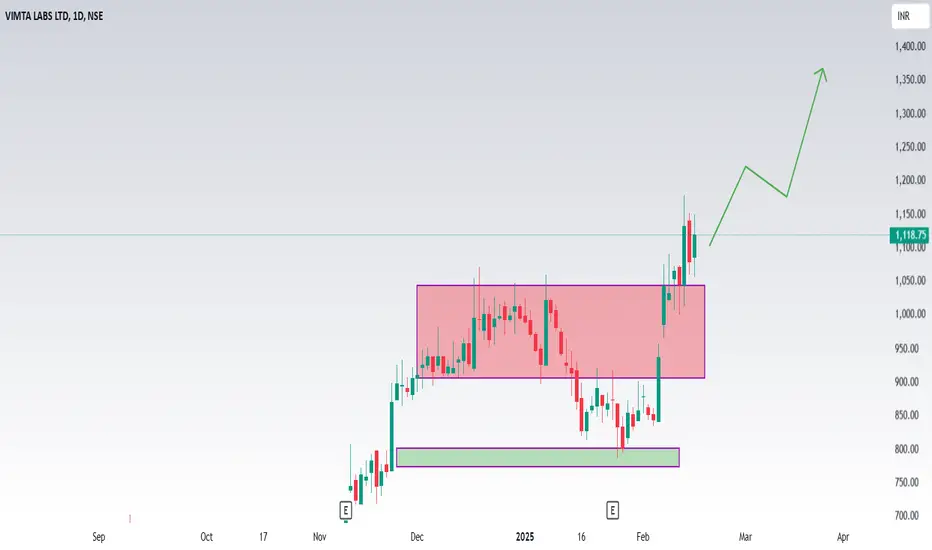
Vimta Labs Ltd (Weekly Timeframe) - Potential BreakoutThis week, the stock has breached the resistance zone and made a new All Time High with huge volume. In Daily Timeframe, the stock has clearly been forming an Ascending Triangle Pattern which is a Bullish pattern. If the stock breaches the resistance zone with good volume, then it may reach new All Time Highs of 780 range.
Awaiting further Price Action.
VIMTALABS price action**VIMTALABS is currently trading around ₹940–950, down from recent highs.** The company has shown strong growth (market cap up 97% in a year), with robust profits and revenue. It recently announced a 1:1 bonus issue effective June 13, 2025. Financially healthy, but the stock is considered high risk and is more volatile than the market. Promoter holding is steady at 36.7%. Short-term, the price is correcting after a big rally, but long-term fundamentals remain strong.
VIMTALABS Price action trade set upVimta Labs Ltd (VIMTALABS) has shown significant price action and volatility in recent months. Here's an analysis of its recent performance:
## Recent Price Movements
- On February 25, 2025, Vimta Labs closed at ₹930.20 .
- The stock reached an intraday high of ₹965.00 and a low of ₹920.00 on that day .
- On February 5, 2025, the stock experienced a significant rebound, rising 8.58% to reach an intraday high of ₹911 .
## Key Price Levels
- 52-Week High: ₹1,178.00
- 52-Week Low: ₹420.00
- All-Time High: ₹1,178.00
- All-Time Low: ₹12.55
## Technical Indicators
- The stock is currently trading above its 5-day, 20-day, 100-day, and 200-day moving averages, but below its 50-day moving average .
- This suggests a mixed short-term and long-term trend.
## Recent Performance
- Over the past month (as of February 5, 2025), Vimta Labs had declined by 3.90%, compared to a 0.96% decrease in the Sensex .
- The stock has shown significant volatility, with a 34% surge in six days, reaching a new high of ₹1,127.40 in February 2025 .
- Over the past 6 months (as of February 21, 2025), the Vimta Labs share price increased by 89.6% .
## Valuation
- As of February 25, 2025, Vimta Labs was trading at a premium of 199% based on estimates of Median Intrinsic Value .
- The stock's TTM P/E ratio was 33.86, which is considered high .
## Market Sentiment
- The stock has shown the ability to outperform its sector, as evidenced by its 6.92% outperformance on February 5, 2025 .
- There have been instances of significant price movements that have prompted exchange inquiries, indicating high investor interest and potential volatility .
This price action analysis suggests that Vimta Labs stock has been experiencing considerable volatility and strong upward momentum, particularly in the short to medium term. However, investors should be cautious of the high valuation and potential for rapid price swings.

Global Pharma space is heating upIndian Pharma shall do well
Especially those that have been into testing and planning this kind of strength for a long time
I feel this counter has the setup to excel
Vimta Labs Ltd Vimta Labs Ltd is a contract research and testing services provider. VLL is is in the business of contract research and testing in the fields of biologics, small molecules, agro -chemicals, food & beverages, electronics, clinical diagnostics, medical devices.

Vimta labs ltdShould I buy VIMTA LABS LTD stock? Our technical rating for VIMTA LABS LTD is buy today. Note that market conditions change all the time — according to our 1 week rating the strong buy trend is prevailing, and 1 month rating shows the strong buy signal.
Vimta Labs Ltd. (NSE: VIMTALABS) is currently exhibiting a strong bullish trend, as indicated by various technical analysis indicators.
**Technical Indicators:**
- **Moving Averages:** All moving averages (5, 10, 20, 50, 100, and 200 periods) are signaling a 'Buy' or 'Strong Buy' position, suggesting sustained upward momentum. citeturn0search2
- **Relative Strength Index (RSI):** The 14-day RSI stands at 89.33, indicating that the stock is in the overbought territory. While this suggests strong momentum, it also implies a potential for price correction. citeturn0search2
- **MACD (Moving Average Convergence Divergence):** The MACD is above the signal line, reinforcing the bullish trend. citeturn0search2
- **Stochastic Oscillator:** The Stochastic Oscillator is in the overbought zone, which may indicate a potential for price pullback. citeturn0search2
**Support and Resistance Levels:**
- **Support:** The stock has support at ₹560. citeturn0search3
- **Resistance:** The resistance level is at ₹1,020. citeturn0search3
**Volume Analysis:**
The stock has experienced high trading volumes at price peaks and lower volumes at price troughs, indicating that price movements are supported by significant trading activity. citeturn0search3
**Conclusion:**
While Vimta Labs Ltd. is currently in a strong bullish phase, the overbought conditions suggested by the RSI and Stochastic Oscillator warrant caution. Investors should monitor these indicators closely, as a price correction could occur if the stock remains in the overbought zone. It's advisable to consider these technical factors alongside fundamental analysis and broader market conditions when making investment decisions.
Vimta Labs Ltd Approaches Breakout: Key Levels to WatchVimta Labs Ltd is approaching its breakout level of ₹1,190, with the current price standing at ₹1,132. A rise beyond ₹1,190 may signal a bullish trend, with possible target levels at ₹1,210, ₹1,240, and ₹1,300.

Vimta Labs Ltd Approaches Breakout: Key Levels to WatchVimta Labs Ltd is approaching its breakout level of ₹1,190, with the current price standing at ₹1,132. A rise beyond ₹1,190 may signal a bullish trend, with possible target levels at ₹1,210, ₹1,240, and ₹1,300.

Vimta Labs#VIMTALABS
Daily chart..
Resistance at 1075
Support at 900
Keep an eye on it..
VIMTALABS stock is 11.36% volatile and has beta coefficient of 0.75. Track VIMTA LABS LTD stock price on the chart and check out the list of the most volatile

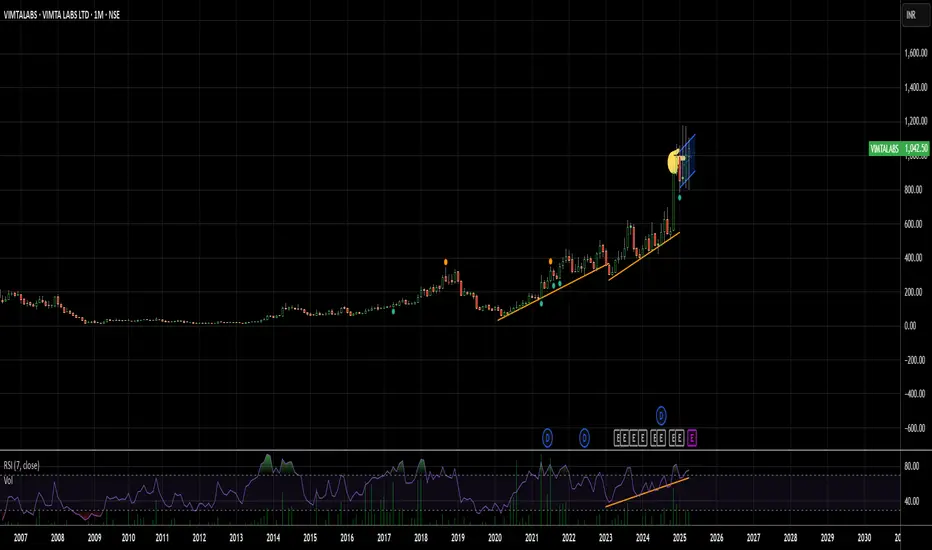
GFS Monthly and Weekly looking strong and short term(daily) taking support on RSI 40, which can be a potential upside move.

Vimta Labs Limited - Breakout Setup, Move is ON...#VIMTALABS trading above Resistance of 952
Next Resistance is at 1214
Support is at 691
Here are previous charts:
Chart is self explanatory. Levels of breakout, possible up-moves (where stock may find resistances) and support (close below which, setup will be invalidated) are clearly defined.
Disclaimer: This is for demonstration and educational purpose only. This is not buying or selling recommendations. I am not SEBI registered. Please consult your financial advisor before taking any trade.
