WIPROWIPRO
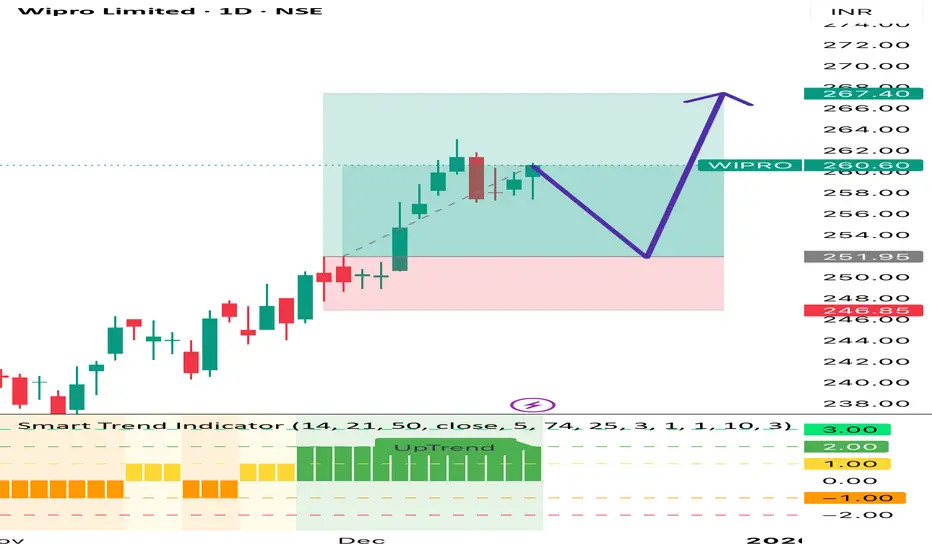
bullish trend is Showing on the chart.
buy signals in
technical indicators and
cup with handle & ascending triangle chart pattern.
BUYING RANGE 230/235
Watch for a breakout above 270/275 to sustain the bullish trend. If the resistance holds, there could be a retest towards 190/200 and an u
Next report date
—
Report period
—
EPS estimate
—
Revenue estimate
—
12.67 INR
131.35 B INR
890.88 B INR
2.82 B
About Wipro Limited
Sector
Industry
CEO
Srinivas Pallia
Website
Headquarters
Bengaluru
Founded
1945
IPO date
Oct 19, 2000
Identifiers
2
ISIN INE075A01022
Wipro Ltd. is a global information technology, consulting and outsourcing company, which engages in the development and integration of solutions. It operates through the following segments: Information Technology Services, India State Run Enterprise Services, and Information Technology Products. The Information Technology Services segment provides digital strategy advisory, customer-centric design, technology consulting, IT consulting, custom application design, development, re-engineering and maintenance, systems integration, package implementation, global infrastructure services, analytics services, business process services, research and development, and hardware and software design to enterprises worldwide. The Information Technology Products segment offers a range of third-party IT products. The company was founded on December 29, 1945 and is headquartered in Bengaluru, India.
Related stocks

Wipro is Look Like Cup & Handle Pattern Wipro is making a cup and handle pattern on the weekly chart. It will move to 322 ,and if it breaks this level, chances are it will break its high 366

WIPRO 1 Week Time Frame 🔎 Current Market Price
Approx Current Price: ~₹265–₹272 per share (latest trading range) — price moving around mid‑260s.
📅 1‑Week Timeframe Key Levels
🔥 Resistance (Upside Targets)
Level Meaning
R1: ~₹273.8 First Weekly Resistance — immediate upside ceiling.
R2: ~₹278.7 Higher Weekly Resis

"The Magic of Mercury"-Stock trading using Vedic astrolog(WIPRO)Friends, we enjoy doing technical analysis on charts because price action and chart patterns are quite easy to understand through drawing.
However, when we talk about astrology, it seems quite confusing. But you will be surprised when you see the effect of planetary movements on the charts. And I wi

WIPRO..Inside the channel..As seen, WIPRO is trading inside the channel..
It has build a strong support somewhere around 263 from where it took support..
One can took a trade inside the channel for the target of somewhere around 273 which was its recent high a few days back and its first Resistance..
We can book profit at

WIPROWIPRO double btotom and trend line breakout ,good upmove we expect in following weeks only for positional and swing trade

WIPRO: Where Most Get Impatient, Price Gets ReadyMost people lose money not because the market is difficult, but because they can’t sit still when price asks them to.
WIPRO has already done the hard work in the past — a long decline, a rounded base, and a strong recovery leg. Now price is not trending aggressively; it’s resting, compressing, and

WIPRO Near Trendline Break – Trend Reversal BrewingWipro has been trading in a broad corrective structure after a prolonged downtrend, but the recent price action signals a clear shift in character. The stock is now approaching a major falling trendline, which has capped price multiple times in the past.
After forming a strong base near the horizon

This stock can be the first casualtyThis stock can just be the first casualty. The rally from 200 odd to 300 odd is corrective in nature and had to be sold. This is a zig zag corrective pattern where both A and C will have 5 waves of their own. The i st wave of C has been deep. Hence the iiird wave will be much more devastating.
Con

WIPRO LONGWIPRO long.
Logic: Wipro has formed a demand zone on the marked levels which is near the weekly demand zone too.
#take proper position size
See all ideas
Summarizing what the indicators are suggesting.
Neutral
SellBuy
Strong sellStrong buy
Strong sellSellNeutralBuyStrong buy
Neutral
SellBuy
Strong sellStrong buy
Strong sellSellNeutralBuyStrong buy
Neutral
SellBuy
Strong sellStrong buy
Strong sellSellNeutralBuyStrong buy
An aggregate view of professional's ratings.
Neutral
SellBuy
Strong sellStrong buy
Strong sellSellNeutralBuyStrong buy
Neutral
SellBuy
Strong sellStrong buy
Strong sellSellNeutralBuyStrong buy
Neutral
SellBuy
Strong sellStrong buy
Strong sellSellNeutralBuyStrong buy
Displays a symbol's price movements over previous years to identify recurring trends.
Frequently Asked Questions
The current price of WIPRO is 232.93 INR — it has decreased by −0.36% in the past 24 hours. Watch Wipro Limited stock price performance more closely on the chart.
Depending on the exchange, the stock ticker may vary. For instance, on NSE exchange Wipro Limited stocks are traded under the ticker WIPRO.
WIPRO stock has fallen by −1.57% compared to the previous week, the month change is a −11.70% fall, over the last year Wipro Limited has showed a −26.71% decrease.
We've gathered analysts' opinions on Wipro Limited future price: according to them, WIPRO price has a max estimate of 330.00 INR and a min estimate of 220.00 INR. Watch WIPRO chart and read a more detailed Wipro Limited stock forecast: see what analysts think of Wipro Limited and suggest that you do with its stocks.
WIPRO reached its all-time high on Oct 14, 2021 with the price of 369.92 INR, and its all-time low was 0.37 INR and was reached on Dec 31, 1996. View more price dynamics on WIPRO chart.
See other stocks reaching their highest and lowest prices.
See other stocks reaching their highest and lowest prices.
WIPRO stock is 0.20% volatile and has beta coefficient of 1.17. Track Wipro Limited stock price on the chart and check out the list of the most volatile stocks — is Wipro Limited there?
Today Wipro Limited has the market capitalization of 2.44 T, it has decreased by −1.37% over the last week.
Yes, you can track Wipro Limited financials in yearly and quarterly reports right on TradingView.
Wipro Limited is going to release the next earnings report on Apr 22, 2026. Keep track of upcoming events with our Earnings Calendar.
WIPRO earnings for the last quarter are 3.21 INR per share, whereas the estimation was 3.20 INR resulting in a 0.42% surprise. The estimated earnings for the next quarter are 3.32 INR per share. See more details about Wipro Limited earnings.
Wipro Limited revenue for the last quarter amounts to 235.56 B INR, despite the estimated figure of 234.73 B INR. In the next quarter, revenue is expected to reach 241.58 B INR.
WIPRO net income for the last quarter is 31.19 B INR, while the quarter before that showed 32.46 B INR of net income which accounts for −3.92% change. Track more Wipro Limited financial stats to get the full picture.
Wipro Limited dividend yield was 2.29% in 2024, and payout ratio reached 47.76%. The year before the numbers were 0.21% and 4.79% correspondingly. See high-dividend stocks and find more opportunities for your portfolio.
As of Feb 6, 2026, the company has 230 K employees. See our rating of the largest employees — is Wipro Limited on this list?
EBITDA measures a company's operating performance, its growth signifies an improvement in the efficiency of a company. Wipro Limited EBITDA is 175.66 B INR, and current EBITDA margin is 20.23%. See more stats in Wipro Limited financial statements.
Like other stocks, WIPRO shares are traded on stock exchanges, e.g. Nasdaq, Nyse, Euronext, and the easiest way to buy them is through an online stock broker. To do this, you need to open an account and follow a broker's procedures, then start trading. You can trade Wipro Limited stock right from TradingView charts — choose your broker and connect to your account.
Investing in stocks requires a comprehensive research: you should carefully study all the available data, e.g. company's financials, related news, and its technical analysis. So Wipro Limited technincal analysis shows the strong sell today, and its 1 week rating is strong sell. Since market conditions are prone to changes, it's worth looking a bit further into the future — according to the 1 month rating Wipro Limited stock shows the sell signal. See more of Wipro Limited technicals for a more comprehensive analysis.
If you're still not sure, try looking for inspiration in our curated watchlists.
If you're still not sure, try looking for inspiration in our curated watchlists.