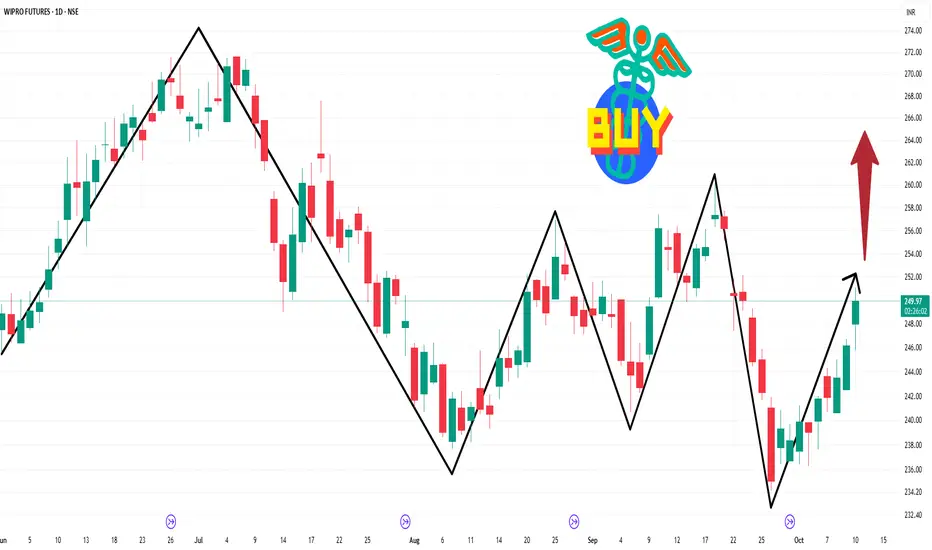
WIPRO 1 Day Time Frame 📈 Current Price & Trend
Price: ₹250.50
Day's Range: ₹246.26 – ₹250.63
Previous Close: ₹246.20
Change: +1.62%
🔍 Technical Indicators
RSI (14): 78.90 (Overbought)
MACD: 1.86 (Bullish)
ADX: 46.59 (Strong Trend)
CCI (14): 237.19 (Overbought)
Moving Averages: All major MAs (5, 10, 20, 50, 100, 200) are in a "Strong Buy" position
📊 Key Levels
Support: ₹242, ₹240, ₹230
Resistance: ₹255, ₹260, ₹265
52-Week High: ₹324.60 (July 2, 2025)
✅ Outlook
The technical indicators suggest a strong bullish momentum. However, with the RSI indicating overbought conditions, a short-term pullback could occur. A sustained move above ₹255 could target ₹265–₹270 in the short term
WIPRO FUTURES
No trades
Market insights
WIPRO LONG IDEAIT Sector is showing Bullishness these Days, So I am go through WIPRO fundamentally Strong Stock , showing Weekly Breakout
entry Price approx - 550-560
Target for next 3-6 month 50% upside Possible


Wipro RSI convergenceHeavy Convergence observed in Wipro additionally It's taking support from Fib level 0.618 and we can see a kind of cup and handle pattern in 2 hour candle too many bullish signals. Taking a long position and holding for sometime

#WIPRO possible to buy#WIPRO trading 476 formed bullish pattern,
Today trading our retracement level,
we can buy above 478 and tgt 485
SL: LIVE

#WIPRO possible to buy
#WIPRO trading 566.75 formed bullish pattern,
Today trading our retracement level,
we can buy above 568.5 and tgt for 573
follow SL 562

Question on Wipro FuturesQuestion on Wipro Futures
Stock has down and out for quite sometime with sustained selling.
Its now approaching an important support of 531-524 zones.
Keep an eye on this level, Risk takers can look to go long near this zone.

wipro analysis for monththis is trail of my new stretegy for stocks which results are coming please dont trade . as wipro result is coming on 12 jan . if price come to our demand zone near result days then it will give a good bounce.hope for best .thanku


Buy Wipro June Fut at 521 with SL of 508 Buy Wipro at 521
SL 508
TGT 550
RSI above 65
ADX is above 25
In 52 W high zone

WIPROOOOOOKeep an eye on Wipro it seems to be moving good.Good fundamentals are pumping up the price with on right terms.

Wipro - Balance - Look below and accelerate ?Wipro: We have seen strong Demand Imbalance causing good bull Run.. but "Shortening of Demand thrust" indicates a small Reversal or correction.
Big correction is due as per Elliott analysis.
Trade Facilitation to the upside is good, so far.. but it has to breakout from the current balance, if not - Look below and fail, or Look below and accelerate..
Hence Neutral trades are good.


Why Wipro may be headed up to new highsWipro seems to have completed a W-X-Y correction at its recent lows. Note that X wave is a triangle which is clearly evident. The subsequent upmove can be charted out as an 1-2 with waves 3-4-5 still awaited
A lot of the India IT stocks are headed up - see recent posts on Mindtree/TCS
