Options vs Buying & Selling in TradingPart 1: Basics of Buying & Selling in Trading
1.1 How It Works
Buying (going long): The trader purchases an asset, expecting its price to rise. Profit comes from selling it later at a higher price.
Selling (going short): The trader sells an asset they don’t own (borrowing it from a broker), expect
Related futures
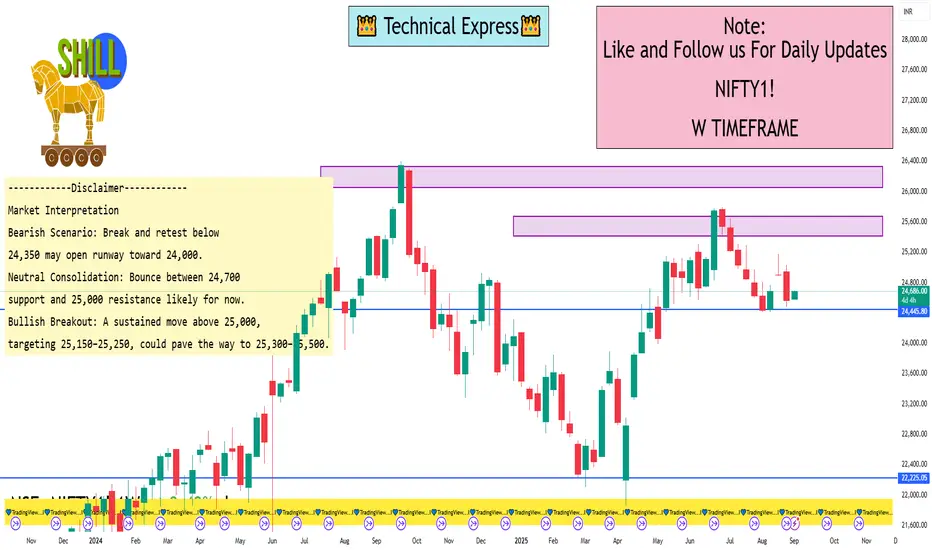
NIFTY @ 24828. Will HISTORY Repeat?LTP: 24828
Supports: 24389/23830/23587
Resistances: 25025/155/2579626440
As long as the above supports hold, we can see 25300 first.
Further 25877, 26190, 26819 (ultimate target), 27234+++.

"Baby I Got You"
**🎭 Dear NIFTY, Playing the Same Old Tricks Again? We See You! 👀**
**The Classic NIFTY Playbook - Chapter 247:**
Oh look, NIFTY's at it again with the good old reliable scam! 🙄
**The Setup (We've Seen This Movie Before):**
• Creates "strong support" at 24,640 - because why not give retail hope?
Bears stepped in at 24926 ; 25K resistanceNifty futures is at a crucial zone, 25K is a crucial resistance which price is unable to cross from past 3 weeks. With bears stepping in at 24926, bears may have an edge if we don't take out previous week's high.

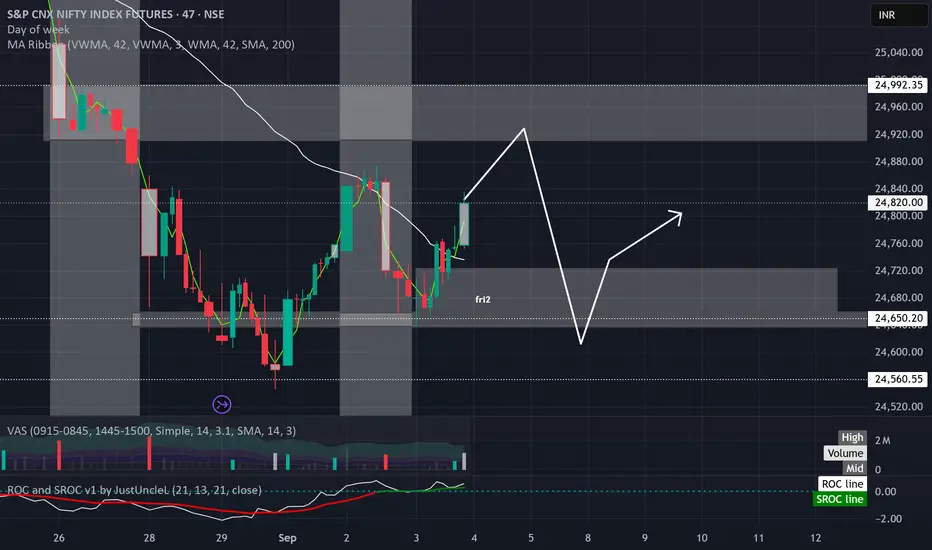
***''Boring Week or Trump-et?'''****- AVWAPs converging, candles are lackluster, trend remains unclear.
- Sideways movement likely between 24,700 and 25,050.
- Any breakout beyond the borders could be a trap—need a real “trumpet” for confirmation.

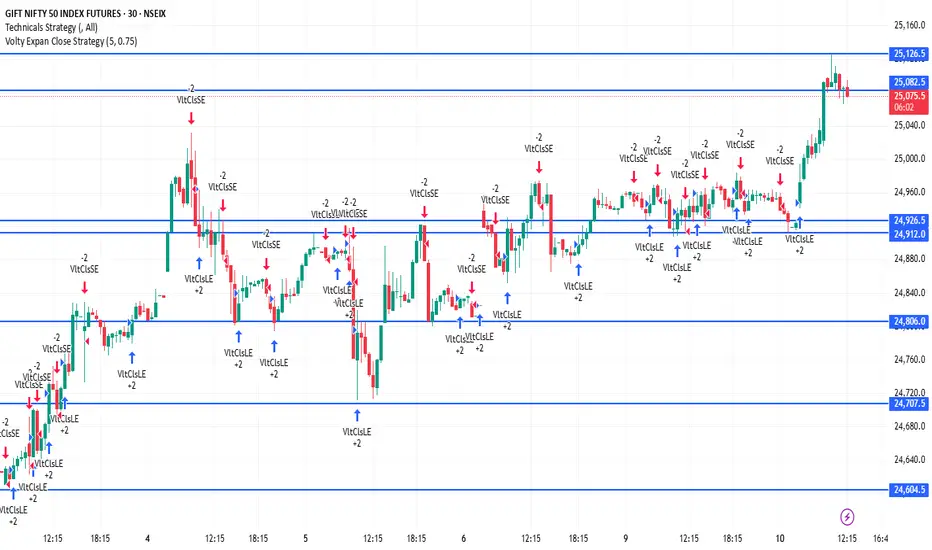
NIFTY1! 30Minutes Time frame📊 NIFTY1! – 30-Minute Timeframe (Current)
Current Price Zone: Approximately 25,092
🔻 Support Levels:
25,060 – Immediate support
25,020 – Stronger support zone
24,980 – Major support; breakdown here may lead to further weakness
🔺 Resistance Levels:
25,130 – Immediate resistance
25,180 – Stron
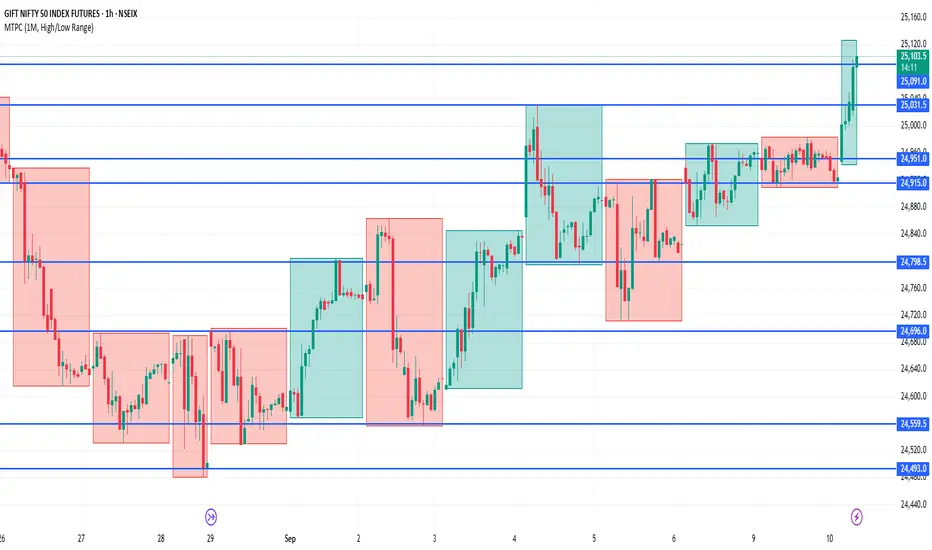
NIFTY1!📍 NIFTY1! – 1H Key Levels
🔹 Support Zones
22,450 – 22,500 → Immediate intraday support
22,350 – 22,400 → Stronger support, buyers likely active here
22,200 – 22,250 → Major support zone, breakdown can invite selling pressure
🔹 Resistance Zones
22,650 – 22,700 → Immediate resistance on 1H chart
Hammer Candlestick Reversals - Bullish & Bearish Setups🔹 Intro / Overview
In this idea, we focus on the Hammer candlestick pattern — both Bullish and Bearish variations.
The Hammer is a powerful reversal signal formed with a small body, a long shadow, and defined highs/lows.
When combined with EMA High–Low Band Confirmation and swing structure, it creat

S&P CNX Nifty Index Futures 1 Week View1. Technical Levels — Weekly Pivot Points & Fibonacci Zones
Thanks to TopStockResearch, here are the key pivot-derived levels for the weekly timeframe:
Standard Weekly Pivots:
Support 2 (S2): ~24,213.80
Support 1 (S1): ~24,000.80
Pivot (Central): ~24,830.70
Resistance 1 (R1): ~25,234.60
Resis
Monday's are notorious for swing lows and highs.
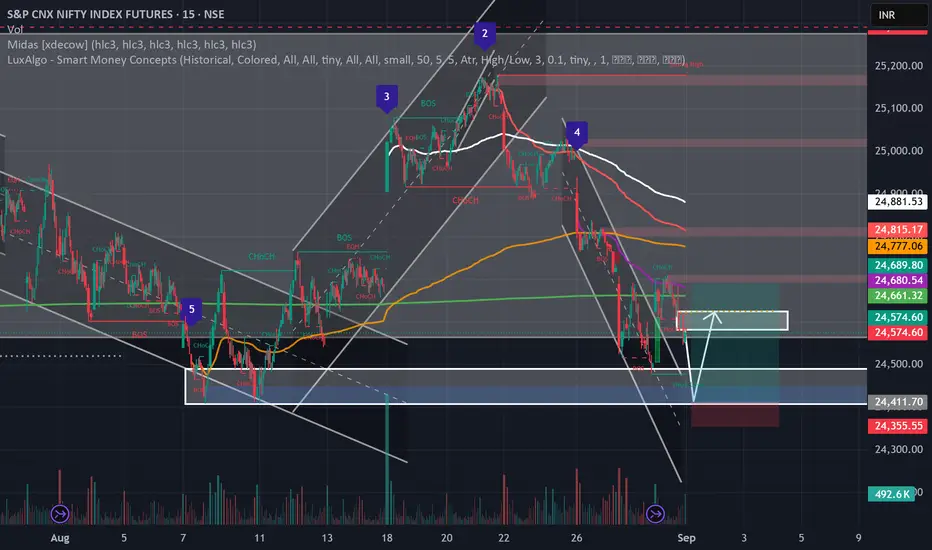
**📊 NIFTY FUTURES - Potential Bounce Setup from Key Confluence Zone**
**Key Technical Setup:**
• Long-term AVWAP anchored at 21,900 has turned flat, indicating equilibrium
• Multiple selling AVWAPs (red, white, yellow) are converging, suggesting exhaustion of selling pressure
• Market trading with
See all ideas
A representation of what an asset is worth today and what the market thinks it will be worth in the future.
Displays a symbol's price movements over previous years to identify recurring trends.