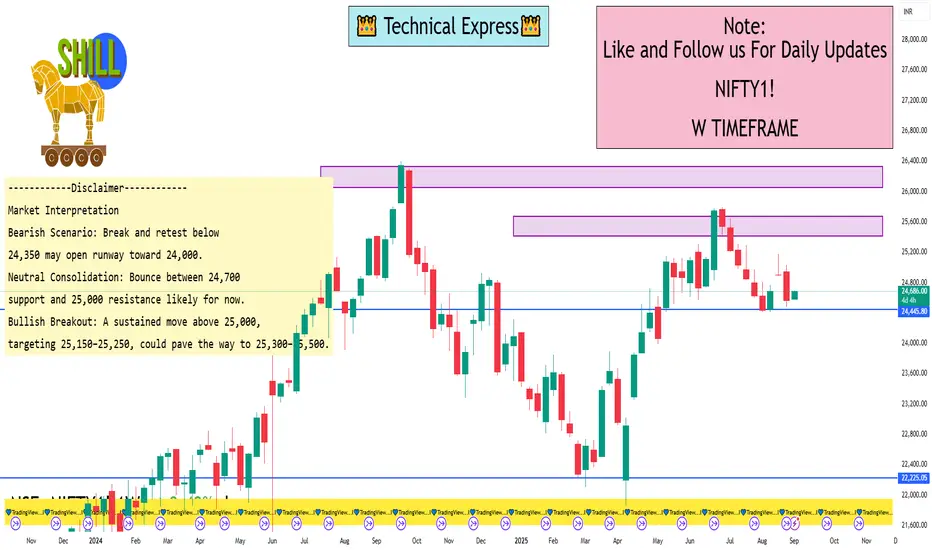
NIFTY @ 24828. Will HISTORY Repeat?LTP: 24828
Supports: 24389/23830/23587
Resistances: 25025/155/2579626440
As long as the above supports hold, we can see 25300 first.
Further 25877, 26190, 26819 (ultimate target), 27234+++.
Related futures

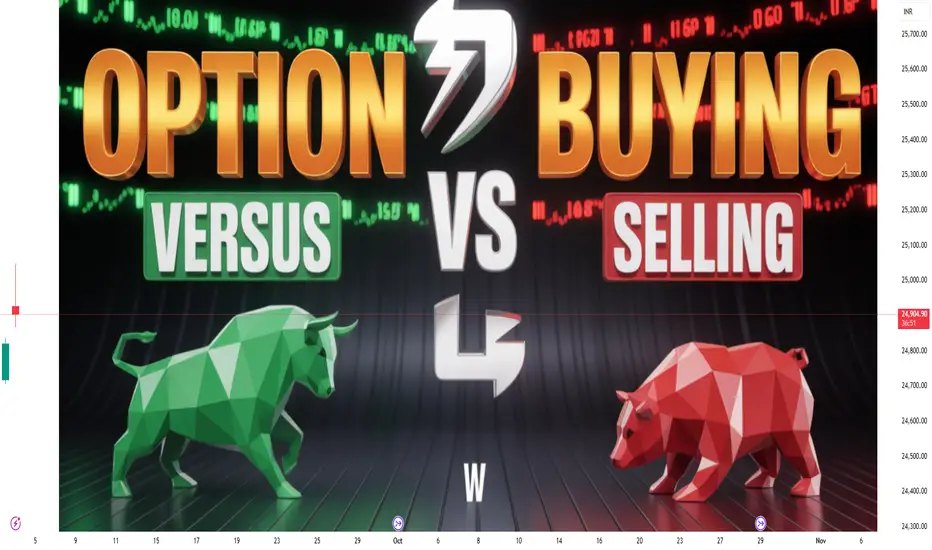
Options vs Buying & Selling in TradingPart 1: Basics of Buying & Selling in Trading
1.1 How It Works
Buying (going long): The trader purchases an asset, expecting its price to rise. Profit comes from selling it later at a higher price.
Selling (going short): The trader sells an asset they don’t own (borrowing it from a broker), expect
Bears stepped in at 24926 ; 25K resistanceNifty futures is at a crucial zone, 25K is a crucial resistance which price is unable to cross from past 3 weeks. With bears stepping in at 24926, bears may have an edge if we don't take out previous week's high.

"Baby I Got You"
**🎭 Dear NIFTY, Playing the Same Old Tricks Again? We See You! 👀**
**The Classic NIFTY Playbook - Chapter 247:**
Oh look, NIFTY's at it again with the good old reliable scam! 🙄
**The Setup (We've Seen This Movie Before):**
• Creates "strong support" at 24,640 - because why not give retail hope?
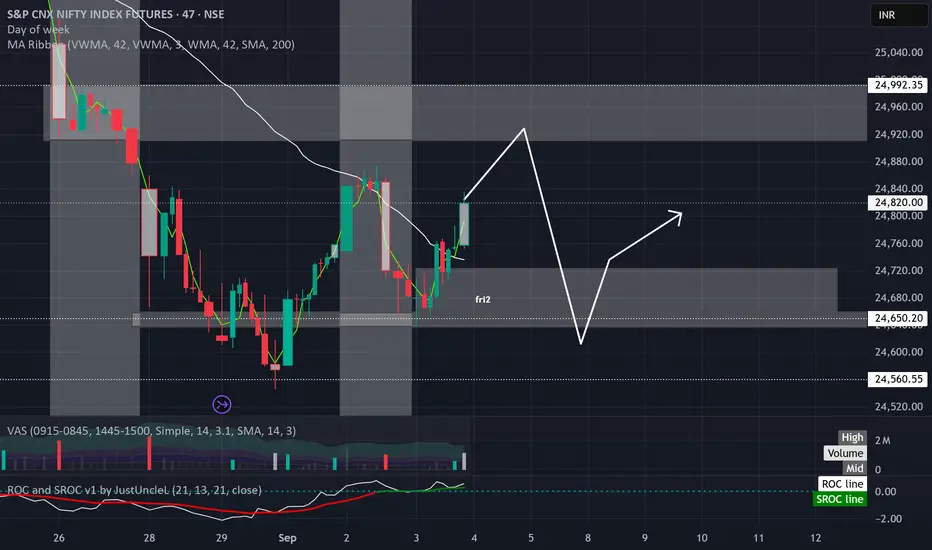
***''Boring Week or Trump-et?'''****- AVWAPs converging, candles are lackluster, trend remains unclear.
- Sideways movement likely between 24,700 and 25,050.
- Any breakout beyond the borders could be a trap—need a real “trumpet” for confirmation.

NIFTY1! 30Minutes Time frame📊 NIFTY1! – 30-Minute Timeframe (Current)
Current Price Zone: Approximately 25,092
🔻 Support Levels:
25,060 – Immediate support
25,020 – Stronger support zone
24,980 – Major support; breakdown here may lead to further weakness
🔺 Resistance Levels:
25,130 – Immediate resistance
25,180 – Stron
NIFTY1!📍 NIFTY1! – 1H Key Levels
🔹 Support Zones
22,450 – 22,500 → Immediate intraday support
22,350 – 22,400 → Stronger support, buyers likely active here
22,200 – 22,250 → Major support zone, breakdown can invite selling pressure
🔹 Resistance Zones
22,650 – 22,700 → Immediate resistance on 1H chart
Hammer Candlestick Reversals - Bullish & Bearish Setups🔹 Intro / Overview
In this idea, we focus on the Hammer candlestick pattern — both Bullish and Bearish variations.
The Hammer is a powerful reversal signal formed with a small body, a long shadow, and defined highs/lows.
When combined with EMA High–Low Band Confirmation and swing structure, it creat

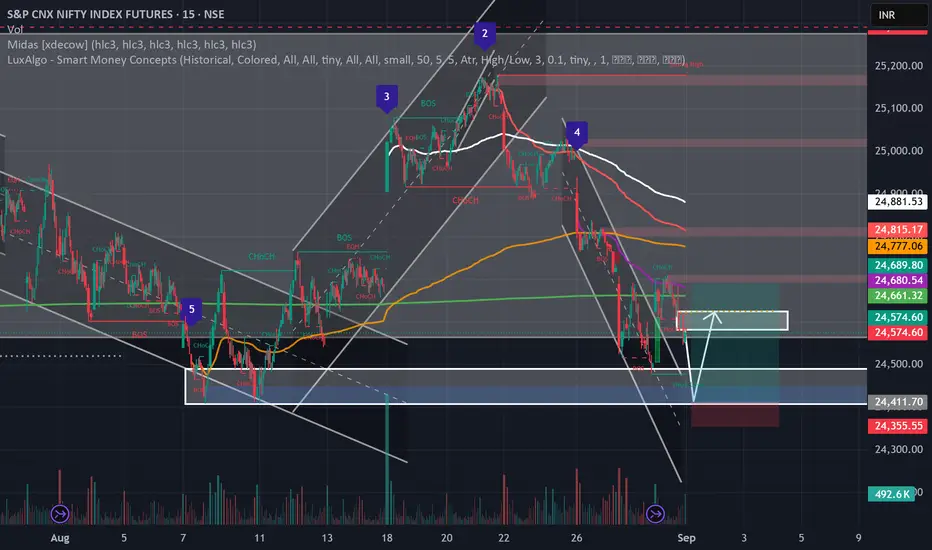
S&P CNX Nifty Index Futures 1 Week View1. Technical Levels — Weekly Pivot Points & Fibonacci Zones
Thanks to TopStockResearch, here are the key pivot-derived levels for the weekly timeframe:
Standard Weekly Pivots:
Support 2 (S2): ~24,213.80
Support 1 (S1): ~24,000.80
Pivot (Central): ~24,830.70
Resistance 1 (R1): ~25,234.60
Resis
Monday's are notorious for swing lows and highs.
**📊 NIFTY FUTURES - Potential Bounce Setup from Key Confluence Zone**
**Key Technical Setup:**
• Long-term AVWAP anchored at 21,900 has turned flat, indicating equilibrium
• Multiple selling AVWAPs (red, white, yellow) are converging, suggesting exhaustion of selling pressure
• Market trading with
See all ideas
A representation of what an asset is worth today and what the market thinks it will be worth in the future.
Displays a symbol's price movements over previous years to identify recurring trends.
Frequently Asked Questions
The nearest expiration date for GIFT NIFTY 50 INDEX FUTURES is Feb 24, 2022.
Traders prefer to sell futures contracts when they've already made money on the investment, but still have plenty of time left before the expiration date. Thus, many consider it a good option to sell GIFT NIFTY 50 INDEX FUTURES before Feb 24, 2022.