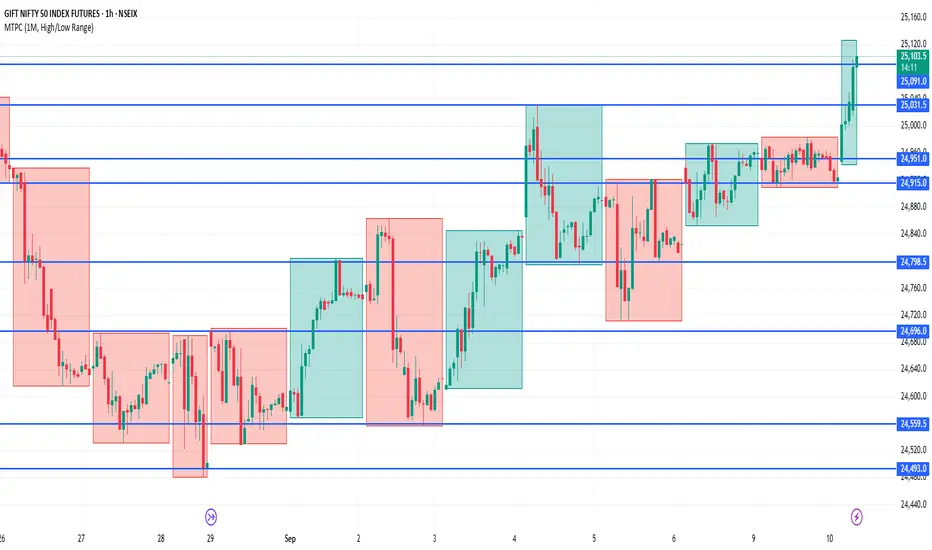
NIFTY Future - Harmonic Shark Pattern approaching PRZ - IntradayTF: 15 minutes
CMP: 25190
The Harmonic pattern formed intraday is close to the PRZ at 25210-220
One can expect 50% retracement of the CD leg (that is 25150) as the first target.
SL at 25240 in NF
Disclaimer: I am not a SEBI registered Analyst and this is not a trading advise. Views are personal and for educational purpose only. Please consult your Financial Advisor for any investment decisions. Please consider my views only to get a different perspective (FOR or AGAINST your views). Please don't trade FNO based on my views. If you like my analysis and learnt something from it, please give a BOOST. Feel free to express your thoughts and questions in the comments section.
Trade ideas
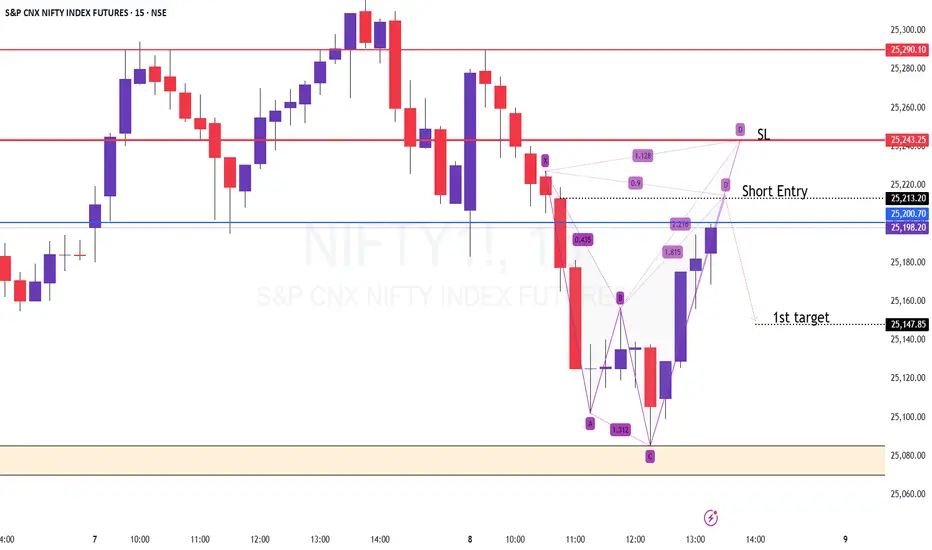
Nifty Future - Harmonic CRAB at the PRZ
TF: 15 minutes
CMP: 25420
The Harmonic Crab pattern is in play and is now at the resistance/PRZ zone of 25400-420
Please be informed that, more often than not, price action at the PRZ is frequently extended beyond the 1.618 fib level (since this pattern itself is known as Extension pattern).
First confirmation of the pullback is break and trade below VWAP (intraday), now placed at 25355
This is an extreme pattern, hence, price volatility is expected
Disclaimer: I am not a SEBI registered Analyst and this is not a trading advise. Views are personal and for educational purpose only. Please consult your Financial Advisor for any investment decisions. Please consider my views only to get a different perspective (FOR or AGAINST your views). Please don't trade FNO based on my views. If you like my analysis and learnt something from it, please give a BOOST. Feel free to express your thoughts and questions in the comments section.
"Bull Flag on the cards"???# NIFTY FUTURES - Short-term Consolidation Expected 📉
**Current Price:** 25,220 | **Change:** -1.00 (-0.00%)
---
## 🎯 ANALYSIS OVERVIEW
**Timeframe:** Next 2-3 days only
**Bias:** Short-term BEARISH (Contra view)
**Larger Trend:** BULLISH (Target 26,000+)
---
## 📊 TECHNICAL SETUP
### Pattern Identified: Rising Wedge (Bearish)
The chart shows a clear rising wedge formation that has reached its apex. This pattern typically resolves with a breakdown.
### Key Observations:
- ⚠️ **AVWAPs turning flat** - Loss of bullish momentum
- 🔴 **Overhead resistance zone** - 25,360 acting as ceiling
- 📉 **Wedge breakdown in progress** - Price rejecting upper boundary
- 📊 **Volume declining** into the apex
---
## 🎯 KEY LEVELS
### Resistance Zones:
- **25,240-25,260** - Immediate resistance
- **25,360** - Strong overhead resistance (brown line)
### Support Zones:
- **25,162** - First support (AVWAP)
- **25,136-25,117** - Critical support cluster
- **24,988** - Deeper test target
- **25,000-25,050** - Strong bounce zone
---
## 📈 EXPECTED PATH (Next 2-3 Days)
### Scenario 1: Consolidation/Pullback (Base Case)
1. Rejection from 25,240-25,260 zone
2. Pullback to test 25,160-25,117 support
3. Possible deeper test to 24,988-25,000
4. Consolidation range: **25,050-25,220**
### Scenario 2: Breakout (Invalidation)
- Break and close above **25,240** with volume
- If this happens, **IGNORE this view**
- Continue with bullish momentum
---
## 💡 TRADING STRATEGY
### For Bears (Short-term):
- **Entry:** On rejection at 25,240-25,260
- **Target 1:** 25,160
- **Target 2:** 25,117
- **Target 3:** 24,988
- **Stop Loss:** 25,280
### For Bulls (Buy the Dip):
- **Wait for:** 25,000-25,050 zone
- **Reason:** Better risk-reward for 26K+ target
- **This consolidation = Fresh entry opportunity**
---
## ⚠️ IMPORTANT NOTES
1. **This is a CONTRA view** - Markets are in bullish phase
2. **Short-term only** (2-3 days) - Not a trend reversal
3. **Invalidation:** Break above yesterday's high
4. **Bigger picture:** Still bullish for 26,000+ breakout
5. **Purpose:** Healthy consolidation to set up next leg up
---
## 🔔 RISK MANAGEMENT
- This is counter-trend trading - **Keep positions small**
- Honor stop losses strictly
- If market breaks 25,240, exit immediately
- Don't fight the larger bullish trend
---
## 📌 CONCLUSION
Looking for a **2-3 day consolidation/minor correction** to 25,050-25,160 zone before the next rally toward 26,000+. This would create a healthier base and better entry point for longs.
**Positionally still BULLISH** - This is just short-term profit booking/consolidation phase.
---
*Disclaimer: This is my personal analysis, not financial advice. Trade at your own risk. Markets can remain irrational longer than you can remain solvent.*
chill

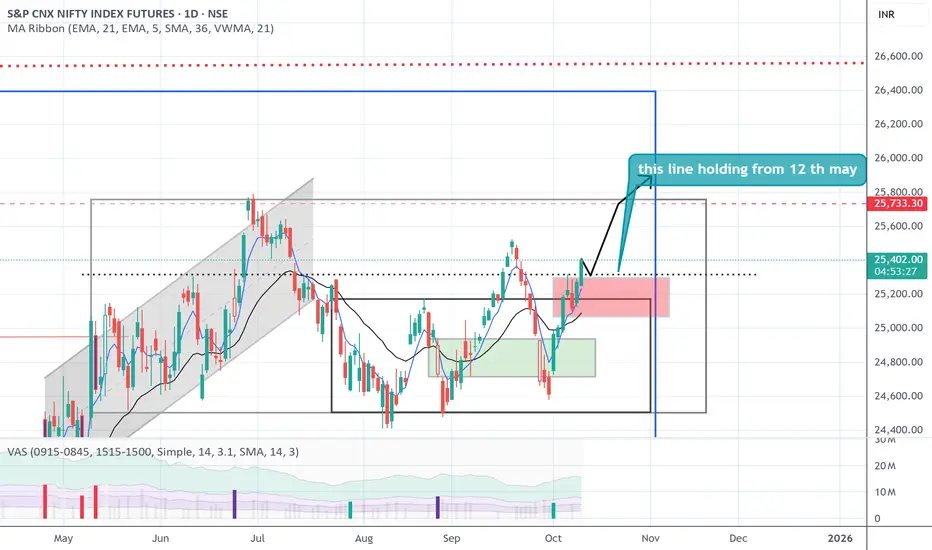
Get set Gooooo;;;;;;;;;;;**Key Observations:**
- Clean breakout above the resistance trendline held since May 12th
- Markets have been range-bound for 6 months (May-October)
- We might at least cross the upper range before the market decides its next major move
- Current price: 25,392.80
**Trading Plan (Today is BO Day):**
- ⏳ **Wait for a dip** - Don't chase the breakout
- 📦 **Critical Zone: 25,300-25,100** (Red Box)
- ✅ **Long Setup**: If price does NOT test the red box bottom and stays above it by closing
- ⚠️ **Key Condition**: Daily close above 25,100-25,300 zone confirms strength
**What to Watch:**
- Does price retest the breakout level or continue higher?
- Closing price is crucial - need to see price holding above the red box
- If it dips into 25,100-25,300 and closes above, that's your entry zone
- Avoid longs if it closes below the red box
The 6-month consolidation may finally be resolving. Upper range breakout could lead to a significant move, but patience is key on breakout day.
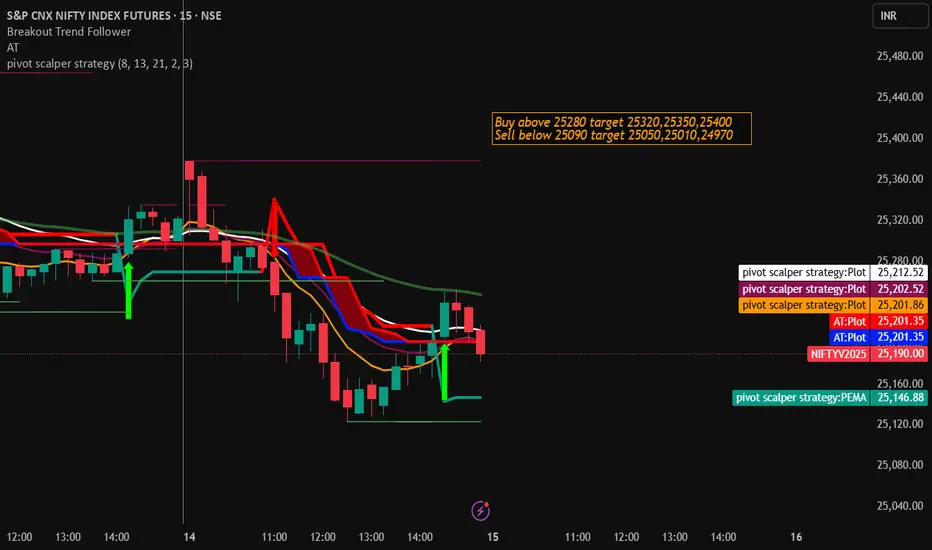
Nifty Futures Trading Stragety for 15th October 2025📊 NIFTY FUTURES TRADING PLAN (Intraday Setup)
🕒 Time Frame: 15-Minute Candle
📈 BUY SETUP
✅ Entry: Buy above the high of the 15-min candle if it closes above 25,280
🎯 Targets:
🎯 T1: 25,320
🎯 T2: 25,350
🎯 T3: 25,400
🔒 Stop Loss: Below the 15-min candle low
📉 SELL SETUP
❌ Entry: Sell below the low of the 15-min candle if it closes below 25,090
🎯 Targets:
🎯 T1: 25,050
🎯 T2: 25,010
🎯 T3: 24,970
🔒 Stop Loss: Above the 15-min candle high
⚠️ Disclaimer:
📢 I am not a SEBI-registered analyst. This analysis is purely for educational and informational purposes. Please consult your financial advisor before making any trading decisions. Trade at your own risk.
24k to 26k still in play# NIFTY 50 FUTURES - Range Trading Opportunity 📊
## Market Structure Analysis
NIFTY has completed its **breakout phase** and **channel formation**, and is now entering a **range-bound trading environment**. The market has tested the lower end of the channel and is showing signs of support.
## Key Levels 🎯
**Trading Range:** 24,200 - 26,000
- **Support Zone:** 24,200 - 24,400 (Channel Low)
- **Current Price:** 25,213
- **Resistance/Target:** 26,000
## Market Phases
Markets typically trade in three distinct stages:
1. ✅ **Breakout Phase** - Completed
2. ✅ **Channel/Trend Phase** - Completed
3. 🔄 **Range Trading Phase** - Current Stage
## Trade Setup 📈
**Direction:** LONG (Buy)
**Rationale:**
- Price is at the lower end of the established range
- Channel low has been tested and holding
- October historically shows positive seasonal bias
- Negative news flow appears to have peaked (Trump-related concerns priced in)
**Target:** 26,000
**Entry Zone:** Current levels (25,200-24,400)
**Stop Loss:** Below 24,150 (below channel low)
## Risk-Reward Analysis
The current positioning offers a favorable risk-reward setup:
- Trading from lower range boundary
- Clear resistance target at 26,000
- Defined risk below channel support
## Conclusion
Range trading strategy is optimal in the current market phase. With seasonal tailwinds and exhausted negative sentiment, going long from the lower range presents an attractive opportunity.
---
*Note: This is not financial advice. Always manage your risk and position size according to your trading plan.*
**What u say??" i like to know

Developing Monthly bias How to build bias for any month ?
Building Monthly Bias with CPR
1. Identify the Central Pivot Range (CPR) for the month
• CPR is the average price level for the month.
• It remains constant throughout the month and acts as the balance point.
2. Mark Key Levels:
• Above CPR: Previous Monthly High, R1, R2 (resistances).
• Below CPR: Previous Monthly Low, S1, S2 (supports).
3. Interpretation:
• Price generally oscillates between these ranges.
• CPR provides the “fair value” of the market for the month.
• The supports and resistances mark the extremes.
4. Bias Formation:
• If price sustains above CPR → bullish bias.
• If price sustains below CPR → bearish bias.
• If price hovers around CPR → sideways / neutral bias.
5. Trading Psychology:
• Avoid being overly bullish when prices are near upper extremes.
• Avoid being overly bearish when prices are near lower extremes.
• The CPR itself gives a strong indication of directional bias.
👉 In short: CPR = Balance Point; R1/R2 = upper boundary; S1/S2 = lower boundary. Price oscillates within this band, giving us a practical monthly bias.

Trading Strategies for MEME Stocks1. Understanding MEME Stocks
Before developing strategies, it’s essential to define what MEME stocks are:
Definition: MEME stocks are shares that gain popularity primarily through social media hype rather than traditional financial metrics. Examples include GameStop (GME), AMC Entertainment (AMC), and others.
Volatility: They are extremely volatile, often moving 20–50% in a single day based on social sentiment rather than earnings reports.
Market Influences: Retail investor activity, viral posts, and short squeezes heavily influence price movements.
Understanding these characteristics is the foundation for building effective trading strategies.
2. Core Principles of Trading MEME Stocks
Trading MEME stocks requires a different mindset than traditional investing. The following principles are critical:
Momentum Focus: MEME stocks move quickly, often with no correlation to fundamentals. Traders need to follow momentum rather than intrinsic value.
Sentiment Analysis: Monitoring social media trends, forum discussions, and news can provide insights into potential surges.
Risk Management: High volatility demands strict stop-loss levels to avoid catastrophic losses.
Quick Decision-Making: Entry and exit decisions must be executed rapidly as price swings can be extreme within hours.
These principles will guide strategy development.
3. Momentum Trading Strategy
Momentum trading is one of the most effective approaches for MEME stocks.
Steps:
Identify Trending Stocks: Use screeners or social platforms to identify stocks with surging discussions and trading volume.
Confirm Volume: High trading volume validates momentum. Sudden spikes in volume often precede price surges.
Technical Entry Points: Enter trades on breakouts above resistance levels or strong bullish candlestick patterns.
Exit Strategy: Exit on signs of weakening momentum or reversal patterns. Trailing stop-loss orders can protect profits while allowing for upside continuation.
Advantages:
Captures large price swings.
Utilizes short-term opportunities effectively.
Risks:
False breakouts can result in rapid losses.
Requires constant monitoring of market sentiment.
4. Social Media Sentiment Analysis
MEME stocks are uniquely sensitive to online sentiment. Traders can leverage this through:
Reddit Monitoring: Subreddits like WallStreetBets provide early signals of potential surges.
Twitter and Discord: Influential accounts and trending discussions can influence retail trading behavior.
News Aggregators: Platforms like Finviz or Stocktwits track viral news and chatter.
Implementation:
Track keywords and hashtags related to the stock.
Look for sudden spikes in mentions or engagement metrics.
Cross-reference sentiment with trading volume for confirmation.
Benefit:
Sentiment analysis allows traders to anticipate moves before they materialize in price charts, giving a first-mover advantage.
5. Short Squeeze Strategy
Short squeezes are a common driver of MEME stock rallies.
Understanding Short Squeezes:
A short squeeze occurs when heavily shorted stocks experience sudden buying pressure.
Short sellers are forced to cover positions, driving prices higher rapidly.
Strategy Steps:
Identify Heavily Shorted Stocks: Use short interest ratios and data from platforms like FINRA.
Monitor Trigger Events: Positive news, social media hype, or momentum indicators can trigger a squeeze.
Entry Point: Enter during early signs of short covering, often indicated by rising volume and sudden price jumps.
Exit Point: Take profits as soon as momentum shows signs of fading or when price becomes unsustainably high.
Advantages:
Can generate rapid gains in short periods.
High potential ROI if timed correctly.
Risks:
Extremely volatile; timing is critical.
Losses can be significant if squeeze fails.
6. Technical Analysis for MEME Stocks
While fundamentals may take a backseat, technical analysis is crucial for MEME trading.
Key Tools:
Support and Resistance Levels: Identify critical price levels for entry and exit.
Moving Averages: Short-term moving averages (e.g., 5-day, 20-day) help identify momentum trends.
Relative Strength Index (RSI): Helps spot overbought or oversold conditions, useful in predicting reversals.
Candlestick Patterns: Patterns like bullish engulfing, hammers, or doji can signal potential reversals or continuation.
Best Practices:
Combine multiple indicators for confirmation.
Focus on intraday and short-term charts (1-min, 5-min, 15-min) for trade timing.
Avoid relying solely on a single technical signal due to high volatility.
7. Risk Management Strategies
Risk management is arguably the most critical aspect of MEME stock trading.
Techniques:
Position Sizing: Never allocate more than a small percentage of capital to a single trade (e.g., 1–5%).
Stop-Loss Orders: Protect against sharp reversals by placing stop-loss orders slightly below support levels.
Take-Profit Levels: Predefine exit points to lock in gains amid rapid volatility.
Diversification: Spread investments across multiple MEME stocks to reduce exposure to a single trend.
Psychology:
Emotional discipline is key. MEME stocks can be highly addictive due to rapid gains.
Avoid chasing price spikes; stick to pre-defined trade plans.
8. Swing Trading Strategy
Swing trading is suitable for traders looking to hold MEME stocks for several days or weeks.
Steps:
Identify Trend: Use daily or weekly charts to find uptrending MEME stocks.
Entry Point: Buy during temporary pullbacks in an overall uptrend.
Exit Point: Sell near resistance levels or when technical indicators show momentum fading.
Monitoring: Keep track of news, social sentiment, and earnings reports as catalysts for continued momentum.
Benefits:
Captures larger trends than intraday trades.
Less stressful than constant intraday monitoring.
Risks:
Overnight gaps can result in unexpected losses.
Requires patience and confidence in trend continuation.
9. Scalping Strategy
For highly active traders, scalping offers opportunities to profit from intraday volatility.
Methodology:
Use Short Timeframes: Focus on 1-minute or 5-minute charts.
Frequent Trades: Execute multiple small trades targeting minor price fluctuations.
Technical Indicators: Leverage moving averages, Bollinger Bands, and volume indicators.
Quick Exit: Close positions as soon as targets are met, avoiding large drawdowns.
Advantages:
Takes advantage of rapid price movements typical in MEME stocks.
Reduces exposure to overnight risk.
Risks:
Demands full attention and fast execution.
High transaction costs may eat into profits.
10. Psychological and Behavioral Considerations
Trading MEME stocks is as much a psychological game as a technical one.
Herd Mentality: Many traders follow the crowd, creating self-fulfilling price spikes.
Fear of Missing Out (FOMO): Can lead to impulsive entries at peak prices.
Patience and Discipline: Successful traders avoid emotional decision-making and stick to predefined strategies.
Avoiding Overexposure: MEME stocks can dominate media headlines, but not all hype translates into sustainable profits.
Understanding these behavioral aspects is crucial for surviving the extreme volatility inherent in MEME stocks.
11. Tools and Platforms for MEME Stock Trading
Traders can leverage various tools to improve their decision-making:
Trading Platforms: Robinhood, Webull, Zerodha, and Interactive Brokers offer easy access to MEME stocks.
Screeners: Tools like Finviz, TradingView, and Yahoo Finance help identify trending stocks.
Social Media Analytics: Platforms like Stocktwits, Reddit tracking tools, and Twitter analytics assist in sentiment monitoring.
Technical Indicators: TradingView and MetaTrader allow charting with customizable indicators for intraday and swing trading strategies.
12. Common Mistakes to Avoid
Ignoring Risk Management: Overleveraging can lead to catastrophic losses.
Chasing Hype: Entering trades at peak prices often results in losses when momentum fades.
Neglecting Exit Strategy: MEME stocks can reverse quickly; predefined exit points are essential.
Overtrading: Excessive trading increases costs and emotional stress.
Avoiding these pitfalls can improve long-term success.
13. Conclusion
Trading MEME stocks is an exhilarating but highly risky endeavor. Unlike traditional investing, it relies heavily on momentum, social sentiment, and short-term price action rather than fundamental valuation. Successful MEME traders combine multiple strategies:
Momentum and swing trading for capturing trends.
Sentiment analysis to anticipate moves.
Short squeeze exploitation for rapid gains.
Strict risk management to safeguard capital.
Additionally, psychological discipline and adherence to predefined trading rules are critical. While MEME stocks can generate extraordinary returns, they demand careful planning, continuous monitoring, and a clear understanding of the volatile forces at play. By applying these strategies thoughtfully, traders can navigate the exciting world of MEME stocks while mitigating the risks inherent in this unconventional market segment.
Price Signals Weakness: Hints at Lower low formation on Daily TFThis week, Nifty has formed a distinctly bearish candle, indicating strong dominance by the sellers. This development suggests that the price action may be preparing for the formation of another lower low on the daily timeframe. The possible scenarios in line with this outlook have been discussed in this weekly analysis.

INFY 1D Time frame📊 Daily Snapshot
Closing Price: ₹1,484.65
Day’s Range: ₹1,476.50 – ₹1,502.70
Previous Close: ₹1,494.60
Change: Down –0.64%
52-Week Range: ₹1,307.00 – ₹2,006.45
Market Cap: ₹6.17 lakh crore
P/E Ratio (TTM): 22.62
Dividend Yield: 2.90%
EPS (TTM): ₹65.63
Beta: 1.09 (indicating moderate volatility)
🔑 Key Technical Levels
Support Zone: ₹1,469 – ₹1,473
Resistance Zone: ₹1,485 – ₹1,490
Pivot Point: ₹1,480.97 (Fibonacci)
All-Time High: ₹2,006.45
📈 Technical Indicators
RSI (14-day): 44.45 – approaching oversold territory, suggesting potential for a rebound.
MACD: Negative at –6.34, indicating bearish momentum.
Moving Averages: Trading below the 50-day (₹1,511.06) and 200-day (₹1,495.15) moving averages, indicating a bearish trend.
Stochastic RSI: Between 45 and 55, indicating a neutral condition.
CCI (20): Between –50 and 50, implying a neutral condition.
📉 Market Sentiment
Recent Performance: Infosys experienced a decline of 0.64% on September 25, 2025, underperforming the broader market.
Volume: Trading volume was significantly higher than its 20-day average, indicating increased investor activity.
📈 Strategy (1D Timeframe)
1. Bullish Scenario
Entry: Above ₹1,485
Stop-Loss: ₹1,469
Target: ₹1,490 → ₹1,500
2. Bearish Scenario
Entry: Below ₹1,469
Stop-Loss: ₹1,485
Target: ₹1,460 → ₹1,450
How to Survive Gold Volatility During News Events?Hello Traders!
Gold is one of the most volatile instruments in the market, especially during big news events like US Fed announcements, inflation data, or geopolitical updates.
Many traders either get stopped out too early or end up chasing wild moves.
So how do you survive and trade smartly when gold becomes unpredictable? Let’s break it down.
1. Understand Why Gold Reacts So Much
Gold is directly linked to the US dollar, interest rates, and global fear sentiment.
Whenever important data comes out, traders across the world hedge positions using gold, which creates sudden spikes in volatility.
2. Avoid Trading Before the News
Gold often becomes choppy 15–30 minutes before a major event.
Liquidity dries up, spreads widen, and stop losses get hunted.
The safest choice is to wait until the news is released and the first move settles.
3. Reduce Position Size
Instead of trading big lots, cut down your size during news events.
This reduces emotional stress and allows your stop loss to be wider.
Remember, survival is more important than chasing one big move.
4. Use Wider Stop Loss with Strict Risk Control
Gold can spike $5–10 within seconds during news.
Place your stop a little further than usual, but never risk more than your planned % of capital.
Risk control matters more than perfect entries during such events.
5. Focus on the Second Move
The first spike after news is often a trap, institutions trigger stops and grab liquidity.
The real direction usually appears in the second move once the market digests the data.
Patience gives you better entries.
Rahul’s Tip:
Treat gold news events as opportunities for learning, not quick profits.
If you’re not confident, it’s perfectly fine to sit out, no trade is also a strategy.
Conclusion:
Gold volatility during news events can be dangerous if you chase blindly, but manageable if you plan well.
By reducing size, waiting for confirmation, and focusing on survival first, you can turn chaos into clarity.
This Educational Idea By @TraderRahulPal (TradingView Moderator) | More analysis & educational content on my profile
If this post gave you a better way to handle gold volatility, like it, share your view in comments, and follow for more trading education that matters!

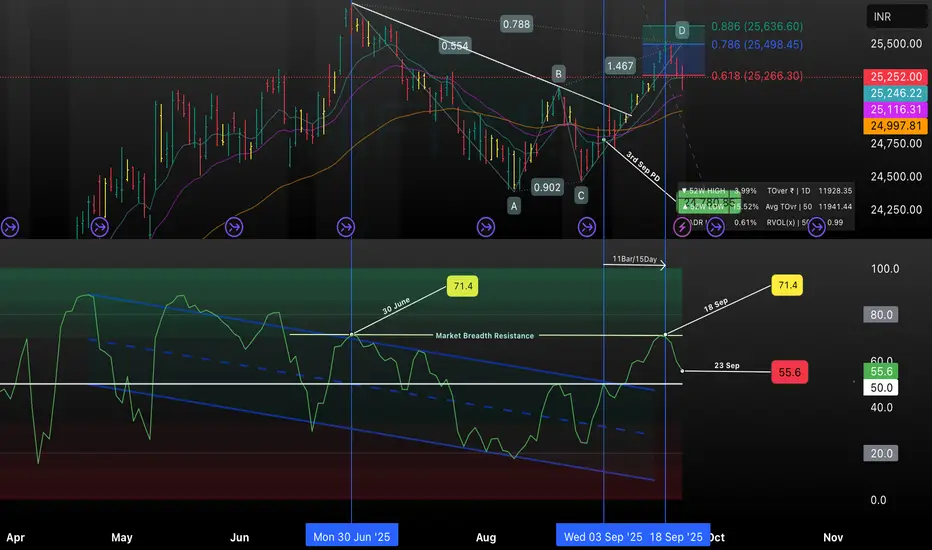
NIFTY 1D | Bearish Harmonic Pattern, RSI Rejection at ResistanceThis chart highlights a bearish harmonic setup forming on NIFTY’s daily timeframe, with key confluence at the 0.618 and 0.786 Fibonacci retracement levels. A descending trendline and ABCD points are marked, exposing short-term reversal probability. The RSI indicator shows clear rejection at the 71.4 ‘Market Breadth Resistance’ zone on both June 30 and September 18, 2025, followed by a sharp drop to 55.6 as of September 23. This confluence signals caution for bullish momentum, with support/resistance and volume metrics also annotated for clarity.
nifty closing predictionsAs per chart patterns and technical indicators, there is a possibility that nifty will close lower today compared to the previous closing.
" Path of least resistance is up" Lets catch the dip////???
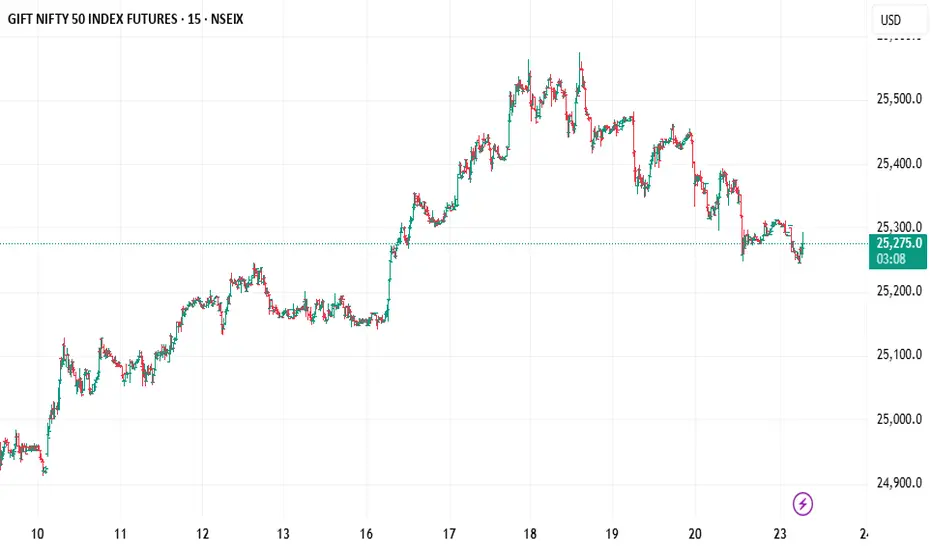
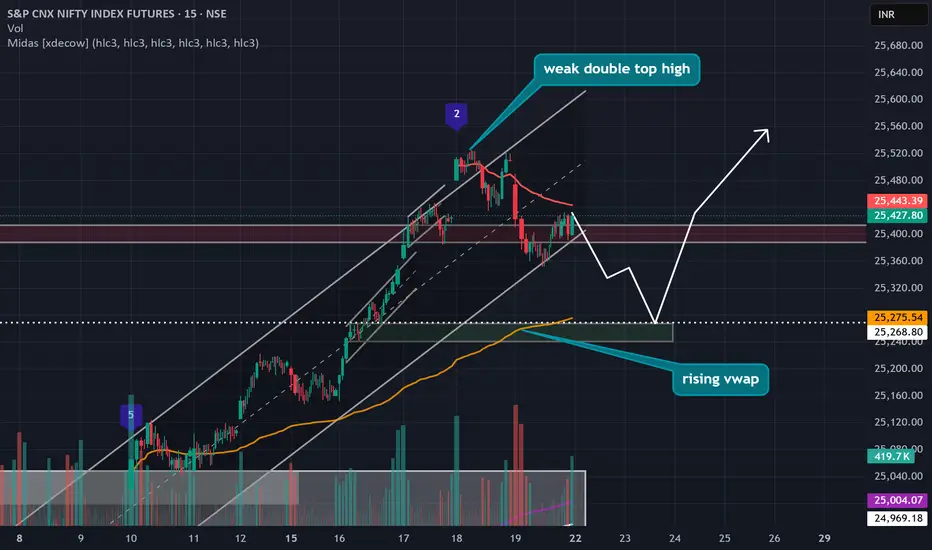
**NIFTY FUTURES - Weak Double Top Formation**
📊 **Current Setup:**
- Weak double top pattern identified near 25 500 levels
- Rising VWAP providing dynamic support from below
- Limited volume at recent highs suggesting weak resistance
🔍 **Key Observations:**
- The double top shows relatively weak conviction with minimal volume spikes at the peaks
- Lack of significant selling pressure at resistance levels
- Rising VWAP could act as immediate support on any pullback
- path of least resistance is currently up and no volume spike resistance in its direction
⚠️ **Trading Considerations:**
- Possible retest of the highs given weak resistance
- Watch for volume confirmation on any breakout attempt
- VWAP support around 25,268-25,275 area crucial to monitor
- Without volume expansion, range-bound action likely to continue
📈 **Bias:** Neutral to slightly bullish given the weak nature of the resistance and rising VWAP support
**Key Levels:**
- Resistance: 25,443 (recent high)
- Support: 25,275 (VWAP) / 25,004 (lower range)
*Trade what you see, not what you think. Always manage risk.*
---
Would you like me to adjust the tone or add any specific technical details to this post?
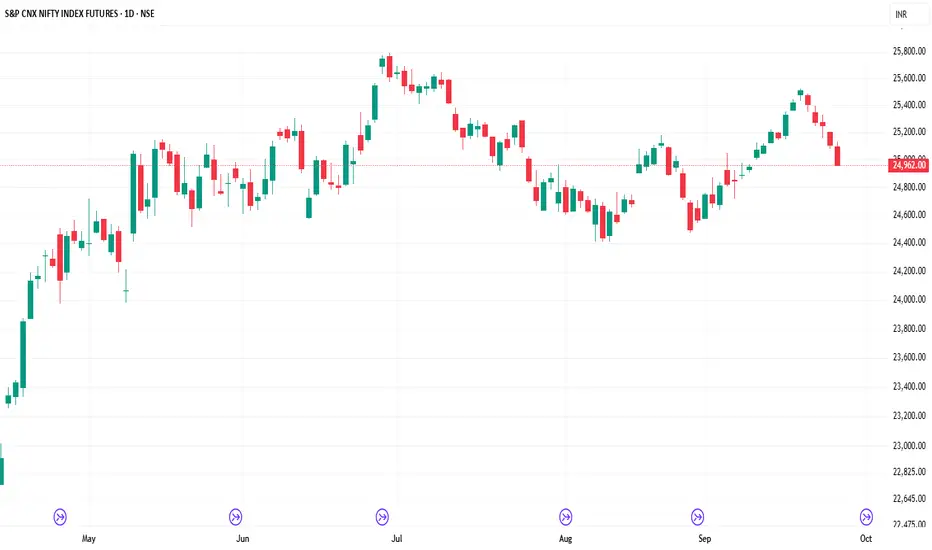
Near month end - Poor RR on upside, scope for profit takingAs we approach the final week of September, it’s worth noting that Nifty has witnessed a strong rally through the first three weeks of the month. Going into the coming week and the remainder of the month, the risk–reward on the upside appears limited. This raises the possibility of profit-taking and a potential mean reversion toward lower levels. In such a scenario, key support zones to watch would include previous monthly highs and other established support levels.

Nifty 50 Breakout and RSI Momentum Analysis – Sept 2025This TradingView chart presents a technical analysis of Nifty 50, highlighting a recent breakout from a descending trendline with harmonic ABCD pattern and advanced RSI insights. Key support and resistance levels are marked, and RSI momentum shows a clear structural shift as of September 17, 2025. The setup visualizes Fibonacci zones, price action targets, and a multi-timeframe confluence to help traders anticipate future market moves and confirm trend reversals.

A HIDDEN CUP AND HANDLE ?this chart is nifty futures chart and as we can see that there is nearly a formation of cup and handle also it has not formed completely , lets see what nifty has for us in coming days and if it does breakout ??????

Nifty 50 Breakout & Market Breadth Trend (Sep 2025) This chart highlights a Nifty 50 near-term breakout following a completed ABCD harmonic structure and rising market breadth levels into mid-September 2025. Key Fibonacci resistance zones are mapped, with price targets up to 25,500 based on the 0.786 and 0.886 extension levels. The market breadth indicator signals an emerging bullish momentum, reinforcing potential continuation above recent highs if index breadth sustains above 60.
This format provides clarity, technical reference, and aligns with TradingView’s audience expectations for actionable trading insights.

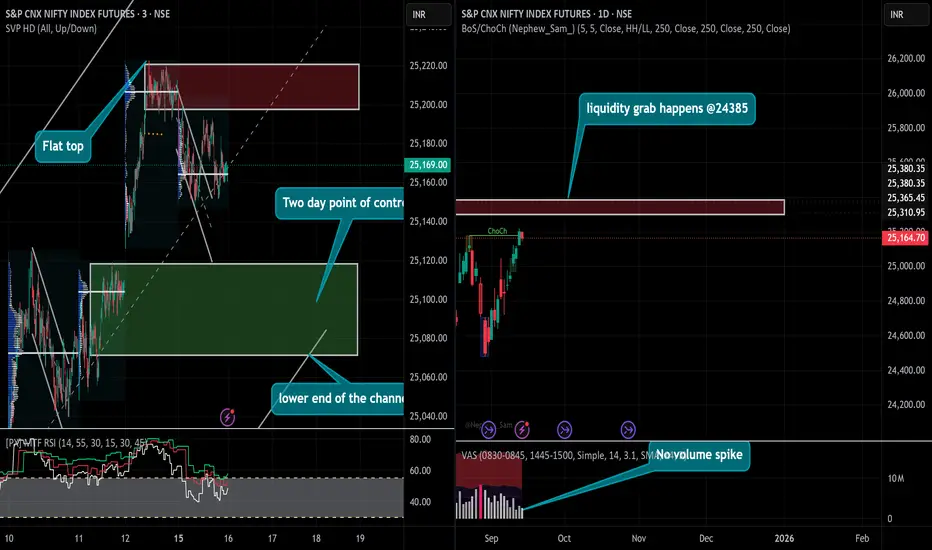
"Can we go long"???? why not????# 📊 NIFTY50 Daily Chart Analysis: Bearish Engulfing Pattern
## 🔍 Pattern Identification
**Bearish Engulfing Pattern** spotted on NIFTY50 daily chart - but let's dive deeper into the probability matrix!
## 📈 Statistical Edge
- **Standard Success Rate**: 70-72% with proper volume/RSI confirmation
- **Current Scenario**: Reduced to **60-65%** due to:
- ❌ Missing volume confirmation
- 📊 Sideways trend (25,000-25,150 range)
## 🎯 Key Technical Observations
### Volume Profile Analysis
- **Flat top** formation observed
- **No profit-taking volume spike** = Pattern appears incomplete
- Volume confirmation missing for bearish follow-through
### Critical Support/Resistance Zones
- **2-Day POC Control Zone**: 25,070-25,100
- **Current Position**: Lower end of uptrending channel
- **Range-bound action**: 25,000-25,150
## 🟢 The Bullish Case
**Why bears might struggle here:**
- Trading at channel support
- Volume profile suggests incomplete distribution
- POC control zone acting as strong support
## 💡 Trading Strategy
**Green Zone Buying Opportunity**: 25,070-25,100
- ⚠️ **Expiry Day Caution**: Reduced position sizing recommended
- 🎯 Risk/Reward favors buyers at these levels
- 📊 Channel support provides structural backing
## 🔔 Risk Management
- Given expiry volatility, manage position size carefully
- Watch for volume confirmation on any directional move
- Key level to watch: Break of 25,070 could accelerate downside
**#NIFTY50 #TechnicalAnalysis #BearishEngulfing #VolumeProfile #TradingStrategy #ExpiryDay**
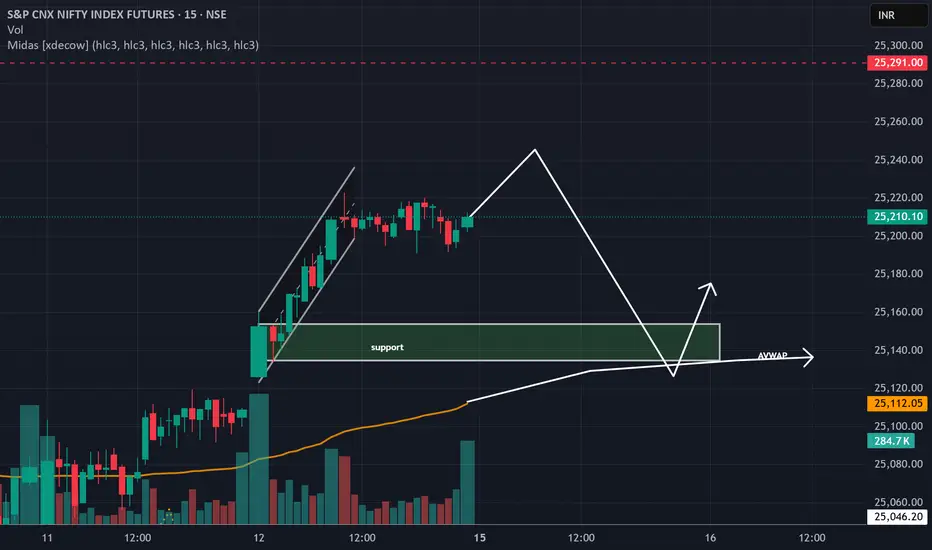
"Monday setup; Why Nifty may revisit 25120 zone"## 🎯 **Trading Scenario**
**IF** Nifty opens green on Monday and stays green until 10:40 AM:
### 📋 **Key Conditions to Watch:**
- ✅ Green opening sustained till 10:40 AM
- ❌ 25200 CE high of ₹60 should NOT be breached
- 📉 25200 CE price falls below ₹35 zone
### 🎯 **Expected Target:**
**Channel Low: 25120-25100 zone**
---
## 🔍 **Rationale**
### 📈 **Friday's Breakout Analysis:**
- Friday's breakout occurred within a **channel pattern**
- Movement lacked **sharp, strong candles**
- Breakout appeared more corrective than impulsive
### 📊 **Technical Logic:**
- Most channel breakouts **require retests** of their base
- Without proper follow-through, channels tend to **revert to support**
- Current price action suggests **lack of conviction** in the breakout
---
## ⚠️ **Risk Management**
### 🛑 **View NEGATED if:**
- Nifty's 10:40 AM high gets **decisively breached**
- Strong follow-through above breakout levels
- Sustained buying pressure throughout the session
### 💡 **Trading Tips:**
- Wait for confirmation signals before entry
- Watch option premiums for confirmation
- Keep strict stop-loss above 10:40 AM high
---
## 📝 **Summary**
This is a **channel retest play** based on Friday's weak breakout. The setup offers a favorable risk-reward if conditions align. Remember to wait for proper confirmation before taking positions.
**⚡ Trade Safe | Manage Risk | Follow Your Plan ⚡**
---
*Disclaimer: This is for educational purposes only. Please do your own analysis before trading.*
Physiology of Trading in the AI Era1. Human Physiology and Trading: The Foundations
1.1 Stress and the Fight-or-Flight Response
When humans trade, they are not just using rational logic; they are also battling their physiological responses. Every trade triggers an emotional and bodily reaction. For example:
Adrenaline release when markets move rapidly in one’s favor or against them.
Increased heart rate and blood pressure during volatile sessions.
Sweating palms and muscle tension as risk builds.
This “fight-or-flight” response, mediated by the sympathetic nervous system, has been part of human survival for millennia. In trading, however, it can impair rational decision-making. A surge of cortisol (the stress hormone) may lead to panic selling, hesitation, or impulsive buying.
1.2 Dopamine and Reward Pathways
Trading can be addictive. Each win activates dopamine in the brain’s reward circuitry, similar to gambling or gaming. Traders often “chase” that feeling, even when logic dictates restraint. Losses, on the other hand, trigger stress chemicals, leading to cycles of overtrading, revenge trading, or withdrawal.
1.3 Cognitive Load and Fatigue
Traditional trading involves constant information processing—charts, news, market data, risk assessments. This consumes enormous cognitive energy. Long sessions can lead to decision fatigue, reducing accuracy and discipline.
Thus, before AI, trading was fundamentally a battle of human physiology against the demands of complex markets.
2. The AI Disruption in Trading
2.1 Rise of Algorithmic and High-Frequency Trading (HFT)
AI-driven systems can execute thousands of trades per second, scan global markets, detect patterns invisible to humans, and adjust strategies in real-time. These machines do not suffer from fear, greed, or fatigue.
For human physiology, this means:
Reduced direct execution stress (since machines handle it).
Increased monitoring stress (humans must supervise systems).
Psychological dislocation (traders may feel less control).
2.2 Machine Learning in Decision Support
AI models analyze sentiment from social media, evaluate economic indicators, and forecast price moves. Instead of staring at multiple screens, traders increasingly interpret AI dashboards and signals. This shifts the physiological strain from reaction-based stress to interpretation-based stress.
2.3 Automation and Human Role Redefinition
In the AI era, humans are less about execution and more about strategy, oversight, and risk management. Physiology adapts to:
Lower manual workload.
Higher demand for sustained attention.
Possible under-stimulation leading to boredom and disengagement.
3. Physiological Challenges of Trading with AI
3.1 Stress of Oversight
Even though AI reduces execution stress, it creates new types of anxiety:
“What if the algorithm fails?”
“What if there is a flash crash?”
“What if my model is outdated?”
This “meta-stress” is often harder to manage because the trader is not directly in control. Cortisol levels may remain high over long periods, contributing to chronic stress.
3.2 Cognitive Overload from Complexity
AI outputs are highly complex—probability charts, heatmaps, predictive models. Interpreting them requires intense concentration, taxing the prefrontal cortex (responsible for logic and planning). Prolonged exposure leads to cognitive fatigue, headaches, and reduced analytical clarity.
3.3 Screen Time and Physical Health
AI-based trading often demands sitting for long hours in front of multiple screens. This leads to:
Eye strain (computer vision syndrome).
Poor posture and musculoskeletal stress.
Reduced physical activity, increasing long-term health risks.
3.4 Emotional Detachment vs Overreliance
Some traders experience emotional detachment because AI reduces the “thrill” of trading. Others, however, become overly reliant, experiencing anxiety when AI signals conflict with personal judgment. Both conditions alter physiological balance—either numbing dopamine pathways or overstimulating stress responses.
4. Positive Physiological Impacts of AI in Trading
4.1 Reduced Acute Stress
Since AI handles rapid execution, traders are spared the intense “fight-or-flight” responses of old floor trading. Heart rate variability (HRV) studies show that algorithmic traders often experience lower peak stress events compared to manual traders.
4.2 Better Sleep and Recovery (Potentially)
If managed well, AI systems allow for reduced night sessions and improved rest. However, this is true only when traders trust their systems.
4.3 Cognitive Augmentation
By filtering noise and providing data-driven insights, AI reduces raw information overload. Traders can focus on strategic thinking, which may be less physiologically taxing than high-speed execution.
5. Neurophysiology of Human-AI Interaction
5.1 Brain Plasticity and Adaptation
Just as the brain adapted to calculators and computers, it is adapting to AI in trading. Neural pathways reorganize to prioritize pattern recognition, probabilistic thinking, and machine-interpretation skills.
5.2 The Stress of Uncertainty
The human brain dislikes uncertainty. AI, by nature, operates probabilistically (e.g., “there is a 70% chance of price rise”). This constant probabilistic feedback keeps traders in a state of anticipatory stress, leading to sustained low-level cortisol release.
5.3 Trust and the Oxytocin Factor
Neuroscience shows that trust is mediated by oxytocin. When traders trust their AI systems, oxytocin reduces stress. But if trust breaks (due to errors or losses), physiological stress spikes significantly higher than in traditional trading.
6. The Future of Trading Physiology in the AI Era
6.1 Neural Interfaces and Brain-Computer Trading
As AI advances, direct brain-computer interfaces may allow traders to interact without keyboards or screens. This will blur the line between human physiology and machine execution.
6.2 AI as Physiological Regulator
AI could not only trade but also monitor the trader’s physiological state—detecting stress, suggesting breaks, or even auto-reducing risk exposure when cortisol levels spike.
6.3 From Physiology to Philosophy
Ultimately, the AI era forces us to ask: What is the role of human physiology in a world where machines outperform us? Perhaps the answer lies not in competing, but in complementing—using uniquely human traits while allowing AI to handle mechanical execution.
Conclusion
The physiology of trading in the AI era is a fascinating intersection of biology and technology. Human bodies, wired for survival in primal environments, now face markets dominated by machines that never fatigue or feel fear. While AI reduces some physiological burdens—like execution stress—it introduces new forms of stress, such as oversight anxiety, cognitive overload, and emotional detachment.
The challenge for modern traders is not to resist AI but to manage their physiology in harmony with it. By using mindfulness, ergonomic design, physical health practices, and new neuro-adaptive tools, traders can maintain resilience.
In the long run, the physiology of trading will evolve. The human brain adapts, neural pathways shift, and AI itself may become an ally in regulating our stress. Trading in the AI era is no longer just about markets—it is about the integration of human physiology with machine intelligence.

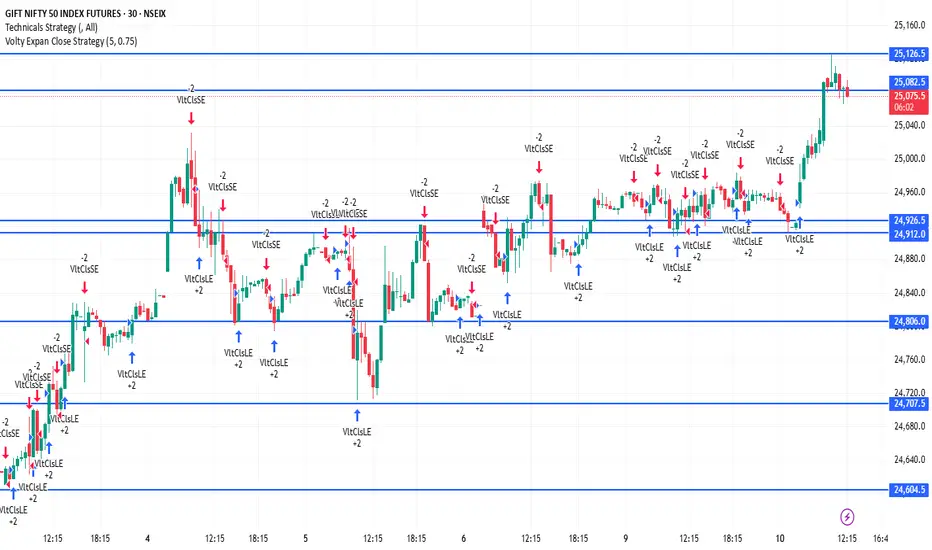
NIFTY1! 30Minutes Time frame📊 NIFTY1! – 30-Minute Timeframe (Current)
Current Price Zone: Approximately 25,092
🔻 Support Levels:
25,060 – Immediate support
25,020 – Stronger support zone
24,980 – Major support; breakdown here may lead to further weakness
🔺 Resistance Levels:
25,130 – Immediate resistance
25,180 – Strong resistance zone
25,220 – Major resistance; breakout above this level may signal bullish momentum
📈 Intraday Trend Outlook
Above 25,130: Bullish momentum likely; potential upside toward 25,180–25,220.
Between 25,060 – 25,130: Neutral to slightly bullish consolidation zone.
Below 25,060: Weakness may develop; potential slide toward 25,020–24,980.
NIFTY1!📍 NIFTY1! – 1H Key Levels
🔹 Support Zones
22,450 – 22,500 → Immediate intraday support
22,350 – 22,400 → Stronger support, buyers likely active here
22,200 – 22,250 → Major support zone, breakdown can invite selling pressure
🔹 Resistance Zones
22,650 – 22,700 → Immediate resistance on 1H chart
22,800 – 22,850 → Strong resistance area, breakout may fuel rally
23,000 → Psychological and major resistance zone
⚖️ Quick Summary
Above 22,700, momentum may push Nifty Futures towards 22,850 – 23,000.
Below 22,450, weakness could drag price back to 22,350 – 22,200.
Current 1H trend bias is mildly bullish, but range-bound moves are possible between 22,450 – 22,700 before a breakout.