Types of Market ParticipantsIntroduction
Financial markets are vast ecosystems where millions of transactions take place daily, involving buyers, sellers, intermediaries, regulators, and institutions. Each participant plays a unique role, and together, they form the lifeblood of the global economy. Just like any well-functioning system, financial markets rely on a diverse group of actors whose motives range from profit-making, hedging risks, raising capital, or ensuring stability and liquidity.
In simple terms, market participants are all the individuals, institutions, and entities that engage in trading financial instruments—stocks, bonds, derivatives, currencies, commodities, and more. Their presence ensures that markets remain liquid, efficient, and capable of transmitting signals about economic health.
Understanding the types of market participants is essential for traders, investors, policymakers, and students of finance. Different participants bring different motivations and strategies: while some seek long-term value, others look for short-term profits; while some provide regulation and order, others bring in liquidity. This dynamic interaction creates both opportunities and risks in markets.
This article provides a comprehensive exploration of the various types of market participants, categorized based on their roles, objectives, and influence.
Broad Categories of Market Participants
Before diving deep, let’s break down the broad categories:
Individual Investors / Retail Participants
Institutional Investors
Market Intermediaries (Brokers, Dealers, Exchanges, etc.)
Hedgers and Arbitrageurs
Speculators and Traders
Regulators and Policymakers
Issuers (Corporates and Governments)
Foreign Investors and Global Participants
High-Frequency Traders and Algorithmic Players
Market Makers and Liquidity Providers
Now, let’s discuss each in detail.
1. Individual Investors (Retail Participants)
Retail investors are individuals investing their personal funds in financial markets. They usually trade smaller amounts compared to institutions, but collectively they represent a massive pool of capital.
Characteristics of Retail Investors:
Use their own money (not pooled funds).
Investment horizon varies (short-term, medium-term, long-term).
Motivated by wealth creation, savings growth, retirement planning.
Increasingly influenced by technology (mobile apps, online trading platforms).
Types of Retail Investors:
Active traders: Regularly buy and sell securities for quick gains.
Passive investors: Prefer long-term investments like index funds or mutual funds.
Speculative retail investors: Engage in options, futures, and cryptocurrencies.
Role in the Market:
Retail investors enhance liquidity, provide diversity of opinion, and influence sentiment-driven movements. However, they are often more vulnerable to volatility and herd behavior.
2. Institutional Investors
Institutional investors are large organizations that invest on behalf of others. They have access to substantial capital, advanced research, and professional expertise.
Types of Institutional Investors:
Mutual Funds: Pool money from many investors to invest in diversified portfolios.
Pension Funds: Manage retirement savings and invest for long-term returns.
Insurance Companies: Invest premiums collected from policyholders to earn returns.
Sovereign Wealth Funds (SWFs): State-owned funds that invest national reserves.
Endowments and Foundations: Manage funds for universities, NGOs, and charities.
Characteristics:
Hold significant influence over markets.
Long-term investment horizon, though some engage in active trading.
Often considered more stable than retail investors.
Role in the Market:
Institutional investors are stabilizers of financial markets due to their deep pockets and diversified holdings. However, their concentrated moves can create big shifts in asset prices.
3. Market Intermediaries
Market intermediaries are the connectors that facilitate transactions. Without them, buyers and sellers would struggle to find each other efficiently.
Types of Intermediaries:
Stockbrokers: Act as agents executing trades on behalf of clients.
Dealers: Trade securities for their own accounts and provide liquidity.
Exchanges: Platforms like NSE, BSE, NYSE, NASDAQ, which match buyers and sellers.
Clearinghouses: Ensure settlement of trades and manage counterparty risk.
Depositories: Safekeep securities in electronic form (e.g., NSDL, CDSL in India).
Investment Banks: Help companies raise capital via IPOs, debt issues, mergers, and acquisitions.
Role in the Market:
Intermediaries ensure market efficiency, transparency, and liquidity. They are essential in maintaining trust and smooth functioning.
4. Hedgers
Hedgers are participants who enter markets primarily to reduce risk exposure. They are not focused on profit-making from price changes but on safeguarding their core business or portfolio.
Examples:
A farmer using futures contracts to lock in crop prices.
An airline hedging against fuel price volatility.
An investor using options to protect a stock portfolio from downturns.
Role in the Market:
Hedgers bring stability by offsetting risks. Their activity increases demand for derivative instruments and makes markets more complete.
5. Speculators and Traders
Speculators take on risk in pursuit of profit. Unlike hedgers, they actively seek to benefit from price fluctuations.
Types of Traders:
Day Traders: Buy and sell securities within the same day.
Swing Traders: Hold positions for days/weeks to capture short-term trends.
Position Traders: Hold longer-term bets based on fundamental analysis.
Options/Futures Traders: Engage in derivatives for leverage and profit opportunities.
Role in the Market:
Speculators add liquidity and price discovery. They take risks that others (hedgers) want to avoid. However, excessive speculation can increase volatility.
6. Arbitrageurs
Arbitrageurs exploit price differences of the same asset in different markets.
Examples:
Buying a stock on NSE while simultaneously selling it on BSE if there’s a price gap.
Using currency arbitrage in Forex markets.
Exploiting futures-spot price differences.
Role in the Market:
Arbitrageurs eliminate pricing inefficiencies, keeping markets aligned and fair. They are critical to maintaining balance.
7. Regulators and Policymakers
Markets cannot function smoothly without oversight. Regulators set the rules, monitor activities, and prevent malpractice.
Examples:
SEBI (India): Securities and Exchange Board of India.
SEC (USA): Securities and Exchange Commission.
RBI (India): Regulates currency and banking markets.
CFTC (USA): Commodity Futures Trading Commission.
Roles of Regulators:
Protect investors.
Ensure transparency and fair play.
Prevent frauds, insider trading, and market manipulation.
Stabilize markets during crises.
8. Issuers (Corporates and Governments)
Issuers are entities that raise capital from markets by issuing securities.
Types:
Corporates: Issue equity (shares) or debt (bonds, debentures) to fund growth.
Governments: Issue bonds and treasury bills to finance expenditure.
Municipalities: Issue municipal bonds for infrastructure projects.
Role in the Market:
Issuers are the suppliers of investment products. Without them, there would be nothing to trade.
9. Foreign Investors and Global Participants
Globalization has turned local markets into international ones.
Types:
Foreign Institutional Investors (FIIs): Large funds investing in emerging markets.
Foreign Portfolio Investors (FPIs): Individuals or institutions buying foreign stocks/bonds.
Multinational Corporations: Investing cross-border for expansion.
Role:
Foreign investors bring in capital, liquidity, and global integration, but also add volatility when they withdraw funds during crises.
10. High-Frequency Traders (HFTs) and Algorithmic Participants
With technology, machines are now major participants.
Characteristics:
Use algorithms and superfast systems.
Trade thousands of times in milliseconds.
Seek to exploit micro-price differences.
Role:
HFTs improve liquidity and tighten bid-ask spreads but raise concerns about flash crashes and systemic risks.
Conclusion
The financial market is not just about numbers and charts—it is about participants with diverse objectives interacting to create opportunities, manage risks, and allocate resources. From retail investors saving for retirement to sovereign wealth funds shaping national strategies, from hedgers protecting against volatility to high-frequency traders running algorithms at lightning speed—each plays a vital role.
A proper understanding of types of market participants gives clarity about how markets work, why they move the way they do, and how risks and rewards are distributed. Just like a symphony requires different instruments, financial markets require this variety of participants to function harmoniously.
NIFTYX2020 trade ideas
Hammer Candlestick Reversals - Bullish & Bearish Setups🔹 Intro / Overview
In this idea, we focus on the Hammer candlestick pattern — both Bullish and Bearish variations.
The Hammer is a powerful reversal signal formed with a small body, a long shadow, and defined highs/lows.
When combined with EMA High–Low Band Confirmation and swing structure, it creates rule-based trading opportunities with clear validation and devalidation rules.
---
📖 Bullish & Bearish Hammer Intro
🟢 Bullish Hammer → Appears after a downtrend / at swing low . Buyers step in strongly, rejecting lower prices.
- EMA Band should be above the candle.
- Candle High = Validation line.
- Candle Low = Devalidation line.
- Entry → Close above the High.
- Stop-Loss → Candle Low.
- Target → 1x risk, with remaining lots trailed (ATR, Fibonacci, Box Trailing).
🔴 Bearish Hammer → Appears after a uptrend / at swing high . Sellers take control after rejecting higher prices.
- EMA Band should be below the candle.
- Candle Low = Validation line.
- Candle High = Devalidation line.
- Entry → Close below the Low.
- Stop-Loss → Candle High.
- Target → 1x risk, with remaining lots trailed.
---
📌 How to Use
🟢 Bullish Hammer Spotted
- Validation → Close above the Hammer’s high.
- Devalidation → Close below the Hammer’s low. (before validation)
- SL → Hammer Low.
- Target → 1x risk, remaining lots trail with ATR/Fibonacci.
🔴 Bearish Hammer Spotted
- Validation → Close below the Hammer’s low.
- Devalidation → Close above the Hammer’s high. (before validation)
- SL → Hammer High.
- Target → 1x risk, remaining lots trail with ATR/Fibonacci.
---
🎯 Trading Plan
- Entry → On validation close (Bullish above High, Bearish below Low).
- Stop Loss → Defined by Hammer candle (Low for Bullish, High for Bearish).
- Target → First TP = 1R, Remaining lots trailed for extended moves.
---
📊 Chart Explanation
1️⃣ 🟢 Bullish Hammer Spotted
- Candle validated as price closed above the high.
- 🎯 Target 1 achieved, remaining lots managed with trailing methods. Trailing Exit could be at swing top with best trailing
2️⃣ 🛑 Bearish Hammer →
- Candle validated as price closed below the low.
- 🎯 Target 1 achieved, remaining lots managed with trailing methods. Trailing Exit could be at swing bottom with best trailing
3️⃣ 🛑 Bearish Hammer →
- ❌ Devalidated
- Candle devalidated as price closed above the high.
4️⃣ 🛑 Bearish Hammer →
-Candle validated as price closed below the low.
⛔ Stop-Loss hit
- stop loss ensures risk management and discipline in trading.
5️⃣ 🛑Bearish Hammer →
-Candle validated as price closed above the low.
- 🎯 Target 1 achieved, remaining lots managed with trailing methods. Trailing Exit could be at swing bottom with best trailing
---
👀 Observation
- Bullish Hammer → Works best after prolonged downtrend at support zones.
- Bearish Hammer → Stronger after extended uptrends or near resistance zones.
- EMA Band → Confirms market bias and filters false signals.
- Risk Management → Defined SL + structured TP protect capital and maximize reward.
---
❗ Why It Matters?
- Clear rules: Validation, Devalidation, Entry, SL, and TP.
- Combines price action (Hammer) with EMA Band confirmation.
- Ensures disciplined trading instead of emotional decisions.
- Allows both conservative and aggressive management via trailing.
---
🎯 Conclusion
The Bullish & Bearish Hammer patterns, when combined with EMA High–Low Band confirmation, provide a structured reversal trading strategy.
By following strict entry, SL, and TP rules, traders can filter false setups and capture strong reversals at swing highs and lows.
🔥 Patterns don’t predict. Rules protect. 🚀
---
⚠️ Disclaimer
For educational purposes only · Not SEBI registered · Not a buy/sell recommendation · Not financial advice — purely a learning resource.

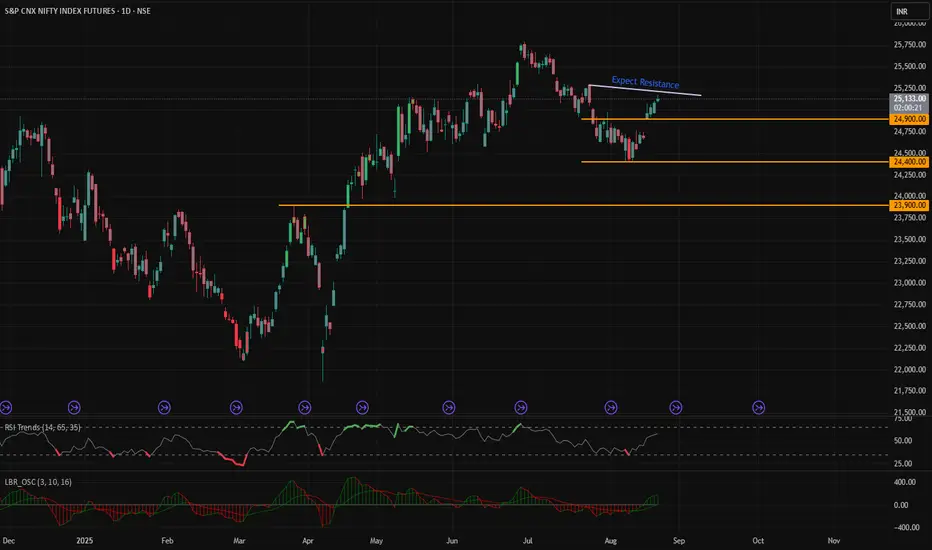
S&P CNX Nifty Index Futures 1 Week View1. Technical Levels — Weekly Pivot Points & Fibonacci Zones
Thanks to TopStockResearch, here are the key pivot-derived levels for the weekly timeframe:
Standard Weekly Pivots:
Support 2 (S2): ~24,213.80
Support 1 (S1): ~24,000.80
Pivot (Central): ~24,830.70
Resistance 1 (R1): ~25,234.60
Resistance 2 (R2): ~25,447.60
Fibonacci Weekly Levels:
S2: ~24,236.46
Pivot: ~24,617.70
R1: ~24,853.36
R2: ~24,998.94
R3: ~25,234.60
Summary of horizontal price zones (support / resistance):
Support zones: 24,000 – 24,213
Pivot zone: 24,617 – 24,830
Resistance zones: 24,853 – 25,447
Additional Important Levels from Analysts & Market Reports
Consumers, Tariffs & Volatility
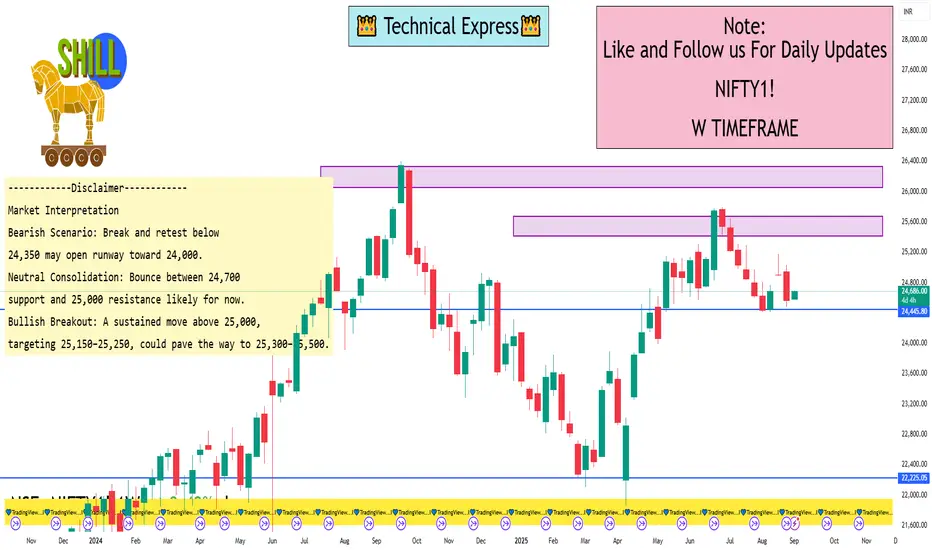
Analysts warn that a breakdown below 24,350 may trigger more selling pressure.
Previous Week’s Support
As of late August 2025, 24,250 has been identified as a critical support level.
Strong Support Around 24,700
Analysts indicated that there’s robust support near 24,700. A breakout above 25,150 could pave the way toward 25,300–25,500, while a dip below 24,800 might drag the index down to around 24,600.
Expected Trading Range
Market experts suggest that in the near term, the Nifty may oscillate between 24,200 and 24,800, with the 200-day exponential moving average (DEMA) acting as support around 24,200.
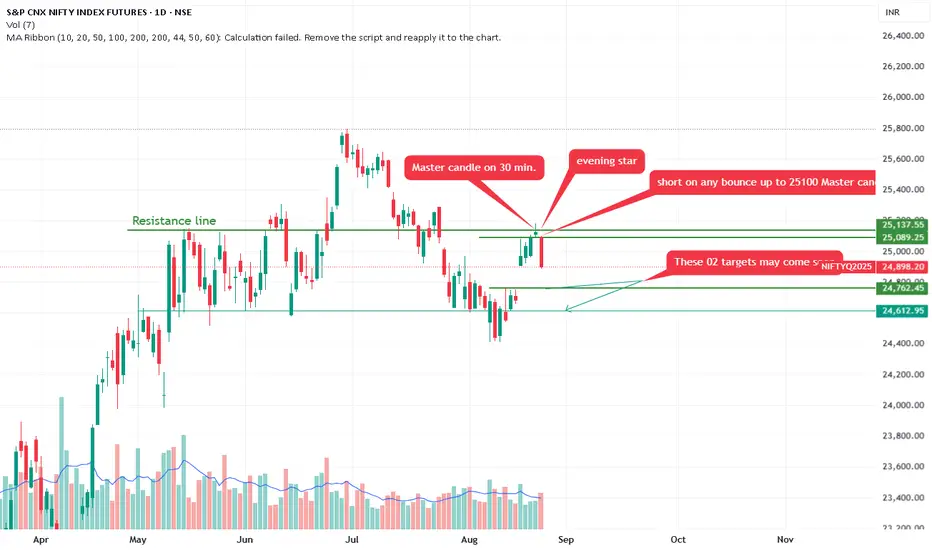
Nifty form Bearish Evening star. Correction expected.Annotations Patterns:
Master Candle on 30 min. Evening Star: Points to the recent high. A "master candle" refers to a large-range candle (here, likely on a 30-minute timeframe) that encompasses subsequent smaller candles, Combined with an "evening star" pattern—a three-candle bearish reversal (large green candle, small-bodied doji/star, followed by a large red candle closing below the first's midpoint)—this suggests a topping formation and potential for further downside.
Short on Any Bounce Up to 25,000-25,100 Master Candle Low.
Recommends selling (shorting) if price rebounds to 25,000-25,100 (labeled as the master candle's low, acting as resistance on pullback).
These 02 Targets May Come Soon: Arrows to lower levels (~24,793 and possibly 24,613), implying quick downside targets.
A downward-sloping green trendline projects further decline.
Overall Trend: The chart depicts a bull market correction or potential reversal. After months of gains, momentum has shifted bearish, with price breaking below key supports (e.g., the green line at 25,137). Higher volume on declines reinforces this.
The chart's creator appears to have a bearish bias, focusing on reversal patterns and downside projections.
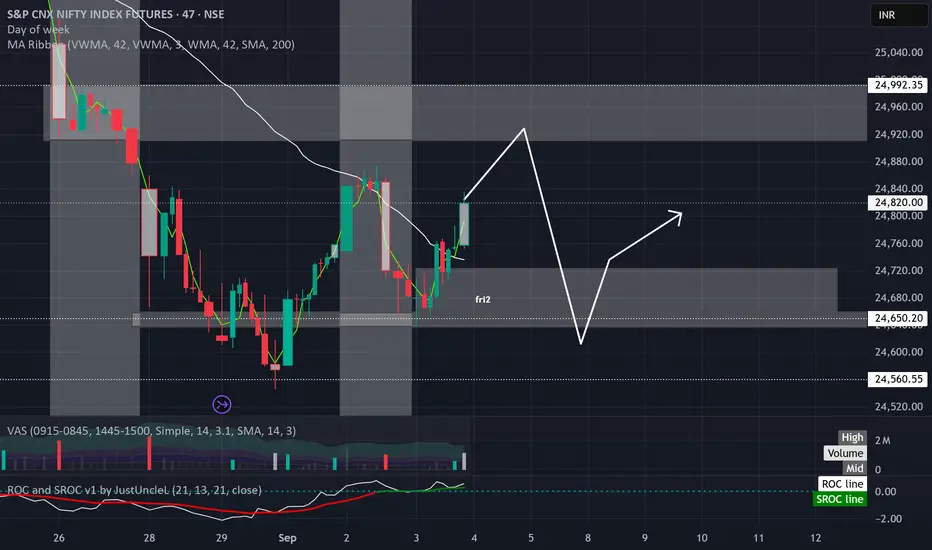
Big consolidation ahead in septemberNIFTY has been moving in a bullish channel until 25906 top made on June 30th.There was no major rejection or any reversal pattern ,from there NIFTY has been falling again in a down sloping channel. Usually channels tops and bottoms are retested. On 8th august NIFTY made a low of 24400 and from there it has recovered sharply to 25180.So we can confidently say that the corrective bear channel is over. Now we are seeing a minor pullback from 25180 to the gap level of 24800. so if the hypothesis is right we might get a bounce again. Target level can be high of the channel 25900 and little 200 points above that. When big channel ends then it might trade flat in the range of channel. So all n all next two months going to be very exciting. Buy the nifty if it comes 24800 with a 200 point stop at 24600 and hold tight until 26200.

Bulls trying to hold 24540, 24400 strong supportNifty still trying to hold 24540. 24400 is a strong support on weekly and monthy TF.
The probability of turnaround from these levels is possible.
Break of 24400 on the downside can be considered to be bearish in the short term.

"Baby I Got You"
**🎭 Dear NIFTY, Playing the Same Old Tricks Again? We See You! 👀**
**The Classic NIFTY Playbook - Chapter 247:**
Oh look, NIFTY's at it again with the good old reliable scam! 🙄
**The Setup (We've Seen This Movie Before):**
• Creates "strong support" at 24,640 - because why not give retail hope?
• Everyone and their uncle goes long with stops at 24,600 (how original!)
• 24600 CE: "I shall never cross 250, peasants!"
• 24700 CE: "150? That's my ceiling, don't even think about it!"
• 24600 Straddle: "270 is lava, I will not touch it!"
**The Drama Unfolds:**
1. **The Fake-out**: Runs to 24,900 screaming "I'M GOING TO THE MOON!" 🚀
2. **The Reality Check**: "Just kidding! Time to hunt some stops at 24,600!" 🎯
3. **The Grand Finale**: Closes exactly where it wants - in that sweet 24,600 straddle range 🎪
**Dear NIFTY,** we know your game. You're like that friend who always orders the same dish at every restaurant. Predictable much?
**Moral of the Story:** Stop falling for the same trap, people! NIFTY's got more tricks than a street magician, but they're all the same trick! 🎩✨
---
**Who else is tired of this weekly soap opera?
Monday's are notorious for swing lows and highs.
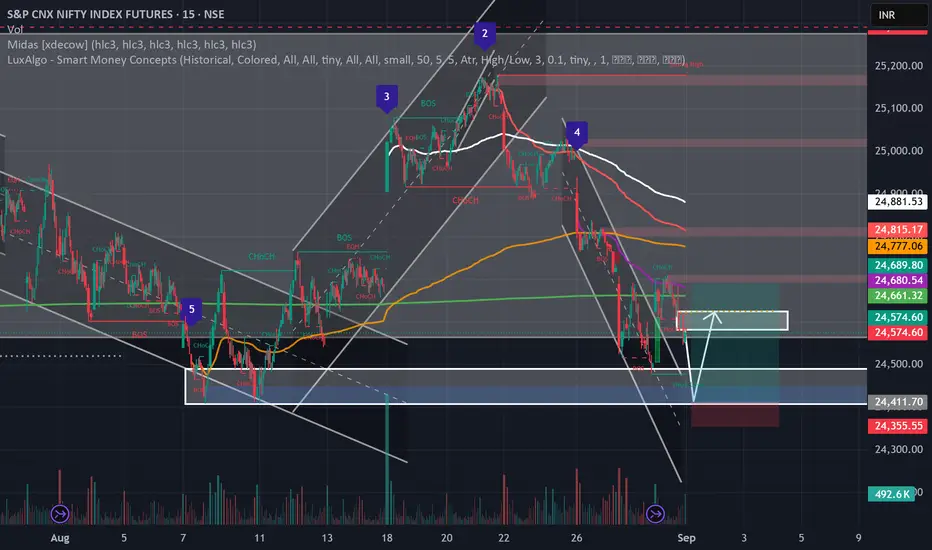
**📊 NIFTY FUTURES - Potential Bounce Setup from Key Confluence Zone**
**Key Technical Setup:**
• Long-term AVWAP anchored at 21,900 has turned flat, indicating equilibrium
• Multiple selling AVWAPs (red, white, yellow) are converging, suggesting exhaustion of selling pressure
• Market trading within broad consolidation range of 24,000 - 26,000
• Currently positioned at the lower end of this flat zone
**Critical Support Zone: 24,400 - 24,450**
• Strong order block identified in this zone
• Multiple technical confluences align at these levels
**Monday Market Dynamics:**
Mondays historically tend to create swing lows/highs, adding seasonal bias to our technical setup.
**Trade Strategy:**
🎯 **Long Setup:** Look for longs if market tests 24,400 zone and shows recovery
⏰ **Timing:** First hour often sees the low being tested with immediate recovery
🚨 **Risk Management:** Avoid getting trapped on the downside Monday morning
**Market Outlook:**
With selling pressure converging and key support holding, expecting potential bounce during the week. The confluence of technical levels, order flow, and seasonal patterns suggests a higher probability setup for upside participation.
**⚠️ Trade Plan:** Don't chase the downside - wait for the bounce setup to materialize.
---
*What are your thoughts on this confluence setup? Drop your views in the comments!*
Part 2 Trading Master ClassTypes of Options
There are only two main types of options:
(A) Call Option (Right to Buy)
A call option gives the buyer the right to buy the asset at a fixed price.
👉 Example:
Stock: Reliance is at ₹2,500 today.
You buy a Call Option at strike price ₹2,600, paying a premium of ₹50.
If Reliance goes to ₹2,700, you can buy at ₹2,600 (profit).
If Reliance stays below ₹2,600, your option expires worthless, and you lose the ₹50 premium.
(B) Put Option (Right to Sell)
A put option gives the buyer the right to sell the asset at a fixed price.
👉 Example:
Stock: Infosys is at ₹1,400.
You buy a Put Option at strike ₹1,350, paying premium ₹20.
If Infosys falls to ₹1,300, you can sell at ₹1,350 (profit).
If Infosys stays above ₹1,350, your option expires worthless, and you lose the ₹20 premium.
Why Trade Options?
Options are popular because they provide flexibility, leverage, and hedging.
1. Leverage (Small money, big exposure)
With just a small premium, you control a large quantity of shares.
Example: To buy 50 shares of Nifty (at 20,000), you need ₹10 lakhs. But an option may cost only ₹20,000 for the same exposure.
2. Hedging (Risk Protection)
Investors use options to protect portfolios. Example: If you hold Infosys shares, you can buy a Put Option to protect against price falls (like insurance).
3. Speculation (Profit from movement)
Traders use options to bet on price moves (up, down, or even staying flat).
4. Income (Option Writing)
Professional traders sell options to earn premiums regularly.

Nifty looks exhausted for upmove. Expecting downsideNifty is looking exhausted for up move, look to short at 25150 in future. For target of 24800. Keep SL 25300.
Rationale-
Macro picture of other charts look for a downside will be played. Nifty will not remain up if US and other market fall.
FII are not covering position even after positive news of GST cut.
+
Negative news if weekly expiry is gone.
so I don't see any positive triggers for now.
My ideas are thesis base, after which I see chart and take position.
So I have a view global markets are selling off, Indian market positive news are now discounted. And we now do not have any other positive trigger.
So I am selling at 25150. Trade active
nifty index future analysis with and with out b adjnifty index future analysis with and with out b adj

GIFT NIFTY: BULL OR BEAR @ 24689LTP: 24689
Nifty break of 24550/389, we can see big correction.
If these supports hold, we can see big reversal.
Break of 24389, we can see 23770-23440.
Bulls need a break of 25200 for 26K+
Watch levels: 24550-389.


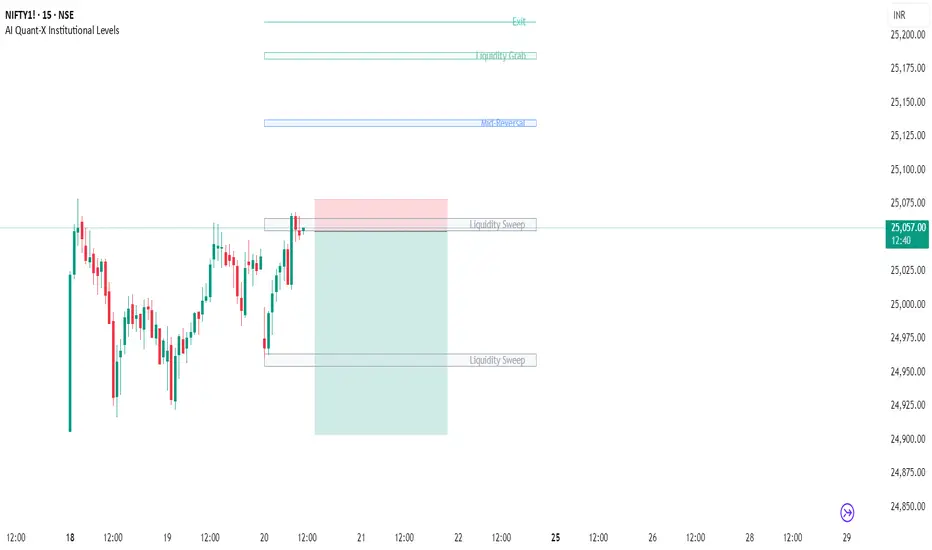
Nifty can be soldNifty is taking rejection from liquidity sweep level . it can be sold for sl 24090 target 24950/ 24800
Nifty buy at 24700 SL 24550, Tgt 25000After making base of 3 days, giving false bearish candle, Nifty is again above 24600.
Expect positive geopolitical news from President Trump-Putin meet.
or
Positive news from 15 August speech by PM Modi on manufacturing boost.
Buy at 24700 SL 24550.
Expecting 25000, with gap up on Monday.

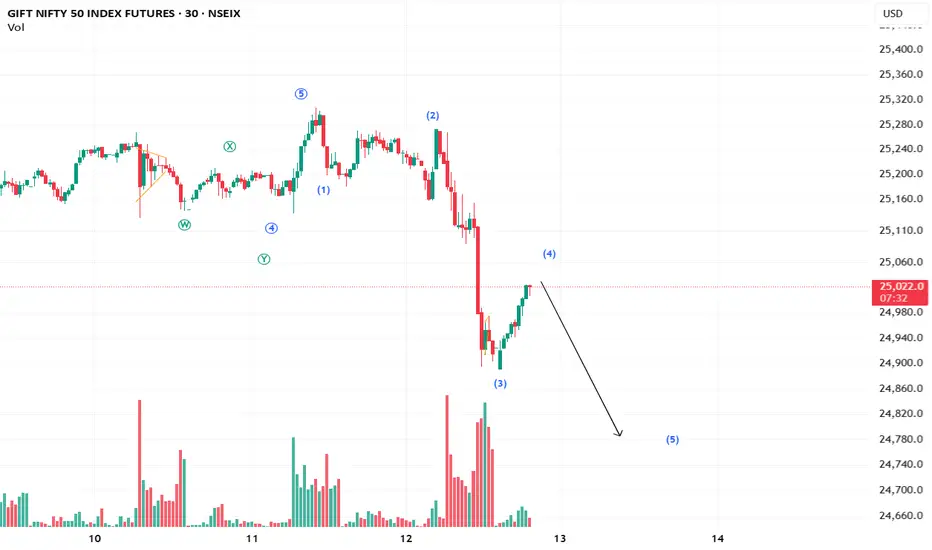
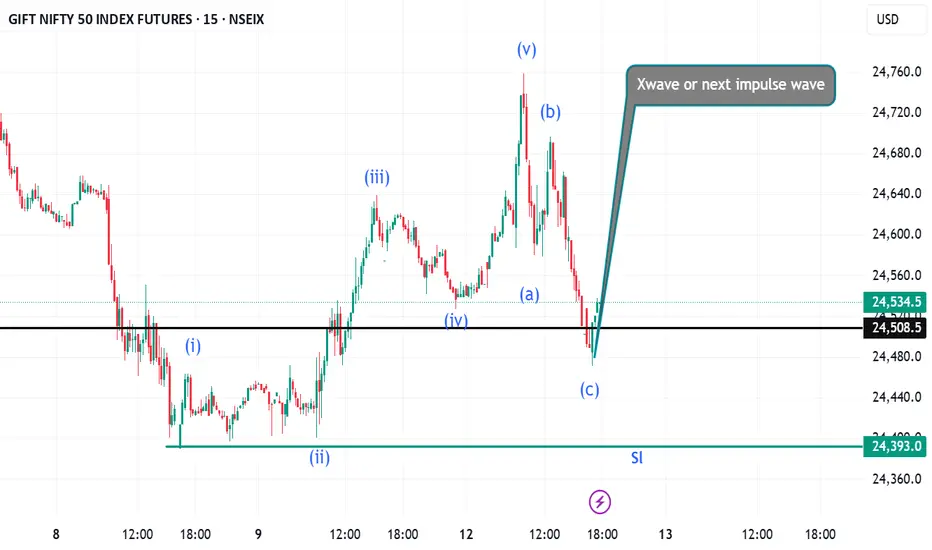
Gift Nifty Future 15 min time frame wave analysisGift nifty future 15 min chart wave analysis
In our nifty future chart a new piece has developed in a motive wave. This is the nature of impulse wave which has 5 waves. After that abc zigzag correction has happened. Therefore the next impulse wave anticipate. If a complex correction is formed then x wave will be formed.
Thank you
Disclaimer
I am not SEBI registered financial adviser, it is my personal research and posted for only educational purpose. Before taking any trade or investments please take advice from your financial adviser.
MKT Learner
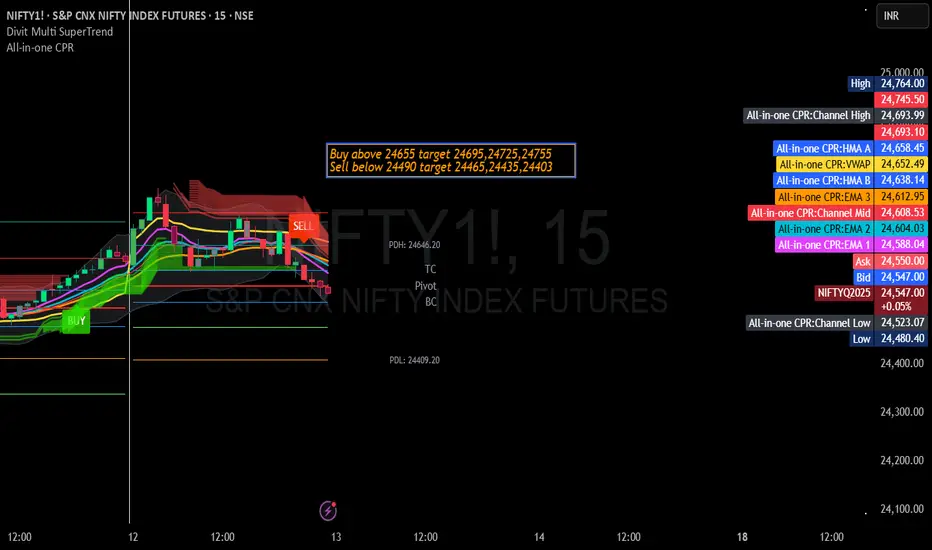
Nifty Trading Strategy for 13th August 2025📈 NIFTY – Intraday Trading Plan
✅ Buy Setup
Entry Trigger: Buy above the high of the 15-min candle if it closes above 24,655.
Example: If the 15-min candle closes at 24,660 and the next candle breaks 24,660, enter a buy.
Targets:
🎯 T1 – 24,695
🎯 T2 – 24,725
🎯 T3 – 24,755
❌ Sell Setup
Entry Trigger: Sell below the low of the 15-min candle if it closes below 24,490.
Example: If the 15-min candle closes at 24,485 and the next candle breaks 24,485, enter a sell.
Targets:
🎯 T1 – 24,465
🎯 T2 – 24,435
🎯 T3 – 24,403
⚠️ Disclaimer
📜 This is only for educational purposes. I am not SEBI registered. Please do your own research before taking any trade. The stock market involves risk, and you may lose your invested capital.
KEY LEVELS to watch out 24000 and 24400Price has broken below key support at 24,640, confirming weakness. Immediate support levels lie at 24,441 and 24,215, with deeper targets at 24,092 and 23,972. Resistance is now at 24,803, keeping the short-term bias bearish unless reclaimed.

Buy nifty from Trump climax negative news. at 24900 FutBuy nifty at 24900 for 25200 by 5th august.
Can go long with calls of 25100-25200. Or spread of 24900-25200. 7th august.
Market coming down since a month when all world market rise, so might go up on negative news climax.
Short term idea.

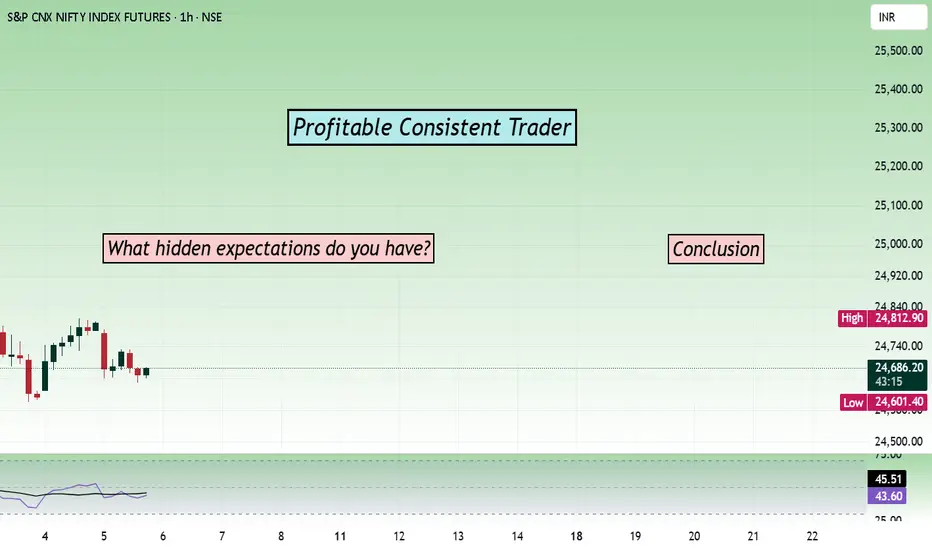
Profitable Consistent Trader - Concluding partOnce a novice trader becomes an experienced trader with knowledge, why is he still struggling in the trading market? With effective trading strategies, sound trade setups, and a solid understanding of technical indicators, he will trade with confidence. But why does he not have confidence?
I will explain two important factors here. The first one is the expectation of a holy grail strategy or trade setup. This type of expectation comes when a person is not ready to understand that 100% success trades are not possible. People who have this type of expectation will follow one strategy for some time, then switch to another one when they get a few losing trades. They spend their money, time, and energy in finding new strategies & testing them for some time before finding another new strategy.
The next factor is not having sufficient understanding of the strategy or trade setup. It makes a trader lose interest in his strategy once he encounters a few losing trades.
The solution to trade confidently lies in back testing. Usually, professional traders back-test their strategy at least for the past 4 years. This makes them understand how their strategy works in different market situations and to know the trading edge. Have you back-tested your strategy? If not, now is the time for back testing... I am concluding this series, The Profitable Consistent Trader, here. If you want to read such an article, comment below, and I will write about different topics every week.
Bearish pressure building at key support zoneNifty weekly support zone is 24630-24489.
Below this we have a gap zone.
Price behavior is currently Bearish on the support zone, hinting at break of support zone and eventual filling of the gap zone.

Support levels for todayThree key levels to watch for support (buy entry) today are 24,720, 24,670, and 24,630. The market may take support at any of these levels and potentially move upward to break the previous day’s high.

Another Sell on Rise in Making in NIFTY?GiftNifty is currently completing the Minuette Wave 4. We may see another move down on June 12th in NIFTY in the morning session. If not, we may see an A-B-C formation to the upside. Keeping the shorts ready?