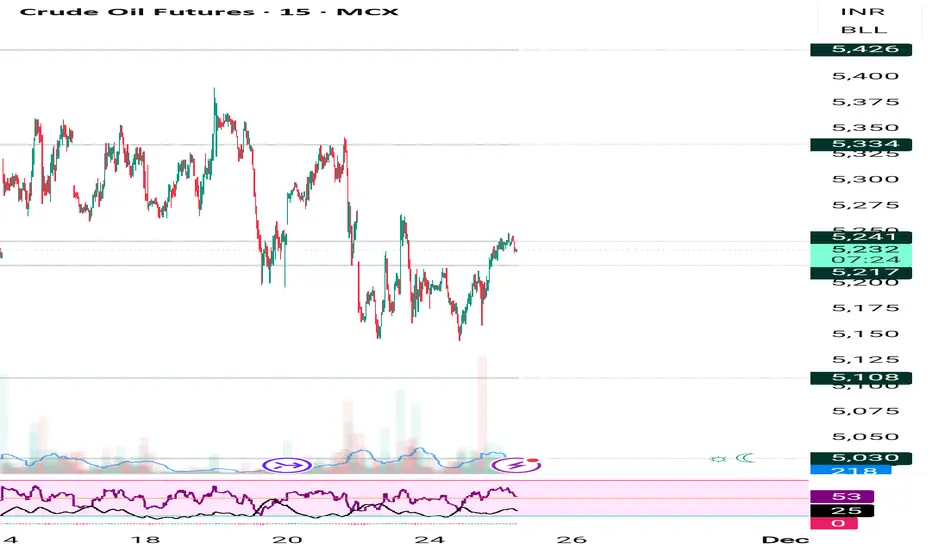
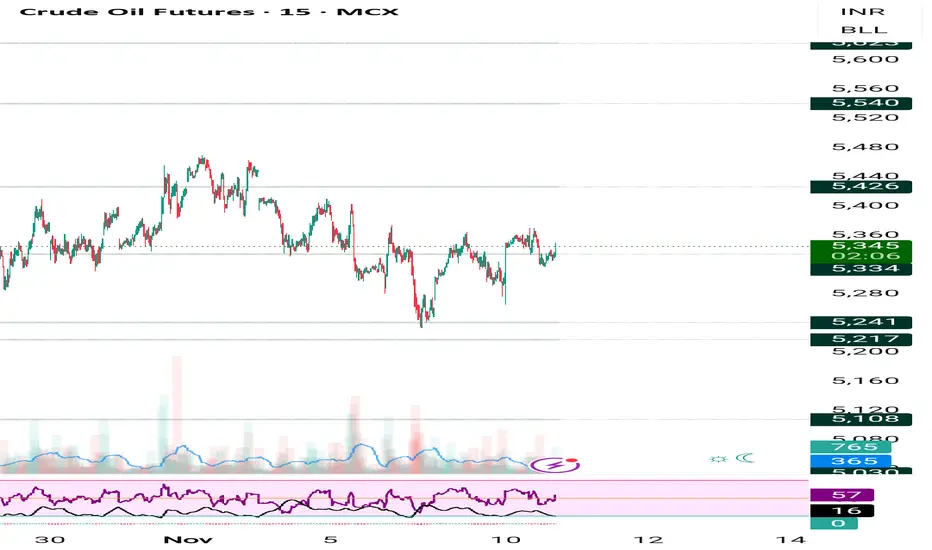
Crude mcx 5200-5260 range ,AI tool data attached in description Parameters Data
Asset Name Crude Oil MCX
Reason 🟨 Global oil market mein surplus supply ki umeed aur Russia-Ukraine peace deal ki speculations ke chalte minor pressure.
R:R 🟨 N/A (Range-bound) / Threshold: Breakout above - & Breakdown below
Current Trade 🟨 AVOID | R1: 5250.00, R2: 5280.00, R3:
Related commodities
WTI crude getting ready for 67$It has been a while preparing for this and the lower Bollinger band has moved up to 58.58 in the meantime as immediate support. The indication remains that wave c higher will unfold. I cannot determine right away if this is wave c or iii and that we can conclude later but one leg higher first is wha

Crude Oil Resistance Breakout – Retest & Buy OpportunityCrude Oil has broken above a key resistance zone, which had previously acted as a strong supply area multiple times. After the breakout, the price is now approaching the same zone for a potential retest.
If the retest holds as support and bullish candles appear, it can confirm buyer strength and pr

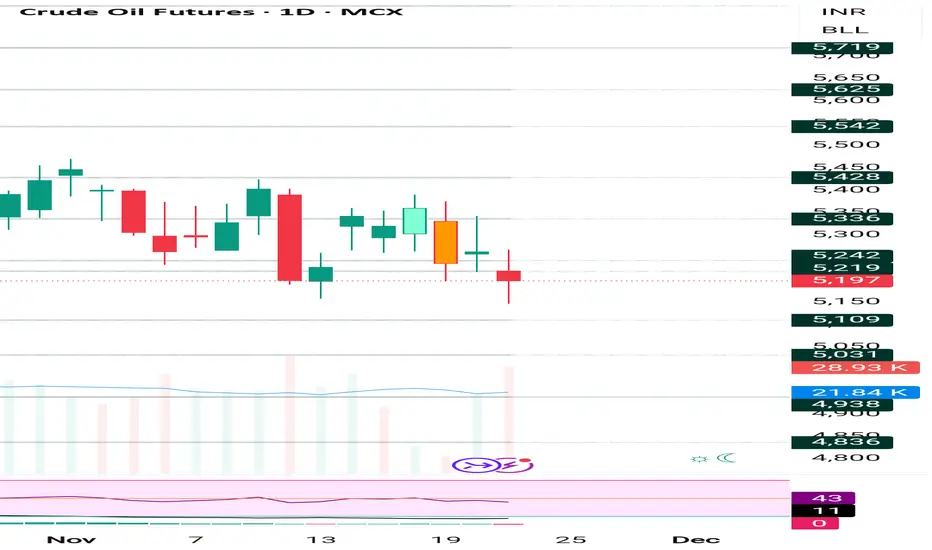
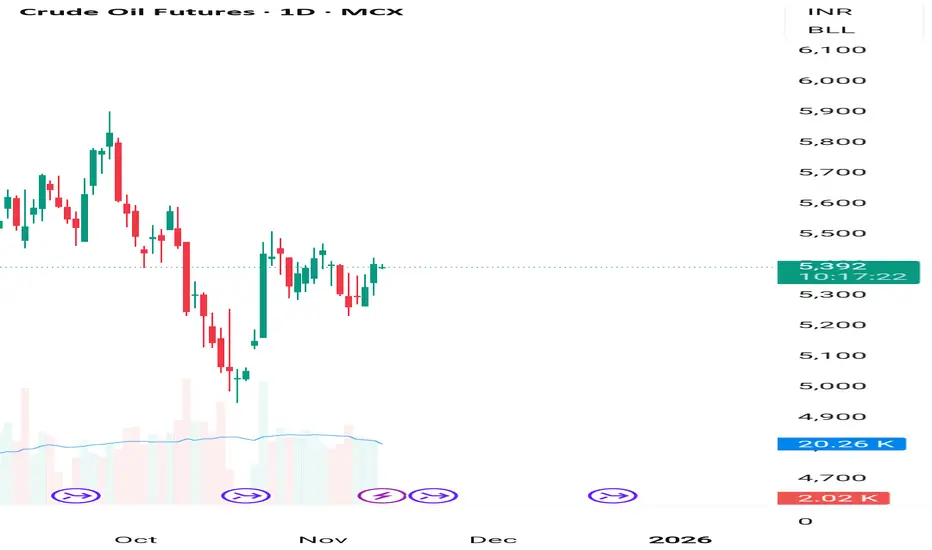
Crude MCX AI tool showing sideways till 5100 or 5280 not break Parameters Data
Asset Name : Price 🟥 Crude Oil MCX (Dec) : 5,188
Price Movement 🟨 Sideways will continue to 5,280, 5,350 if break 5,350 then breakout Until 5,100 not break if break then 5,030, 4,950 possible.
Reason 🟨 Demand Concerns vs. OPEC+ Cuts: Global demand ki chinta aur US inventories mei
Crude buy 250-280 points range buy on low sell on high 🔑 Key Highlights
- Price Action: Crude trading at ₹5,343, holding above ₹5,300 support.
- Trend: Active Long Build‑Up confirmed.
- Supports: ₹5,300 / ₹5,250 / ₹5,200.
- Resistances: ₹5,380 / ₹5,420 / ₹5,480.
- Bias: Bullish continuation if above ₹5,300; corrective pullback risk below ₹5,250.

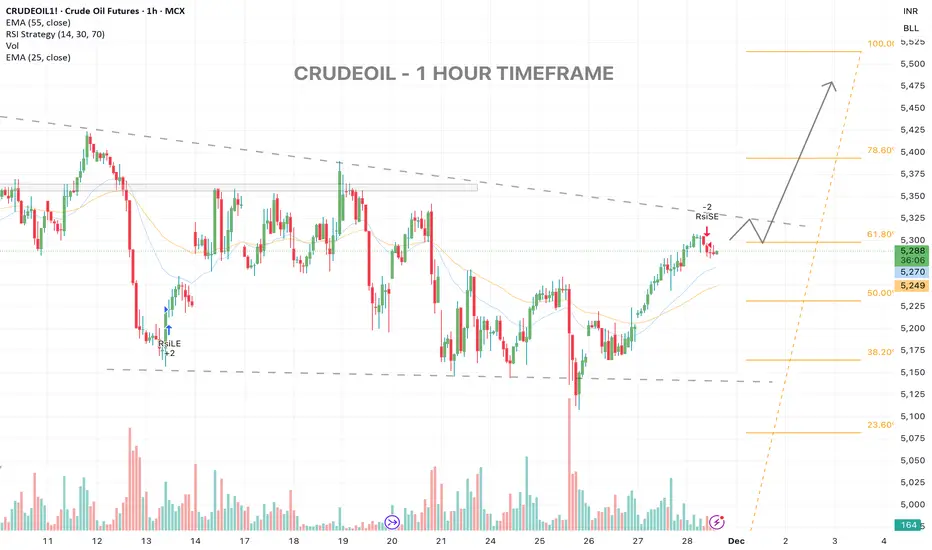
SOON BREAKOUT IN CRUDEOIL ?CRUDEOIL - 1 HOUR TIMEFRAME
Price is retesting the 61.8% zone right under the descending trendline.
A shallow pullback toward 5260–5275 can fuel the next leg toward 5335 / 5385 / 5450.
Overall, structure favors a continuation leg higher once the pullback stabilizes, remains bullish as long as 52
Core Principles of Intraday Scalping Strategy1. Precision in Entry and Exit Timing
The heart of scalping lies in flawless timing. Since each trade aims to capture only a few ticks or points, even a slight delay can turn a winning trade into a losing one. Scalpers rely heavily on lower time frames such as the 1-minute, 3-minute, or 5-minute ch
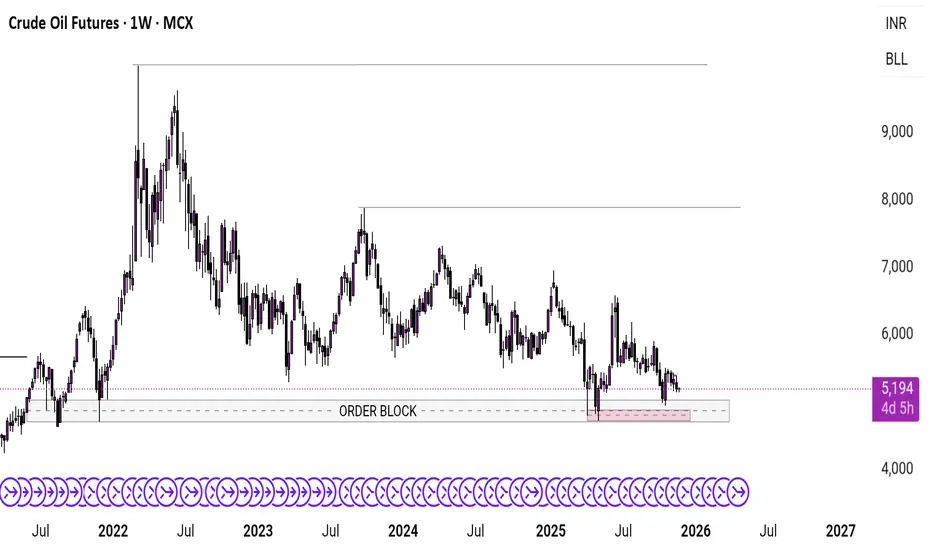
Currently strong at the support on weekly timeframe It is sustaining at the strong weekly timeframe support
Crude oil AI tool showing unmove will continue until 5300 break 🔑 Key Highlights
- Price Action: Crude is holding firm above ₹5,350, showing renewed bullish momentum.
- Trend: Long Build‑Up (Price↑ + OI↑), indicating fresh long positions.
- Supports: ₹5,350 / ₹5,300 / ₹5,250.
- Resistances: ₹5,420 / ₹5,480 / ₹5,550.
- Bias: Bullish continuation if ₹5,350
Now we are holding buy trade @5280 , target 5410,5490,5560🔑 Key Highlights (Locked Permanently)
- Supports/Resistances: 5250 is the critical support; breach flips bias.
- Indicators: ADX >25, RSI 63, PCR 0.91 — all thresholds confirmed.
- Liquidity: Turnover ₹12,400 Cr, VWAP 5345 — strong institutional activity.
- Volatility: IV 16.2%, RV 14.5% — bot
See all ideas
Summarizing what the indicators are suggesting.
Neutral
SellBuy
Strong sellStrong buy
Strong sellSellNeutralBuyStrong buy
Neutral
SellBuy
Strong sellStrong buy
Strong sellSellNeutralBuyStrong buy
Neutral
SellBuy
Strong sellStrong buy
Strong sellSellNeutralBuyStrong buy
A representation of what an asset is worth today and what the market thinks it will be worth in the future.
Displays a symbol's price movements over previous years to identify recurring trends.
Frequently Asked Questions
The current price of WTI Financial Futures (Jun 2033) is 63.08 USD — it has risen 0.29% in the past 24 hours. Watch WTI Financial Futures (Jun 2033) price in more detail on the chart.
Track more important stats on the WTI Financial Futures (Jun 2033) chart.
The nearest expiration date for WTI Financial Futures (Jun 2033) is Jun 30, 2033.
Traders prefer to sell futures contracts when they've already made money on the investment, but still have plenty of time left before the expiration date. Thus, many consider it a good option to sell WTI Financial Futures (Jun 2033) before Jun 30, 2033.
Buying or selling futures contracts depends on many factors: season, underlying commodity, your own trading strategy. So mostly it's up to you, but if you look for some certain calculations to take into account, you can study technical analysis for WTI Financial Futures (Jun 2033). Today its technical rating is strong buy, but remember that market conditions change all the time, so it's always crucial to do your own research. See more of WTI Financial Futures (Jun 2033) technicals for a more comprehensive analysis.