Thematic and Sectoral Rotation Trading1. Introduction
In financial markets, investors and traders are continuously seeking methods to maximize returns while managing risk. Among the myriad strategies, thematic and sectoral rotation trading has gained immense popularity because it aligns investment decisions with evolving economic trend
Related commodities
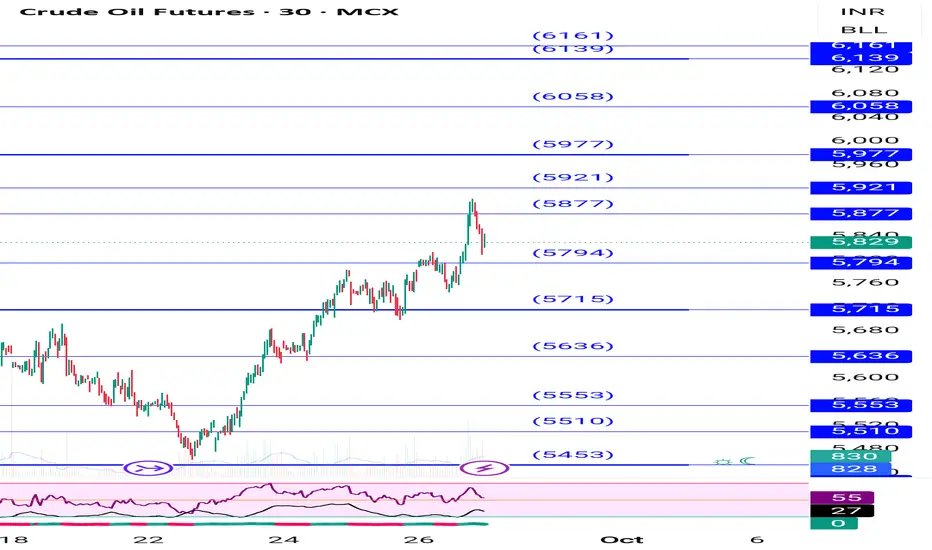
Crudeoil make or break levelAs indicated in chart crudeoil can give minimum 1:2 or three RR ratio ,plan accordingly after breakout or rejection . I wil plan for sell side ,let us observe what will happen
Disclaimer: it is only for education purpose
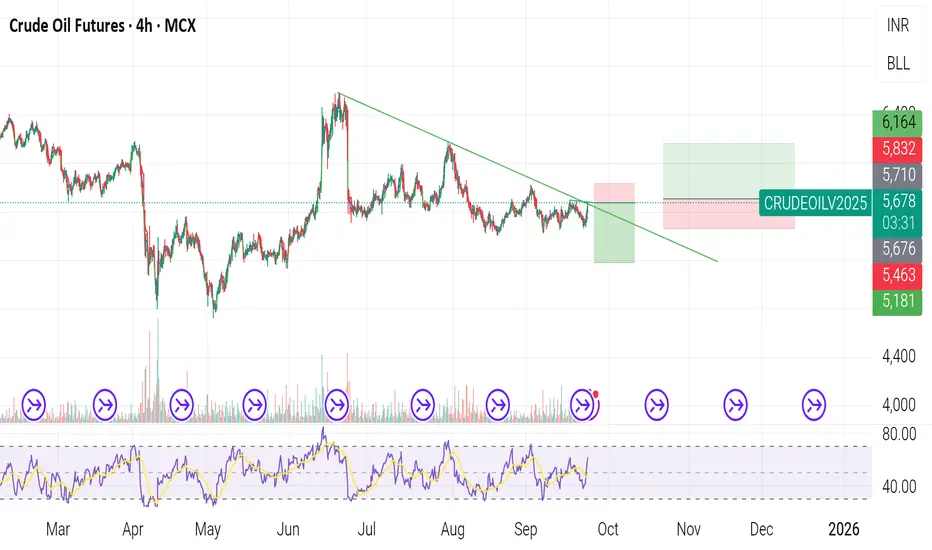
Crude sell Trade given at 5780 5630-5560 next target Crude sell given at 5780 holding sell trade, downside target 5630,5560
How My Harmonic pattern projection Indicator work is explained below :
Recent High or Low :
D-0% is our recent low or high
Profit booking zone ( Early / Risky entry) : D 12.3% -D 16.1 % is
range if break them profit bo
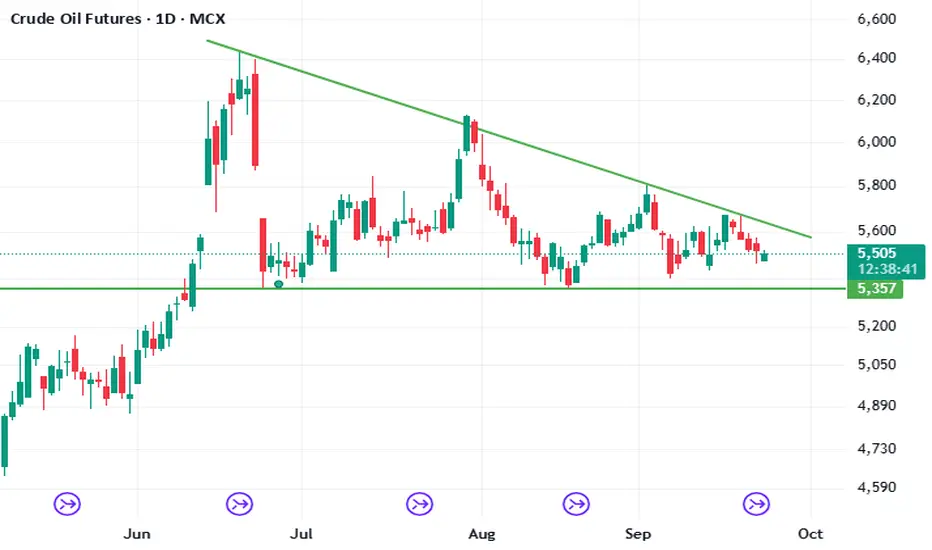
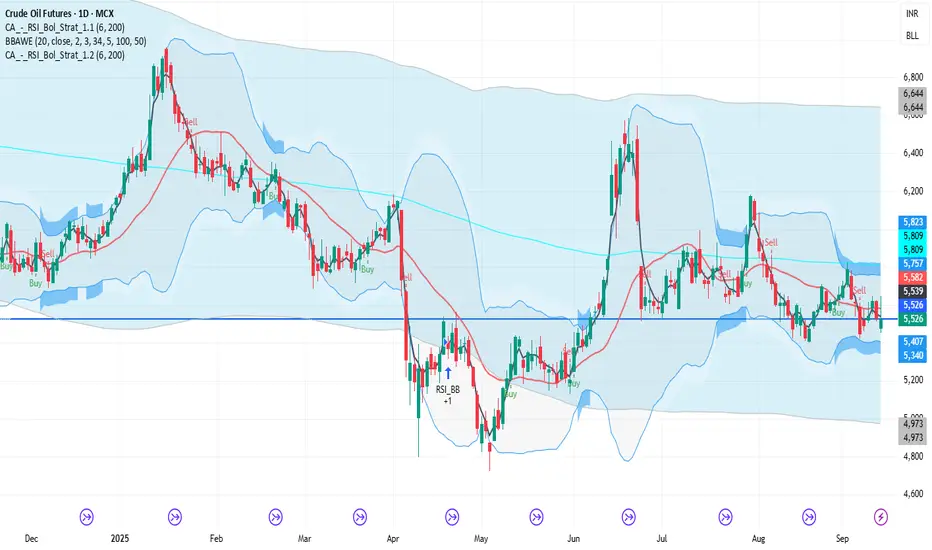
BIG MOVECrude Oil
Look at crude oil daily chart. Big move will come, either bullish or bearish. Observe two trend lines.
I am not SEBI Registered
This is my view Only.
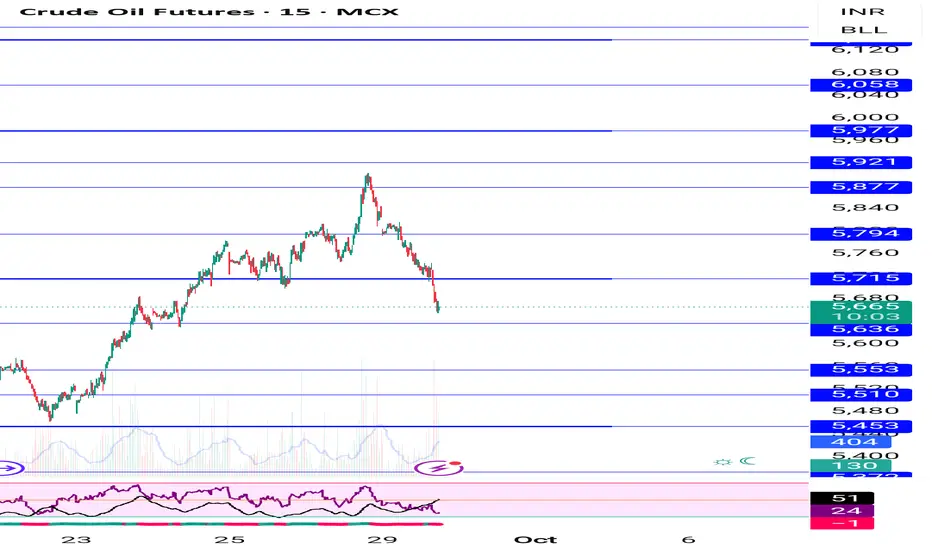
Crude mcx updated levels buy on dip until 5650 not break Crude mcx updated levels given on chart buy in dip until 5650 not break
How My Harmonic pattern projection Indicator work is explained below :
Recent High or Low :
D-0% is our recent low or high
Profit booking zone ( Early / Risky entry) : D 12.3% -D 16.1 % is
range if break them profit b
Pair Trading & Statistical Arbitrage1. Introduction
Financial markets are inherently volatile, influenced by macroeconomic trends, geopolitical events, corporate performance, and investor sentiment. Traders and quantitative analysts have developed sophisticated strategies to profit from these market movements while minimizing risk. A
17 sep - CL ShortCrude seems in likely level to bounce back. Crude seems in likely level to bounce Crude seems in likely level to bounce Crude seems in likely level to bounce Crude seems in likely level to bounce back. Crude seems in likely level to bounce Crude seems in likely level to bounce Crude seems in likely
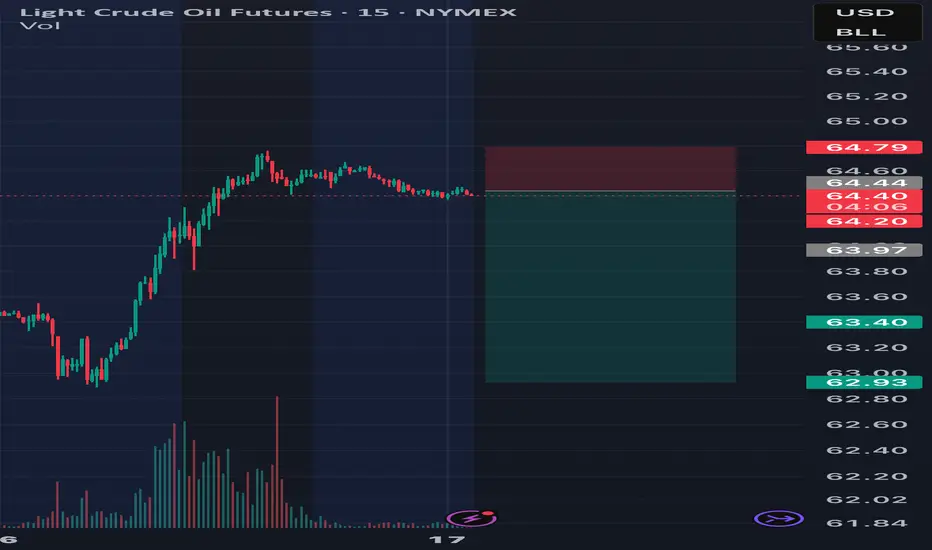
Will crude drop to $61.70?hello,
according to my analysis on 2h time frame there is high probability that crude oil futures could drop to 61.7 IN FEW HOURS,

CRUDEOIL1! 1D Time frame📉 Current Market Snapshot (as of September 13, 2025)
Previous Close: ₹5,526
Day's Range: ₹5,454 – ₹5,647
Open: ₹5,480
Close: ₹5,530
📊 Key Levels
Support: ₹5,495, ₹5,442
Resistance: ₹5,663, ₹5,800, ₹5,865
Crude Oil - Sell around 63.80, target 62.00-60.00Crude Oil Market Analysis:
We have been consistently bearish on crude oil for three months now. Our approach is completely in line with the market. As you can see, crude oil currently only needs a simple rebound to make money. Although volatility is minimal, the market will respond accordingly. We

See all ideas
Summarizing what the indicators are suggesting.
Neutral
SellBuy
Strong sellStrong buy
Strong sellSellNeutralBuyStrong buy
Neutral
SellBuy
Strong sellStrong buy
Strong sellSellNeutralBuyStrong buy
Neutral
SellBuy
Strong sellStrong buy
Strong sellSellNeutralBuyStrong buy
A representation of what an asset is worth today and what the market thinks it will be worth in the future.
Displays a symbol's price movements over previous years to identify recurring trends.
Frequently Asked Questions
The current price of Guernsey Light Sweet (EMDA) Monthly Futures (Oct 2026) is −1.30 USD — it hasn't changed in the past 24 hours. Watch Guernsey Light Sweet (EMDA) Monthly Futures (Oct 2026) price in more detail on the chart.
Track more important stats on the Guernsey Light Sweet (EMDA) Monthly Futures (Oct 2026) chart.
The nearest expiration date for Guernsey Light Sweet (EMDA) Monthly Futures (Oct 2026) is Sep 29, 2026.
Traders prefer to sell futures contracts when they've already made money on the investment, but still have plenty of time left before the expiration date. Thus, many consider it a good option to sell Guernsey Light Sweet (EMDA) Monthly Futures (Oct 2026) before Sep 29, 2026.
Buying or selling futures contracts depends on many factors: season, underlying commodity, your own trading strategy. So mostly it's up to you, but if you look for some certain calculations to take into account, you can study technical analysis for Guernsey Light Sweet (EMDA) Monthly Futures (Oct 2026). Today its technical rating is buy, but remember that market conditions change all the time, so it's always crucial to do your own research. See more of Guernsey Light Sweet (EMDA) Monthly Futures (Oct 2026) technicals for a more comprehensive analysis.