Natural gas - Matches the exact moves, posted on 24th AugNatural gas - Matches the exact moves, posted on 24th. August
Points gained- 229.5 to 264.8 = 35.3 points
1 Point = ₹1000 (35.3*1000= ₹35300.0)
Holding it, next is 300 & 320 target🎯
NG2! trade ideas
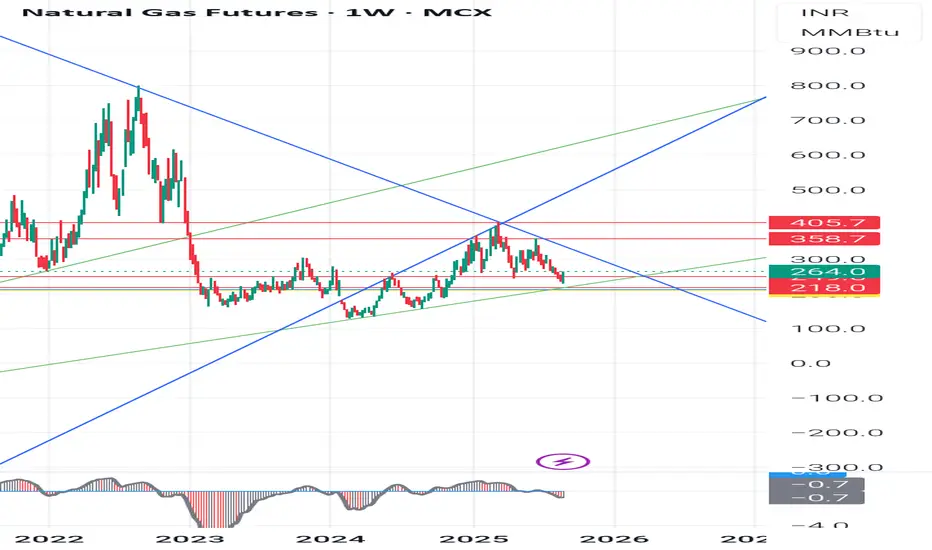
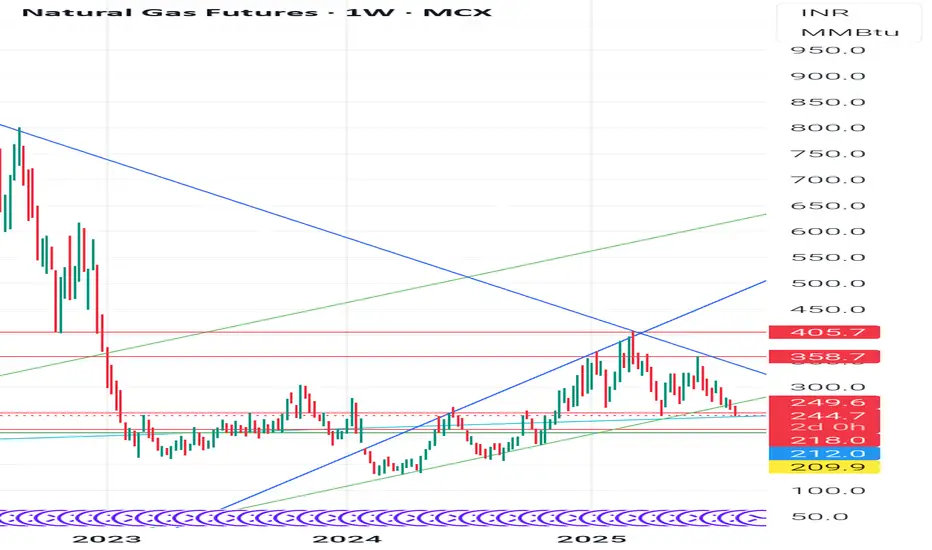
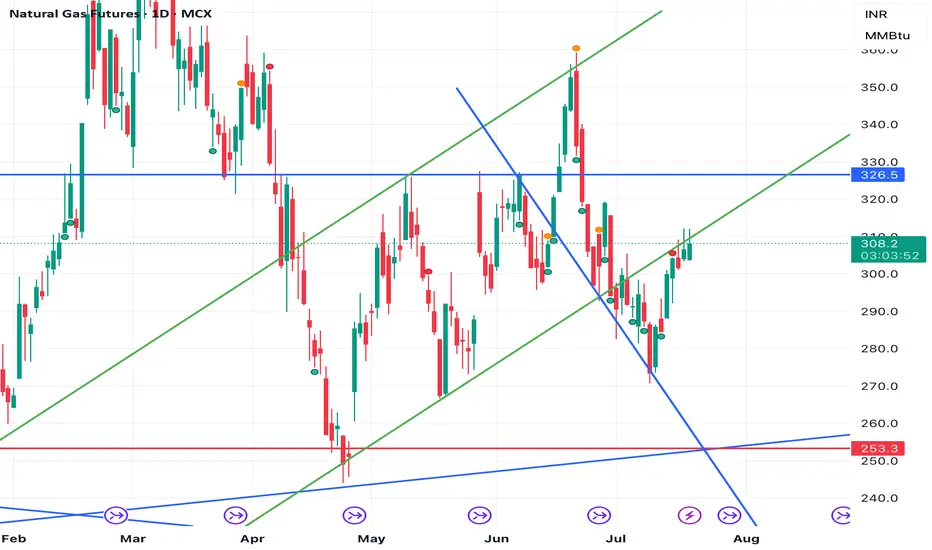
Natural Gas Futures (INR) Weekly Chart pattern analysisNatural Gas Futures (INR) Weekly Chart pattern analysis.
For the students, We will include chart structure, patterns, demand-supply zones, and precise support/resistance levels based on what is seen on the charts :
- Chart OverviewTimeframe: Weekly (1W)Current Price: 244.7 (down -5.30%)Price is near an important ascending trendline support (green line) after a strong correction from recent highs. Structure shows earlier breakout above descending trendline (blue) followed by a retest and rejection.
🧭 1. Trend Analysis- Long-Term Trend:From 2022 highs (900+), Natural Gas was in a sharp downtrend (blue descending trendline).Downtrend broke in late 2023, initiating a mid-term uptrend within an ascending channel.
Short-Term Trend:Since the 405.7 high (early 2025), prices are in a correction phase.Price now testing demand zone near 244-212.
📈 2. Chart Patterns,Ascending Channel: Price has been moving between parallel green lines since late 2023.Breakdown Risk: Price is testing the lower channel line; breakdown could trigger more downside.Head & Shoulders Possibility: The highs around 405-358 resemble a left shoulder-head-right shoulder formation, with neckline near 249-244. A confirmed break below could accelerate selling.
Supply Zone Rejection: Strong selling emerged from 358-405, marking it as a supply zone.
3. Key Technical Levels: Rejection Level: High Significance 405.7
-Major Supply 2025 high, strong rejection point 358.7
Secondary Supplying- Recent swing high before sell-off
249.6-244.7
- Current Zone - Channel support & neckline zone
218.0 - Demand Zone Past consolidation & buying interest
212.0 - Strong Support Historical demand zone floor
209.9
- Critical Support
If broken, opens path to 180-160⚖ 4. Demand & Supply ZonesDemand Zones:218-212 (weekly accumulation area)180-160 (last major base before rally)
Supply Zones:358-405 (heavy selling area)280-300 (minor supply if bounce occurs)
5. Possible ScenariosScenario
1 Support Holds:If 244-212 holds, expect a bounce towards 280 and 300.A close above 300 could re-test 358.
Scenario
2 - Breakdown:A close below 212 could lead to a quick drop towards 180-160.
👉 Disclaimer:
This is for educational purposes only, not trading advice. Futures & commodities are highly volatile; manage risk and consult a registered financial advisor.
#naturalgas #technicallevels #chartpatternabalysis #commoditytrading

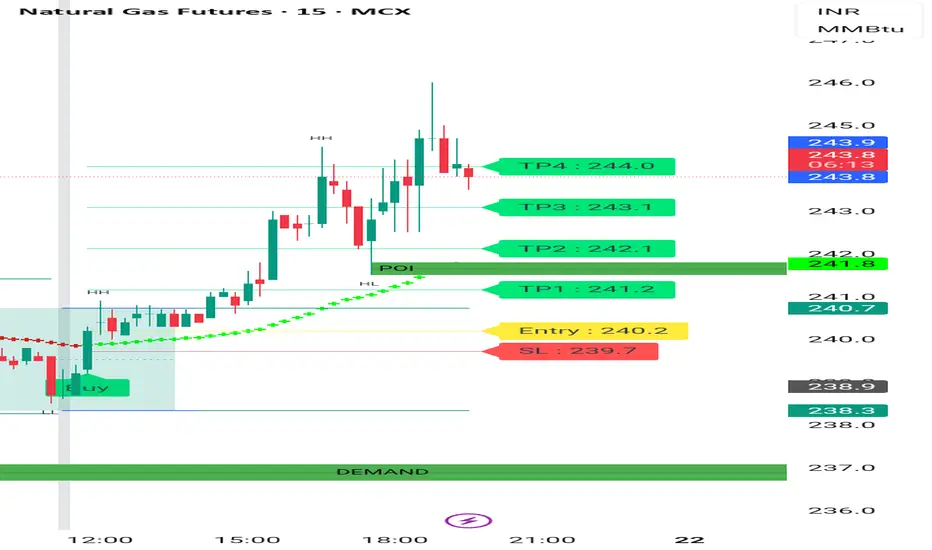
Natural gas 15 min Chart Natural gas 15 min Chart shows good strength. It's moving up with demand zone . Cmp 243. It may move further up . No buy sell Reccomendation. It's for educational purposes only. Consult your financial advisor before making any position in stock market. Stock market is risky .
Natural gas buy given near 240-243 , ng bottom formation almost Natural gas buy given near 243-240 , bottom formation almost done. If break 258-260 resistance area then fresh uptrend will start
Upside resistance 258-260, then 268-271 , 277-279
Support 243-240 then 232-230
How My Harmonic pattern projection Indicator work is explained below :
Recent High or Low :
D-0% is our recent low or high
Profit booking zone ( Early / Risky entry) : D 11.8% -D 16.1 % is
range if break them profit booking start on uptrend or downtrend but only profit booking, trend not changed
SL reversal zone (Safe entry ) : SL 23% and SL 25% is reversal zone if break then trend reverse and we can take reverse trade
Target : T1, T2, T3, T4 and .
Are our Target zone
Any Upside or downside level will activate only if break 1st level then 2nd will be active if break 2nd then 3rd will be active.
Total we have 7 important level which are support and resistance area
Until , 16% not break uptrend will continue if break then profit booking will start.
If break 25% then fresh downtrend will start then T1, T2,T3 will activate
1,3,5,10,15,20 minutes are short term levels.
30 minutes 60 minutes , 2 hours,3 hours, ... 1 day and 1 week chart positional and long term levels

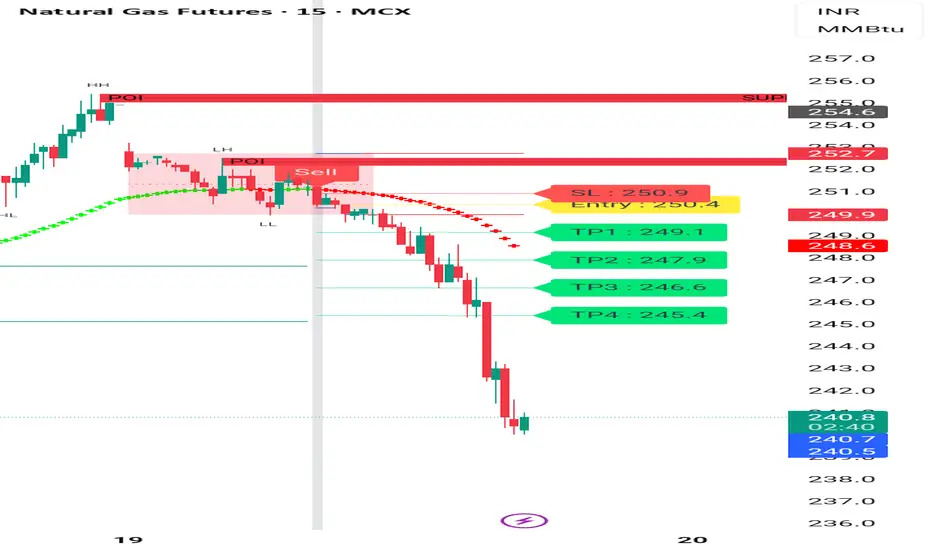
Ng shoryed with indicator at 250 . Now 240 Ng shoryed with indicator at 250 . Now 240 . natural followed our set up. And good opportunity to sell at 250 with set up .
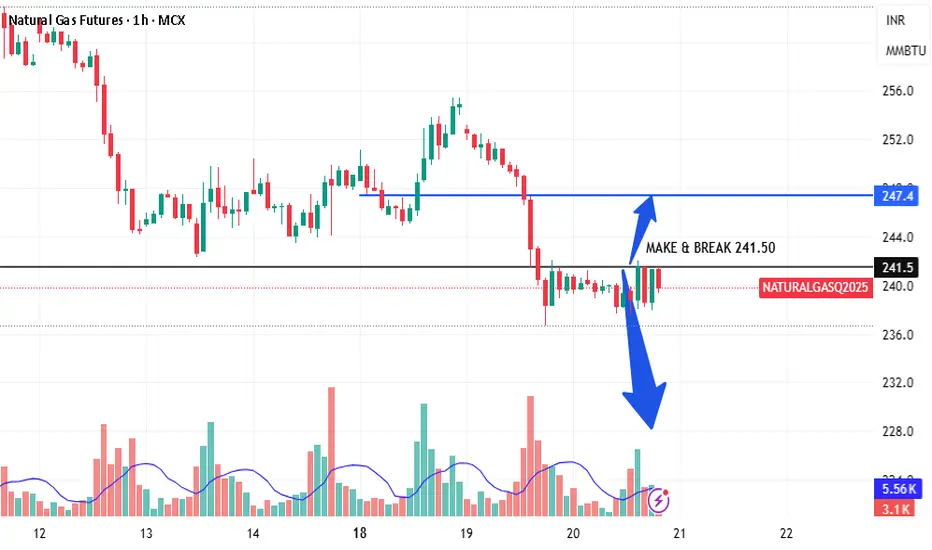
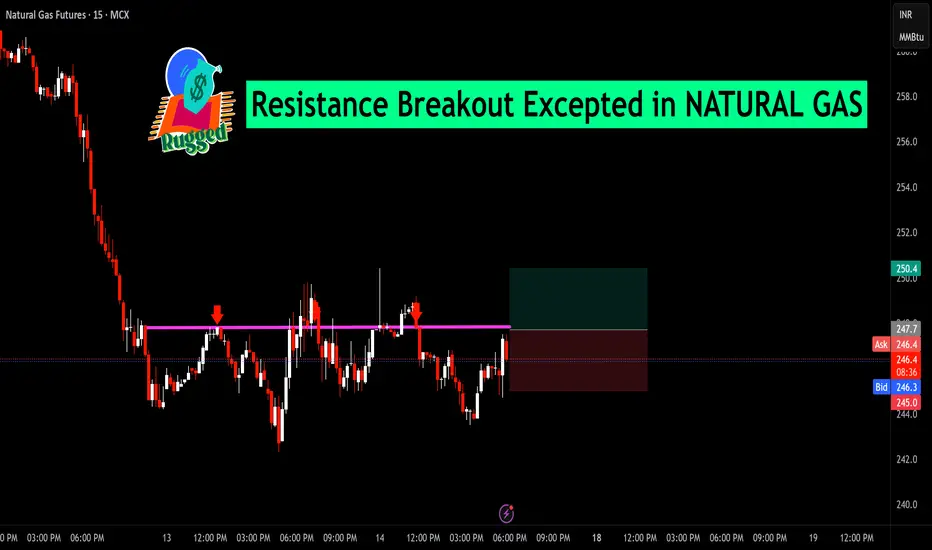
Resistance Breakout Excepted in NATURAL GASNatural Gas has been consolidating just below a key resistance level around ₹247–₹248, with multiple rejection points in recent sessions (marked by red arrows). The current price action shows renewed buying pressure, with candles testing the resistance zone once again.
Technical View:
The horizontal resistance has acted as a strong supply zone multiple times.
A decisive breakout and close above ₹248 could open the path for further upside momentum.
Immediate support is placed near ₹244.20, which serves as a stop-loss reference for breakout traders.
Trading Perspective:
If price sustains above the resistance level with volume confirmation, the breakout could trigger a short-term bullish move toward higher targets. However, failure to hold above this zone may lead to another pullback within the range.
Natural start buying again near 244-240 support area, avoid sellNatural gas currently at support area start buying again near 244-240 , risk reward good for upside, there will be no ceasefire deal in trump Putin meeting.
Updated levels given on chart,
Avoid any fresh sell trade at current price is anyone holding sell trade then book profit now

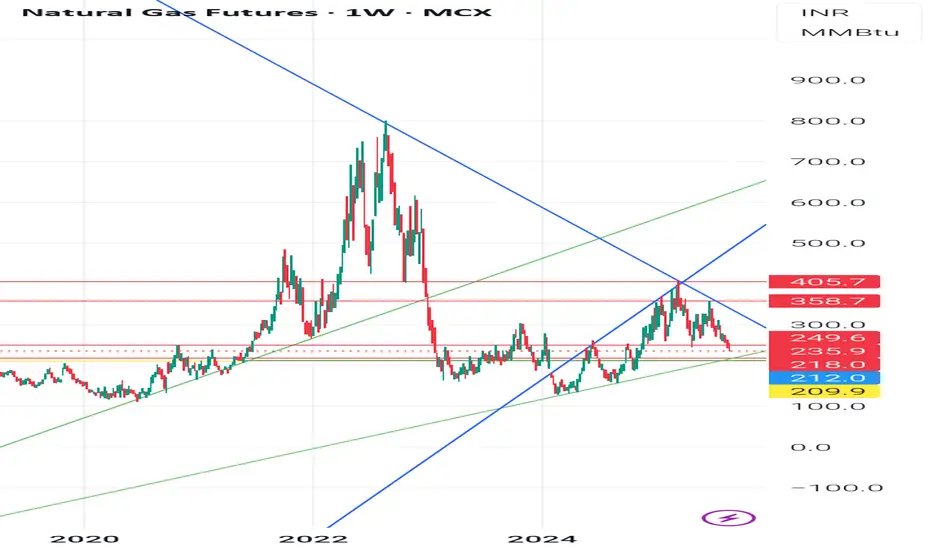
Natural gas: Chart AnalysisLet’s break down the Natural Gas Futures (INR) Weekly Chart step-by-step.
This will include chart structure, patterns, demand–supply zones, and precise support/resistance levels based on what I can see on the charts :
🔍Chart OverviewTimeframe: Weekly (1W)Current Price: ₹244.7 (down -5.30%)Price is near an important ascending trendline support (green line) after a strong correction from recent highs. Structure shows earlier breakout above descending trendline (blue) followed by a retest and rejection.
🧭 1. Trend AnalysisLong-Term Trend:From 2022 highs (₹900+), Natural Gas was in a sharp downtrend (blue descending trendline).Downtrend broke in late 2023, initiating a mid-term uptrend within an ascending channel.
Short-Term Trend:Since the ₹405.7 high (early 2025), prices are in a correction phase.Price now testing demand zone near ₹244–₹212.
📈 2. Chart Patterns,Ascending Channel: Price has been moving between parallel green lines since late 2023.Breakdown Risk: Price is testing the lower channel line; breakdown could trigger more downside.Head & Shoulders Possibility: The highs around ₹405–₹358 resemble a left shoulder–head–right shoulder formation, with neckline near ₹249–₹244. A confirmed break below could accelerate selling.
Supply Zone Rejection: Strong selling emerged from ₹358–₹405, marking it as a supply zone.📍
3. Key Technical LevelsLevel (₹) nType the:Significance 405.7
🔺 Major Supply 2025 high, strong rejection point 358.7
Secondary Supplying- Recent swing high before sell-off
249.6–244.7
⚠️ Current Zone Channel support & neckline zone
218.0 🛑 Demand Zone Past consolidation & buying interest
212.0 🛑 Strong Support Historical demand zone floor
209.9
🔻 Critical Support
If broken, opens path to ₹180–₹160⚖ 4. Demand & Supply ZonesDemand Zones:₹218–₹212 (weekly accumulation area)₹180–₹160 (last major base before rally)
Supply Zones:₹358–₹405 (heavy selling area)₹280–₹300 (minor supply if bounce occurs)
5. Possible ScenariosScenario
1 Support Holds:If ₹244–₹212 holds, expect a bounce towards ₹280 and ₹300.A close above ₹300 could re-test ₹358.
Scenario
2 – Breakdown:A close below ₹212 could lead to a quick drop towards ₹180–₹160.
⚠ Disclaimer:
This is for educational purposes only, not trading advice. Futures & commodities are highly volatile; manage risk and consult a registered financial advisor.
Natural gas buy given near 262-256 target 275 hit again support Natural gas buy given near 256 to 262 , upside target 275 hit , again at support area , avoid fresh buying until Trump and Putin meeting outcome not come both side big movement possible based on event.
Natural gas updated levels given on chart
Rate cuts geopolitical issues, tarrif will act both side move play safe , risk is high at current market scenario

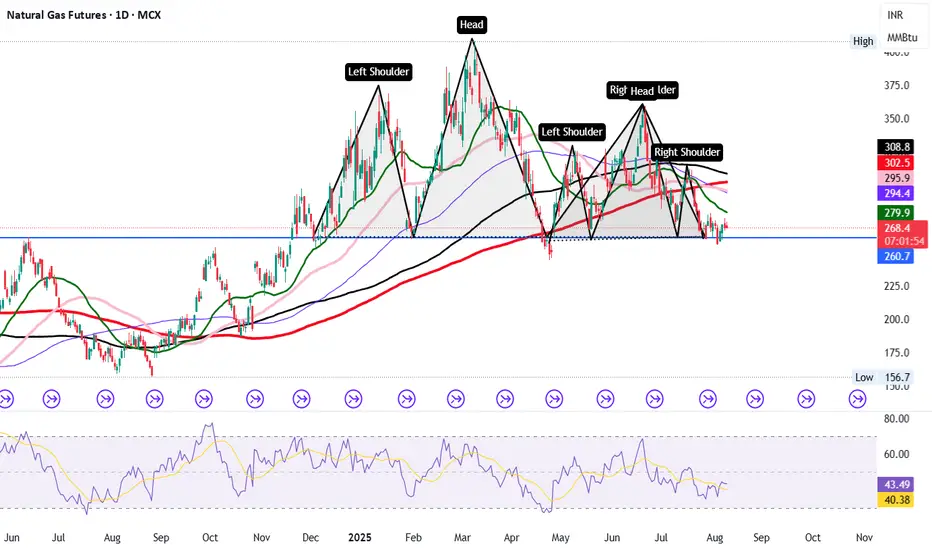
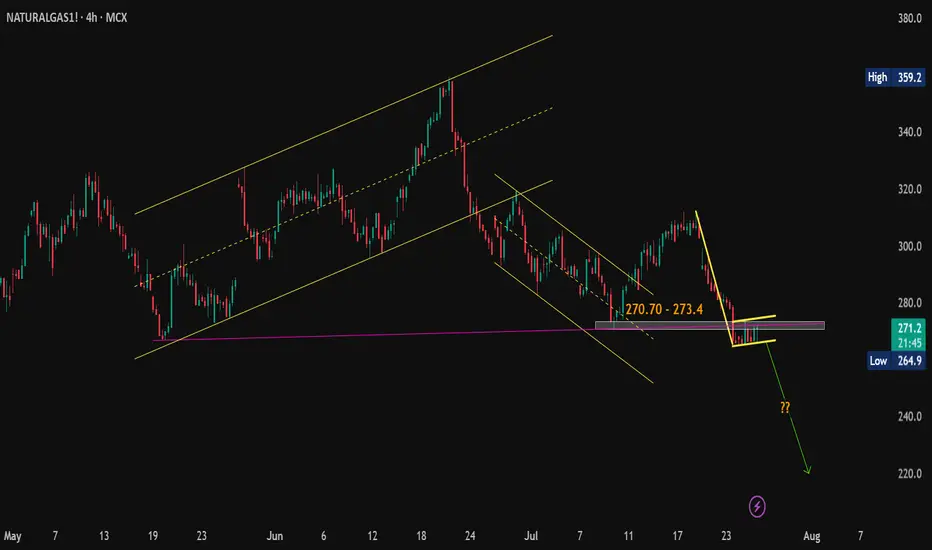
NATURAL GAS AT CRUCIAL BREAKDOWN ZONE – BE READY FOR A BIG MOVE!📉 Chart Pattern Alert: Double Head & Shoulders ✅
🧠 Technical Smart Zone: Multiple Head & Shoulder formations confirm serious structural weakness.
📌 Critical Breakdown Level:
👉 If Natural Gas breaks below ₹258, expect a sharp and extended downfall in coming sessions.
📊 Why This Matters:
Price action is struggling near neckline zone
RSI below 45 with no bullish divergence
Major SMAs are resisting from above
Long-term support zone has been tested multiple times
🚨 Below ₹258 = Panic Mode Activated
Targets: ₹250 → ₹242 → ₹230+ possible if selling pressure continues
💡 Professional Insight:
Pattern failures can lead to short-term bounces, but structure clearly favors sellers unless bulls reclaim ₹280+ quickly.
📍Stay updated with WHITEROCK levels for high-probability entries & exits.
🔔 Join us now — don’t trade blindly, trade informed.
Natural gas as said earlier 262-256 support upside 268,275,281 Natural gas buy given near support 262-256 , upside target 268,275,281 .
Natural gas buy on dip from next month real economy demand will increase

Natural gas as said earlier 262-256 strong support area bounce As said earlier natural gas 262 to 256 strong support area bounce possible from that area bounce came start buying on dip
Updated levels given chart buy near support area

Natural gas 262-256 support area start buying again, positional Natural gas 262-256 strong support area again buy on dip upside target big , safe traders can sell puts at current price
Both side levels given on chart
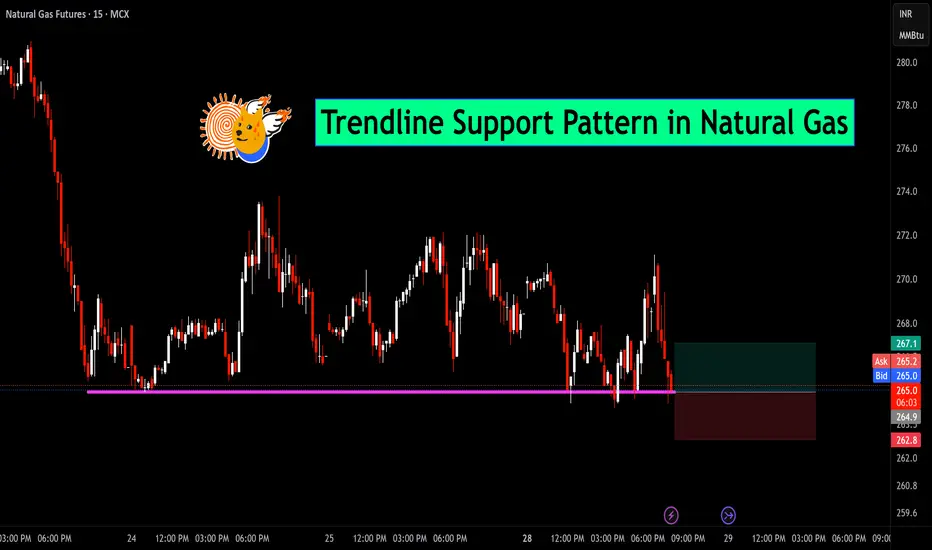
Trendline Support Pattern in Natural GasNatural Gas is currently respecting a well-established horizontal trendline support zone around the 264–265 level. As seen in the chart, price has tested this area multiple times, indicating strong demand and buyer interest at this zone.
📉 The recent candles show rejection from the support, suggesting a potential bounce. If this level continues to hold, we may see an upward move toward the 267–270 resistance area.
📌 Trade Idea:
Entry: Near 265.3
Stop-loss: Below 262.8 (structure break)
Target: 267.1 and above for short-term move
🧠 Watch for confirmation with volume or bullish candlestick formations before entering the trade.
Natural gas trying to make bottom if break 273 then upmove Natural gas buy on dip at current price, better to sell Put of August month habe 21-23 points premium if break 273 then upmove short covering will start avoid sell trade at current price
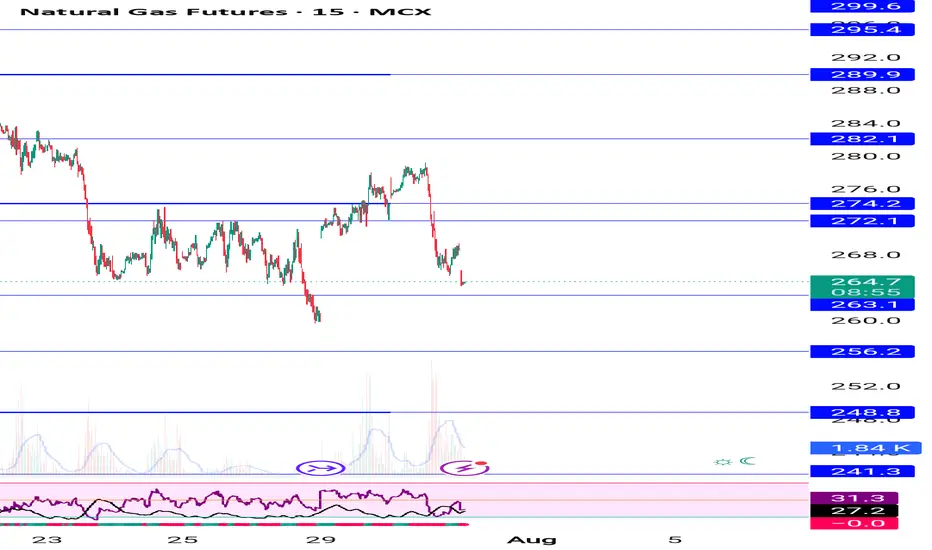
Natural Gas Technical Breakdown Ahead? Eyes on the 264.90 Mark#Commodity
#NaturalGas View:
CMP: 271.70
🔹 Resistance Levels:
• 270.70 – 273.40
• 275.00
• 284.00
🔹 Support Level:
• 264.90
Technical View:
Natural Gas seems to be forming a bearish flag pattern on the hourly & 4 hours chart. The price is currently facing resistance at the pink trendline breakdown level. While it's still early for confirmation, a decisive hourly close below 264.90 may validate the pattern and open the door for further downside. If the pattern plays out, a possible target zone around 220 could be in sight.
📌 Note: This is a technical analysis view shared for educational purposes only and not a recommendation to buy/sell. Always consult your financial advisor before making any trading decisions.
#Commodity | #NaturalGas | #MCX | #PriceAction
Breakdown and retest completedNatgas has completed the retest and not able to move past the resistance with day 3 hanging man pattern. Next leg of movement is to 260-265, the next support lvl.
Buy NAT GAS Natural gas at weak support zone. 273-275 buy once 15 min candle above the price.
Target - 280,285,290,300
Natural gas we booked profit at 311, wait for dip near 294-292How My Harmonic pattern projection Indicator work is explained below :
Recent High or Low :
D-0% is our recent low or high
Profit booking zone: D13% -D15% is
range if break them profit booking start on uptrend or downtrend but only profit booking, trend not changed
SL reversal zone : SL 23% and SL 25% is reversal zone if break then trend reverse and we can take reverse trade
Target : T1, T2, T3, T4 and .
Are our Target zone

NATGAS OPTION ALERT🔥 NATGAS OPTION ALERT 🔥
✅ Buy 330CE @ ₹3.45–₹4.00
🎯 Targets: ₹7 / ₹12 / ₹15
🛑 SL: ₹2.00
📍 NG Spot: ₹308–₹310
📊 Volume pickup above ₹310 = Momentum Confirmed
🧠 Trail SL after ₹6 hit
Risk: ₹1,875 per lot
Reward: ₹7K–₹14K per lot
📅 Watch till 7PM (US open) for breakout
🚨 Book partial at ₹7 and ride the rest
Natural gas 312 target hit today holding buy from 282 buy on dipHow My Harmonic pattern projection Indicator work is explained below :
Recent High or Low :
D-0% is our recent low or high
Profit booking zone: D13% -D15% is
range if break them profit booking start on uptrend or downtrend but only profit booking, trend not changed
SL reversal zone : SL 23% and SL 25% is reversal zone if break then trend reverse and we can take reverse trade
Target : T1, T2, T3, T4 and .
Are our Target zone
