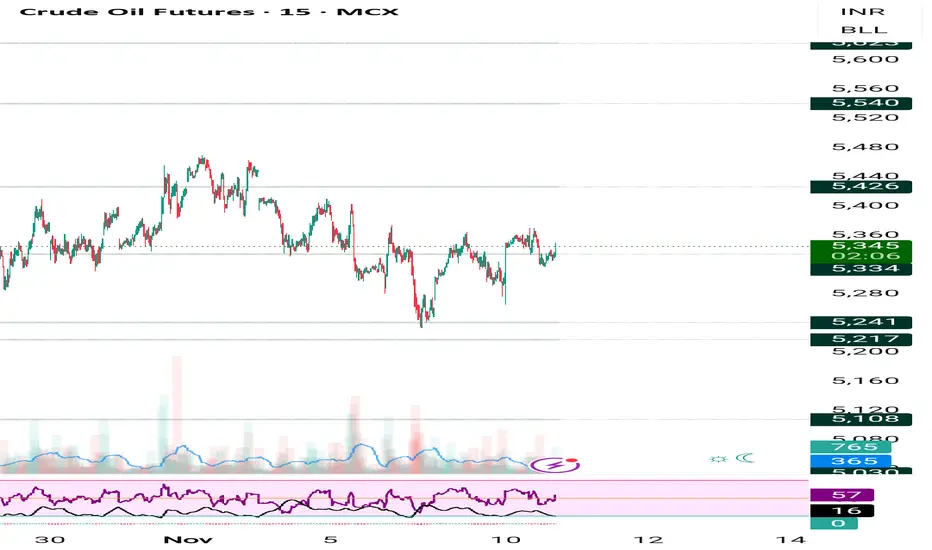
Now we are holding buy trade @5280 , target 5410,5490,5560🔑 Key Highlights (Locked Permanently)
- Supports/Resistances: 5250 is the critical support; breach flips bias.
- Indicators: ADX >25, RSI 63, PCR 0.91 — all thresholds confirmed.
- Liquidity: Turnover ₹12,400 Cr, VWAP 5345 — strong institutional activity.
- Volatility: IV 16.2%, RV 14.5% — bot
Related commodities
Crude start buying on dip 5250-5200 buying area levels on chart Crude start buying on dip 5250 to 5200 buying area , levels given on chart
How My Harmonic pattern projection Indicator work is explained below :
Recent High or Low :
D-0% is our recent low or high
Profit booking zone ( Early / Risky entry) : D 13.2% -D 16.1 % is
range if break them profi
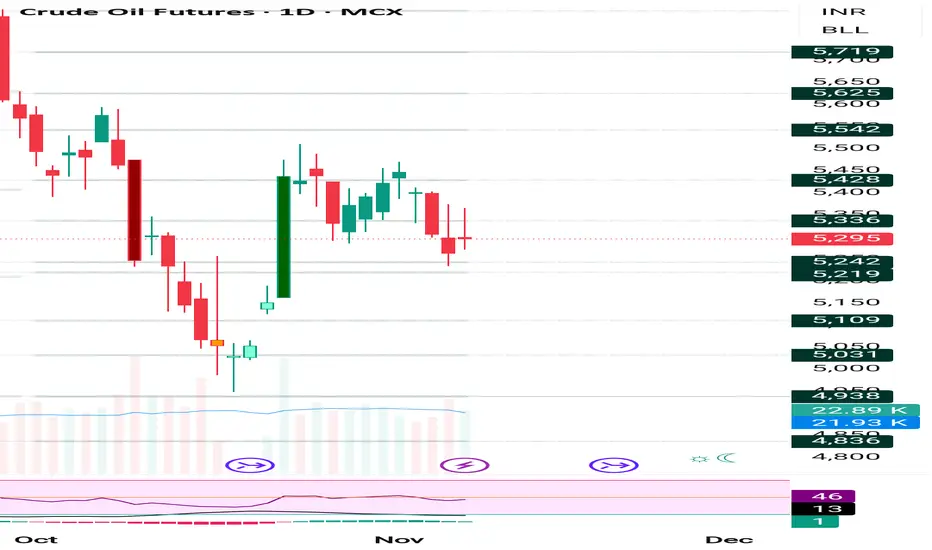
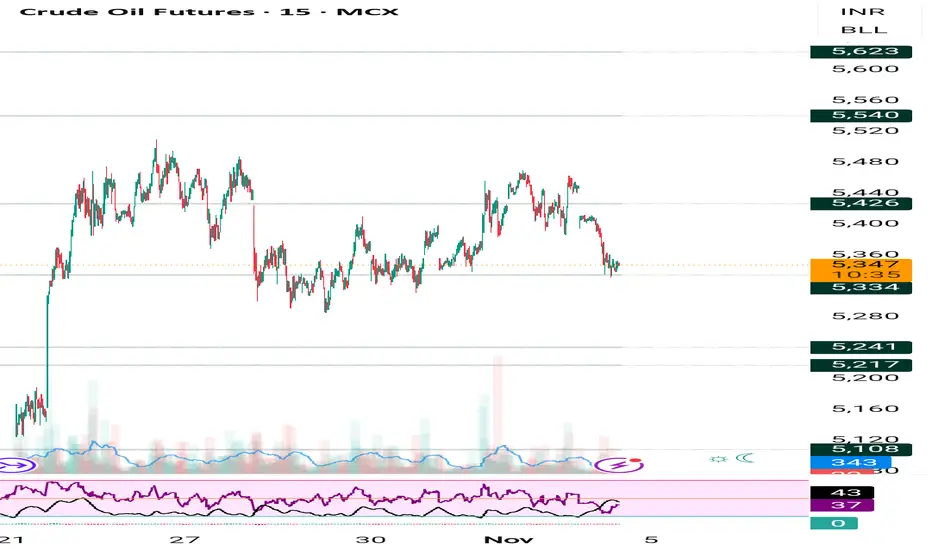
Crude oil AI tool showing unmove will continue until 5300 break 🔑 Key Highlights
- Price Action: Crude is holding firm above ₹5,350, showing renewed bullish momentum.
- Trend: Long Build‑Up (Price↑ + OI↑), indicating fresh long positions.
- Supports: ₹5,350 / ₹5,300 / ₹5,250.
- Resistances: ₹5,420 / ₹5,480 / ₹5,550.
- Bias: Bullish continuation if ₹5,350
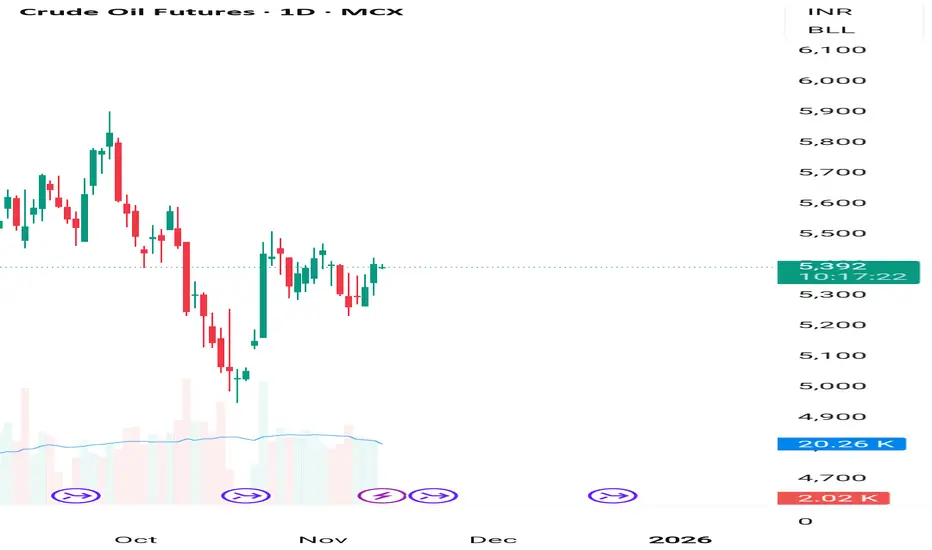
Crude buy 250-280 points range buy on low sell on high 🔑 Key Highlights
- Price Action: Crude trading at ₹5,343, holding above ₹5,300 support.
- Trend: Active Long Build‑Up confirmed.
- Supports: ₹5,300 / ₹5,250 / ₹5,200.
- Resistances: ₹5,380 / ₹5,420 / ₹5,480.
- Bias: Bullish continuation if above ₹5,300; corrective pullback risk below ₹5,250.

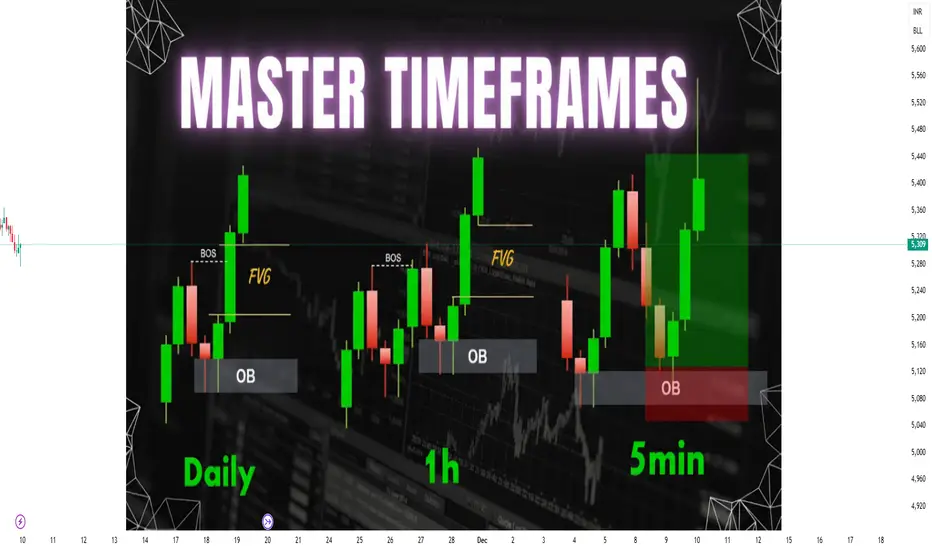
Multi-Timeframe Analysis (Intraday, Swing, Positional)1. Understanding Multi-Timeframe Analysis
Multi-Timeframe Analysis refers to the process of observing the same security across different timeframes to identify trend alignment, potential reversal zones, and optimal trading opportunities. Every timeframe provides unique insights:
Higher Timeframe:
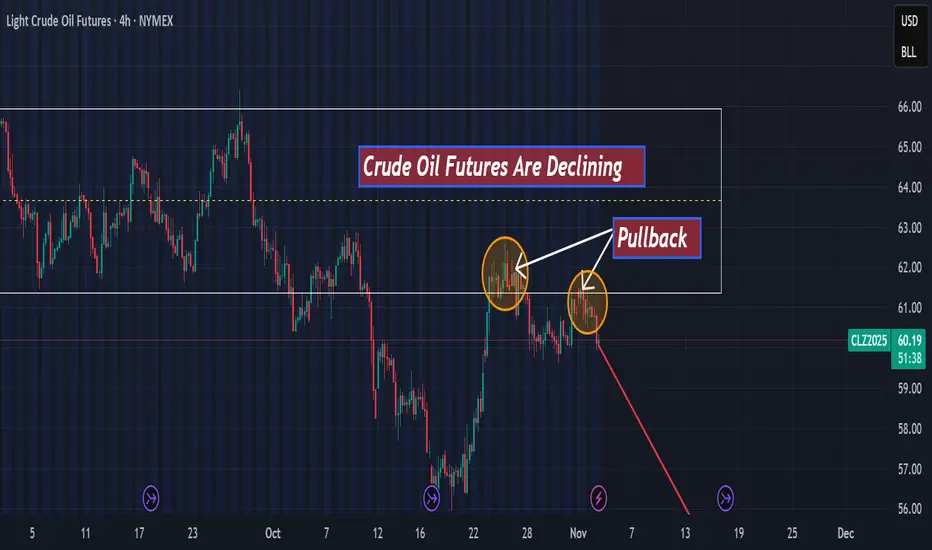
Light Cude Oil Futures are declining hello,
According to my technical analysis, there is a high probability of a decline toward $55 in the next few days for two main reasons:
-A first Pullback on the support level.
-A second pullback retesting that support.
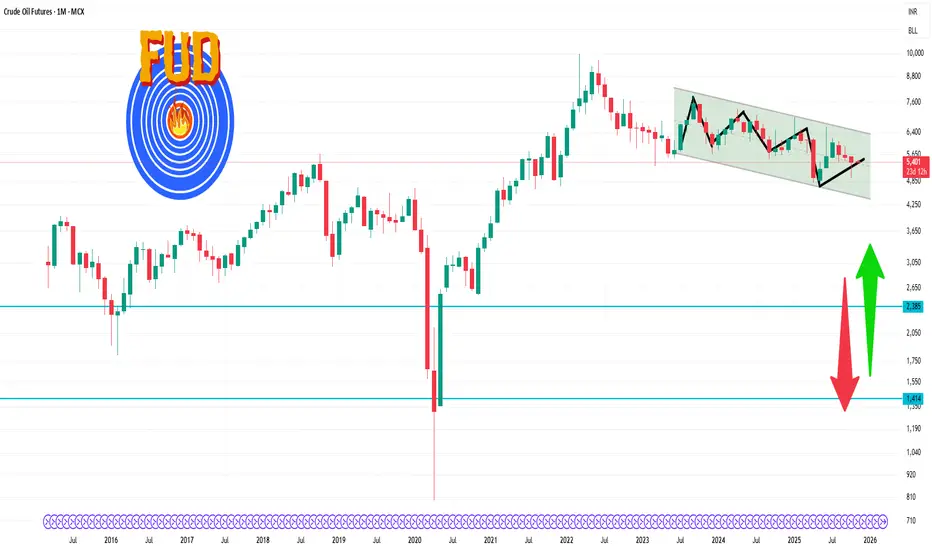
Crude Oil Futures 1 Month Time Frame 🔍 Current Price
Last quoted: ~ ₹ 5,422 per barrel.
Recent 1-month high: ~ ₹ 5,903
Recent 1-month low: ~ ₹ 4,944
Crude 5230-5200 fall again possible sell on rise Crude sell on rise 5230-5200 will come
How My Harmonic pattern projection Indicator work is explained below :
Recent High or Low :
D-0% is our recent low or high
Profit booking zone ( Early / Risky entry) : D 13.2% -D 16.1 % is
range if break them profit booking start on uptrend or downtr
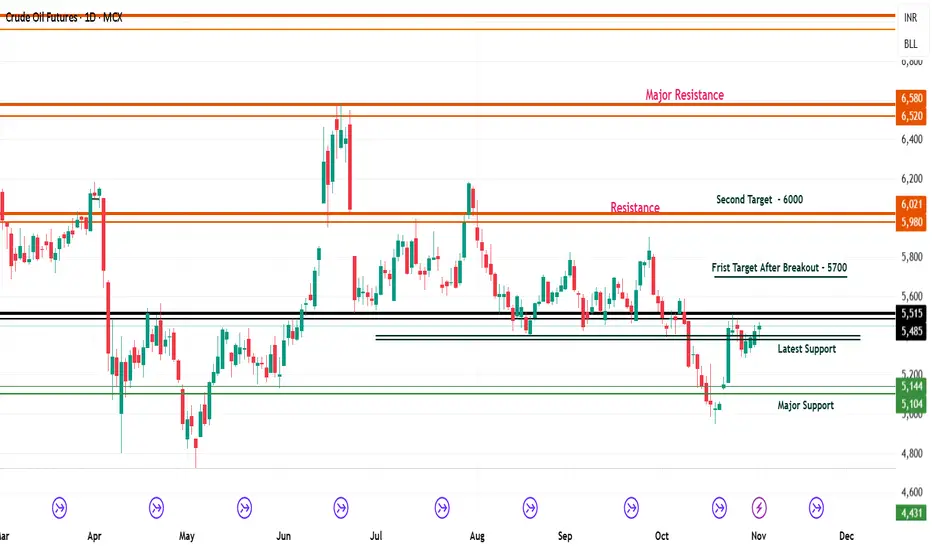
Crude Oil Futures Technical Analysis with TargetsCrude Oil Futures (MCX) Technical Analysis – Key Levels and Price Outlook
(November 2025 Update)
- Crude oil prices have shown some recovery this week after a continuous downtrend seen in October.
- The market is now trying to build a base above ₹5,10
Technical Analysis & Price Action MasteryIntroduction
In the world of trading, where market movements can shift within seconds, the ability to interpret price charts and forecast future moves is one of the most valuable skills a trader can possess. Technical analysis and price action mastery together form the foundation of this skill — en

See all ideas
Summarizing what the indicators are suggesting.
Neutral
SellBuy
Strong sellStrong buy
Strong sellSellNeutralBuyStrong buy
Neutral
SellBuy
Strong sellStrong buy
Strong sellSellNeutralBuyStrong buy
Neutral
SellBuy
Strong sellStrong buy
Strong sellSellNeutralBuyStrong buy
A representation of what an asset is worth today and what the market thinks it will be worth in the future.
Displays a symbol's price movements over previous years to identify recurring trends.
Frequently Asked Questions
The current price of E-mini Crude Oil Futures (Feb 2029) is 60.950 USD — it has risen 0.62% in the past 24 hours. Watch E-mini Crude Oil Futures (Feb 2029) price in more detail on the chart.
Track more important stats on the E-mini Crude Oil Futures (Feb 2029) chart.
The nearest expiration date for E-mini Crude Oil Futures (Feb 2029) is Jan 19, 2029.
Traders prefer to sell futures contracts when they've already made money on the investment, but still have plenty of time left before the expiration date. Thus, many consider it a good option to sell E-mini Crude Oil Futures (Feb 2029) before Jan 19, 2029.
Buying or selling futures contracts depends on many factors: season, underlying commodity, your own trading strategy. So mostly it's up to you, but if you look for some certain calculations to take into account, you can study technical analysis for E-mini Crude Oil Futures (Feb 2029). Today its technical rating is sell, but remember that market conditions change all the time, so it's always crucial to do your own research. See more of E-mini Crude Oil Futures (Feb 2029) technicals for a more comprehensive analysis.