Us 30 fractal from 2020 us 30 see rise of 40percent then fall of 22 percent then again in 2022 we had seen 20 percent around correction and rise of 50/55 percent so for coming year there is still room it to rise about 56000-57000 then again it may hit correction phase

Dow Jones Ind. Weekly UpdatedDJI Indices in now going Wave 3 super cycle degree target 60,000 USD minor correction possible so enter 43,000 - 40,000 level is good for long entry

Dow Jones Crash - 2026 Analysis (Elliott Wave)DJI Indices crash possible up to minimum 50 to 61.8% starts on Feb - mar 2026 forming leading diagonal pattern 5th wave completed soon last up move around 1000 points only then stars correction so traders and investors go short don't try long at this time

DJI short trade. 15 dec 2025if 15 min candle closed below 48228. price will touch 48100.
if 15 min candle get rejected from 48230,then price will spend some more time there,dont take reversal trade from there.

US30 High Volatility ExpectedBy looking into the US30, lot of $liquidity$ are seated on downside and upside with an Target mentioned in the Chart.
Based on the Event ADP and Federal Fund rate , both the liquidities will be hunted in the market. Keep Looking happy Trading

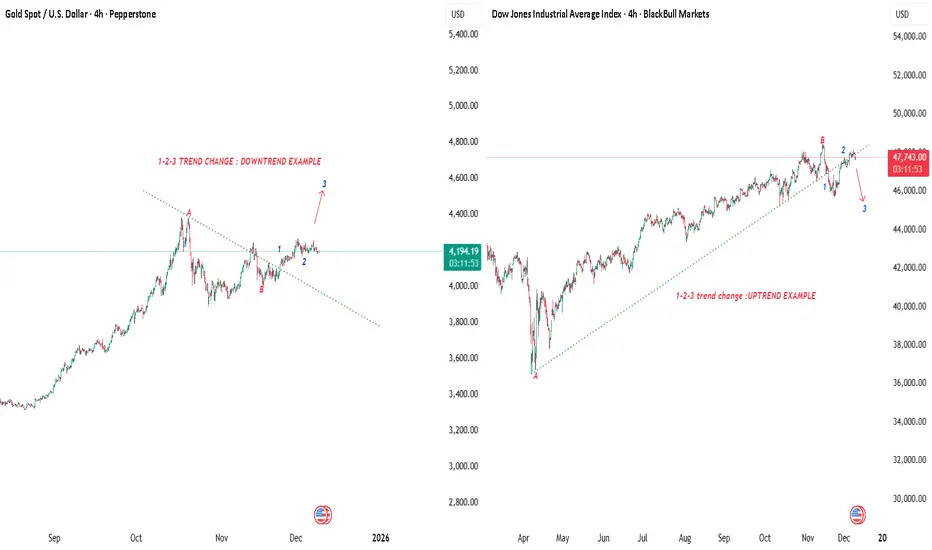
Price Action Pattern Series- 1-2-3 Trend Change Method !Starting this series with a very reliable structure-based reversal technique. The 1-2-3 method helps identify when a trend has actually changed instead of guessing bottoms or tops.
In simple terms, the trend shifts only after three structural events complete:
Sharing a simple but powerful reversal
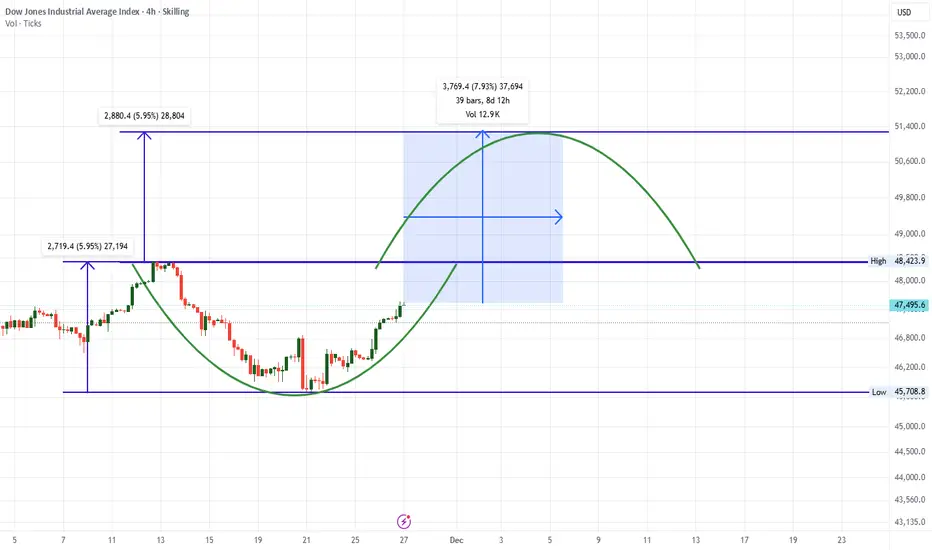
DOW Jones is having rounding bottom formation - 8% upside targetDOW Jones is having rounding bottom formation - 8% upside target Possible.
LTP - 47500
Targets - 51300+
Timeframe - Dec-25 End.
Charts are suggesting Bull market run of 8% in next few weeks on Dow Jones - Possibility of some Positive news flows across world to take markets on big upmove in Dec M
Higher highs and below SMA( Weekly high > 1 week ago high AND ( Latest Close < SMA(Latest Close, 50) OR Latest Close < SMA(Latest Close, 200) ) )


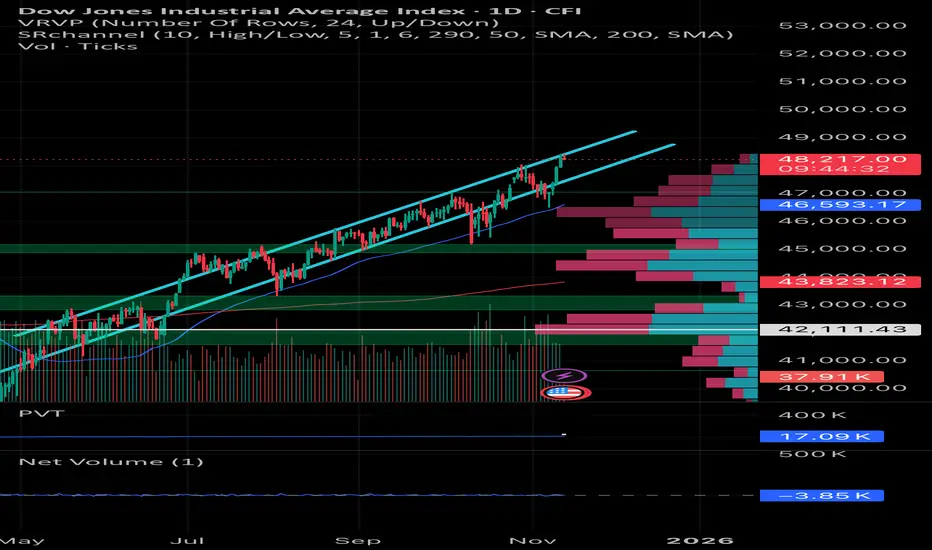
Dow Jones at resistance, should expect some down sideAs we see Dow is moving in a trend , breaking the trend on upper side is unlikely , expect some correction .
See all ideas
Summarizing what the indicators are suggesting.
Oscillators
Neutral
SellBuy
Strong sellStrong buy
Strong sellSellNeutralBuyStrong buy
Oscillators
Neutral
SellBuy
Strong sellStrong buy
Strong sellSellNeutralBuyStrong buy
Summary
Neutral
SellBuy
Strong sellStrong buy
Strong sellSellNeutralBuyStrong buy
Summary
Neutral
SellBuy
Strong sellStrong buy
Strong sellSellNeutralBuyStrong buy
Summary
Neutral
SellBuy
Strong sellStrong buy
Strong sellSellNeutralBuyStrong buy
Moving Averages
Neutral
SellBuy
Strong sellStrong buy
Strong sellSellNeutralBuyStrong buy
Moving Averages
Neutral
SellBuy
Strong sellStrong buy
Strong sellSellNeutralBuyStrong buy
Displays a symbol's value movements over previous years to identify recurring trends.
Frequently Asked Questions
The current value of US Wall St 30 is 48,459.2 USD — it has risen by 0.33% in the past 24 hours. Track the index more closely on the US Wall St 30 chart.
US Wall St 30 reached its highest quote on Dec 12, 2025 — 48,870.2 USD. See more data on the US Wall St 30 chart.
The lowest ever quote of US Wall St 30 is 6,466.6 USD. It was reached on Mar 6, 2009. See more data on the US Wall St 30 chart.
US Wall St 30 value has increased by 0.23% in the past week, since last month it has shown a 5.98% increase, and over the year it's increased by 12.55%. Keep track of all changes on the US Wall St 30 chart.
US Wall St 30 is just a number that lets you track performance of the instruments comprising the index, so you can't invest in it directly. But you can buy US Wall St 30 futures or funds or invest in its components.