fall led to the formation of a rising wedgeThe ONDO price was mostly in the upward wedge and displayed a great uptrend. It got a major upward boost by mid-May 2024 from a symmetrical triangle pattern, hitting the $1.4841 mark.
However, sell-offs from the supply level washed away its gains. The fall led to the formation of a rising wedge, which was precisely a bearish pattern.
In the month of August, the price showed a bullish presence from lower support, as on Aug 5th, it showed a liquidity grab candle.
With the recently witnessed pullback formation, making ONDO approach the lost level of $0.875, and sustenance above ChoCh could ignite another rally.
Regarding ONDO price advancement, the resisting interruptions could be at $0.8752 and $1.0502, respectively. On the contrary, the loss of the support level of $0.6649 would lead to further descent.
ONDOUSD.P trade ideas

Indicator Perception & A Forecast For ONDO Price
With the recently witnessed liquidity grab candle, bullishness has been identified. But, the confirmation for the bullish trend to resume would be clear once ONDO Reacquires the lost level of $0.875.
The EMA band of 50 days has been above the price, which showcased the price broadly in the bearish territory. Despite that, due to a liquidity grab built on the chart, a resurgence gesture has been witnessed in RSI from extremely oversold territory, where it was last at 29.81. Likewise, the MACD histogram has reduced toward the zero line; based on a more bullish force, a bull cross is anticipated.
In the case of ONDO price advancement, the resistance could be present at $0.875 and $1.042, respectively. On the contrary, the loss of the demand zone would lead to a lower low, depending on the bears' strength.

What Does ONDO Price Tells Its Audience On Daily Chart? Lets Dec
The ONDO had given a breakout earlier in mid-May 2024 from a symmetrical triangle pattern and topped $1.47. Still, the supply pushed away, which formed support at $0.8752 by July 8th in resonance with BTC price activity.
The broader picture showcases on the daily chart that the usual price performance used to be in an upward channel, but as BTC dipped, the ONDO fell more devastatingly and breached the channel's lower border. The overall sentiment turned bearish as its price structure became bearish, forming a bearish pattern, precisely a rising wedge pattern.
Despite the bearish overall sentiment, the hopes are still alive as the ONDO price has resurged from a critical support level on July 8th. However, the BTC stopped as it encountered resistance, and so did the ONDO price, which was met at $1.15.
Looking more closely, once the BTC crosses the historical level of $66K for the upside, the ONDO would most likely surpass the $1.15 hurdle. Once this possible hypothesis becomes a reality, the ONDO could re-enter its upward channel and continue its trading activity in the wedge.

MACD shows a bearish cross due to the dip ONDO facedAn analyst, Cryptochimpanz, optimistically tweets on the X platform that as long as the ONDO Finance price stays and holds above the $1.050 level on the daily chart, the price could witness 2x gains toward the $2.0 Mark.
On analyzing the ONDO daily chart with reference to the Cryptochimpanz optimistic tweet, the price trades above 50-day EMA. It has been following the upward parallel channel since its inception.
Overall, looking at the 6-month performance, in accordance with the CMP, the price has surged 297.87%, and the 3-month performance showed a surge of 81.56%. Despite the bold price performance, in the last 15 days, the price dipped -30% from the upper boundary and formed support at $1.00.
The MACD shows a bearish cross due to the dip ONDO faced as it followed the decline of BTC, but the MACD is above the zero line, which means the price is still bullish. The RSI has turned around, as it took a U-turn, which is currently flashing at 51.03.
Therefore, if the ascend continues, the price could approach the upper boundary of the wedge and could aim towards $1.50 and $1.75; beyond this, the door could open for more growth. However, failing the $1.0 support could lead to the nearest support at $0.70.

Ondo (ONDO) Crypto Holds The Third Spot, Gaining over 64%. Ondo (ONDO) Crypto Holds The Third Spot, Gaining over 64%.
After a 64% rally this month, Ondo crypto set its All time high of $1.48, a few days ago. The crypto witnessed an impressive rally breaking out of a correction phase in May and has brought up its value from a low of $0.73.
At the time of writing, the ONDO price was moving south from the All time high, but the crypto still has bullish factors which could push the price back to higher levels. With a live market capitalization of $1.70 Billion, it has 1.3 Billion tokens out of a total 10 Billion tokens.
Currently, the crypto was retracing the recent support of $1.16 which if breached may trigger a profit booking towards the psychological level of $1. However, if the buying volume inflows, the price may rise back towards the record highs of $1.48 level.

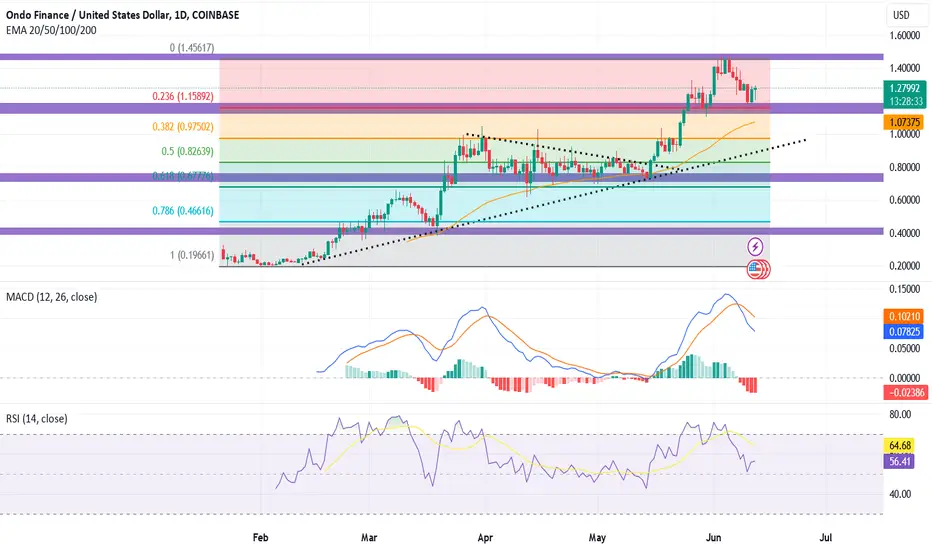
ONDO's price is finding support at the 0.236 FiboOndo Finance (ONDO) has been charting a bullish course, adhering to an upward trendline. The Fibonacci retracement levels paint a picture of resilience and growth, with the price notably leaping from the 0.786 Fibo level on March 19th to the 0.382 level by March 31st. Despite a period of gains that couldn't be sustained, ONDO entered a phase of consolidation, fluctuating within the 0.382 and 0.618 Fibo levels.
This phase of equilibrium was followed by a return to the upward trendline on May 15th. By June 4th, the price had achieved a significant milestone, hitting the $1.45 mark, having successfully breached the 0.382 and 0.236 Fibo levels.
Currently, ONDO's price is finding support at the 0.236 Fibo level. Should it descend below this level and the previous swing low, there's a potential for a retracement towards the 0.382 and 0.5 Fibo levels. Conversely, if ONDO's price bounces back from the 0.236 level, it could set course to potentially set a new all-time high (ATH), surpassing the $1.45 resistance.
Therefore, resistances are $1.45, and $2.00, and supports are $0.975, and $0.826.
Ondo Misses The Top, Sill Secures The 2nd Top Gainer of the weekOndo Misses The Top, Sill Secures The 2nd Top Gainer of the week!
Ondo was on the verge of leading the weekly gainers if it had maintained its intraday high. Yet, facing resistance at the crucial $1 mark and the yearly high, it saw an 8% erosion from its intraday gains, leaving it with a modest 1% increase for the day.
Nonetheless, Ondo has achieved a substantial weekly appreciation of approximately 21.9%. Currently, ONDO is ranked 66th in terms of market capitalization, which stands at $1.336 billion.
The daily trading chart indicates that Ondo has broken out of a month-long consolidation phase and is now trading close to its yearly peak. The pullback from these levels suggests a strong bearish presence, hinting that the bulls may enter a period of consolidation or correction before they can breach the significant $1 threshold

Bullish price actionMaking higher lows and higher lows and now took support again, going for higher high. Looks like will break resistance ($0.9-$1) very easily. Going for upward run.
