$ONDO Could Be the Next 20x Gem: Are You Ready?LSE:ONDO Could Be the Next 20x Gem: Are You Ready?
Currently in bearish breakdown, but if price falls below $0.50, IMO best accumulation zone starts.
Strong Support Zones:
Support 1: $0.53–$0.46
Support 2: $0.24–$0.20
Targets (Long Term): $5 / $10 (~20x from entry if filled)
Manage risk & DYOR, huge upside if supports hold!
Trade ideas

ONDO, thanks ONDO is perpective a big growth.
The past trade results in a 100% without drawdown, just few consolidation phases.
TRADE
entrance 0.85
TP 1.73 max target fibo
SL 0.68
✅ TP TAKEN :
RR 1.95 +37%
days 10
drawdown 0%
max consolidation -9,9%
now i aspect a drawdown or a reversal since the uptrend line was broken and a 0.618 on sell was satisfied. The daily bearish fibo last targets hit 0.65$ but it's more likely to stop around 0.80-0.85$ and recover the inefficiency.
keep updated
M

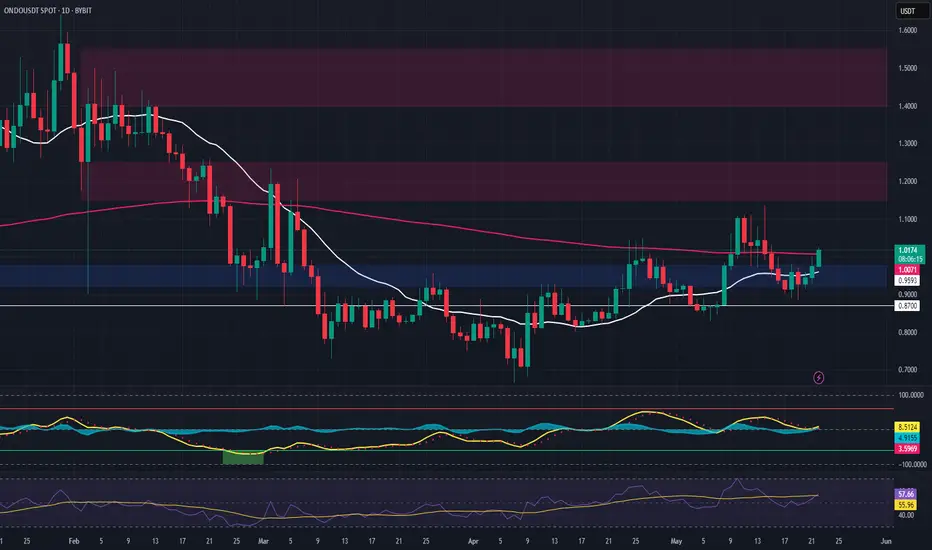
ONDO – Long Spot Trade Setup from 20-Day SMA ReclaimONDO is showing early signs of strength by reclaiming the 20-day SMA following a successful retest of both the SMA and key horizontal support. This confluence signals a potential continuation of the uptrend and presents an attractive long spot opportunity.
🔹 Entry Zone:
$0.92 – $0.97 (support + 20-day SMA confluence)
🎯 Take Profit Targets:
🥇 $1.15 – $1.25 (recent high & resistance cluster)
🥈 $1.40 – $1.55 (macro target zone, possible extension if trend strengthens)
🛑 Stop Loss:
Just below $0.87 (tight invalidation if price breaks below local structure and SMA)
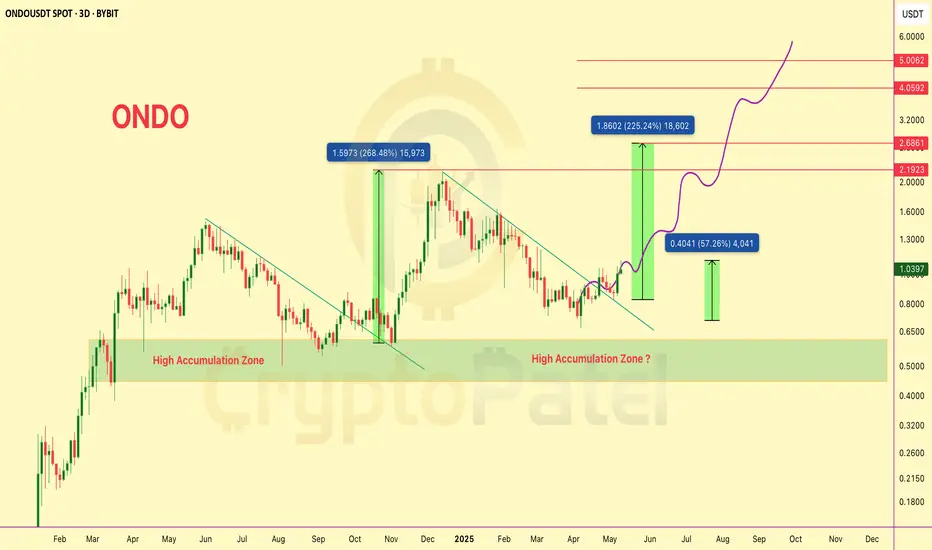
$ONDO/USDT Technical Analysis – Next Move Loading?$ONDO/USDT Technical Analysis – Next Move Loading?
#ONDO just broke out of a long-term descending trendline resistance and is now preparing for its next major wave.
We already shared the dip-entry below $0.80 — and it’s now up 57% from that zone!
Hope you're enjoying the ride.
Chart Highlights:
▶️ Clear breakout from multi-month downtrend.
▶️ Price bounced strongly from the High Accumulation Zone ($0.80-$0.50).
▶️ Previous breakouts resulted in +268% and +225% rallies.
▶️ Short-term move toward $1.30–$1.40 possible if support holds.
▶️ Targets: $2.19 → $2.68 → $4.05 → $5.00+
A healthy pullback or consolidation above $1 could offer the next breakout leg toward $2+.
Stay alert. Accumulation looks complete, and momentum is shifting bullish fast.
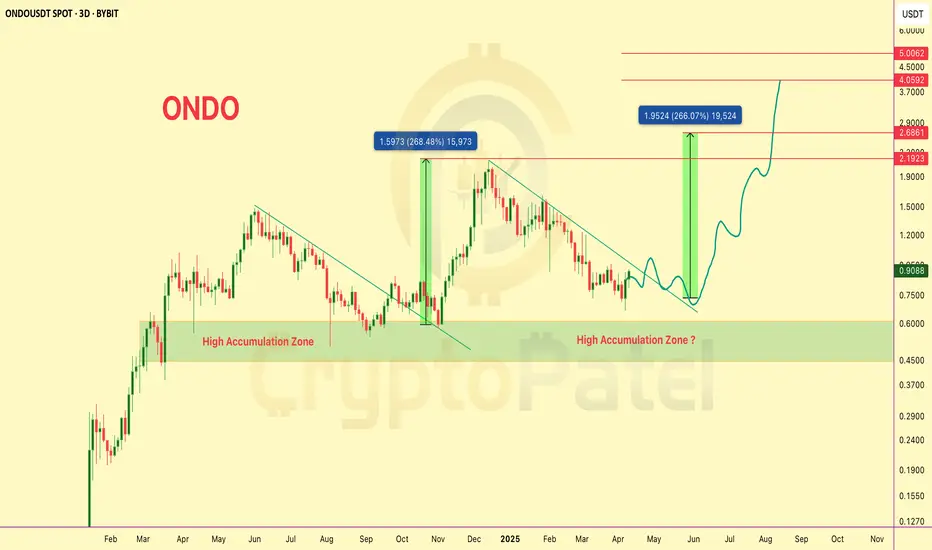
$ONDO/USDT – 3D Chart Analysis (Fractal-Based Outlook)$ONDO/USDT – 3D Chart Analysis (Fractal-Based Outlook)
🔰 Pattern Recognition & Fractal Analysis:
▪️ ONDO previously broke out from a falling wedge pattern in late Q4 2024, resulting in a +268% rally.
▪️ Current price action mirrors that historical fractal, again forming a descending channel with strong demand visible around the $0.60–$0.45 zone — marked as a High Accumulation Zone.
🔰 Current Market Structure:
▪️ Price has respected the descending resistance trendline and now shows signs of breakout attempt.
▪️ A recent bullish engulfing candle near the lower boundary of the accumulation zone suggests potential reversal.
▪️ Volume is picking up, aligning with previous breakout volume behavior.
🔰 Key Technical Zones:
▪️ Accumulation Zone: $0.60 – $0.45
▪️ Immediate Resistance: $1.20 (psychological)
▪️ Breakout Confirmation: Weekly close above $1.30
▪️ Fibonacci Extensions:
1.618 Fib Target: $2.18
2.618 Fib Target: $2.68
Final Bullish Extension: $4.05–$5.00 zone
🔰 Future Projection (Fractal Repeat):
▪️ If breakout mirrors previous fractal, expect ~266% upside — targeting $2.60+ in the next 2–3 months.
▪️ Intermediate pullbacks likely near $1.50 and $2.20 due to historical liquidity zones.
⚠️ Risk Management Note:
▪️ Invalidity below $0.45. If price fails to hold the current range, possible revisit to $0.30–$0.25 range.
▪️ Traders should monitor for volume confirmation and potential bullish divergence on LTFs (Lower Timeframes).
📌 For more real-time analysis, stay tuned. More fractal setups dropping soon.
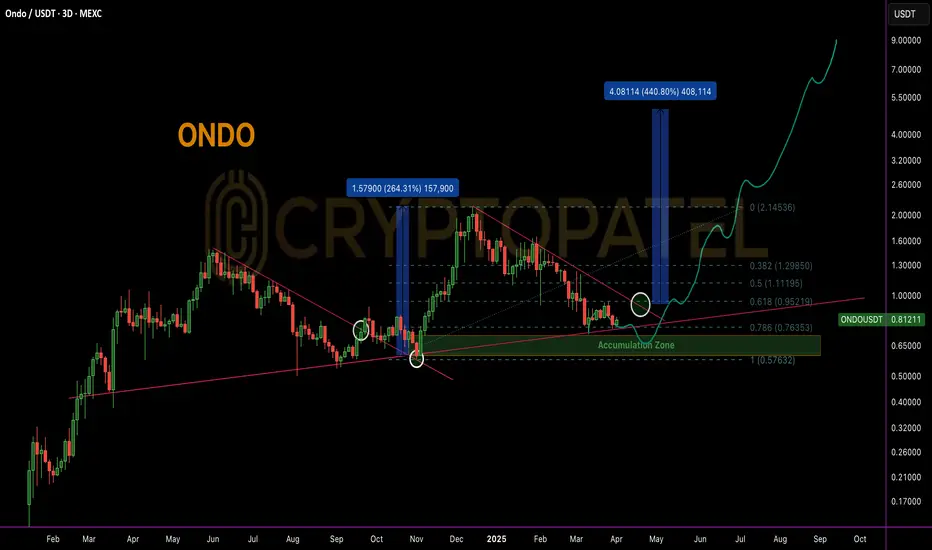
$ONDO Near Golden Entry Zone: Is $ONDO Ready for a 5x Move?LSE:ONDO Technical Analysis & Bull Market Outlook
LSE:ONDO is currently trading near a key accumulation zone, aligning with the 0.786 Fibonacci retracement level, which historically signals a high-probability bounce area in strong trending markets.
Accumulation Strategy
Ideal accumulation zone lies between $0.80 - $0.60. DCA (Dollar-Cost Averaging) approach recommended on major dips for optimal positioning before the breakout confirmation.
Historical Breakout Behavior
In the last HTF (High Time Frame) breakout, ONDO delivered a +200% move post-breakout. Based on current consolidation and market structure, a potential 400%-500% upside is anticipated if similar breakout structure plays out.
Upside Targets in Bull Case: $2/$5/$10
Why Still Bullish?
* Clean structure on daily and 4H TFs.
* Strong demand near 0.786 FIB.
* Institutional interest confirmed:
Trump’s World Liberty Finance acquired 342,002 LSE:ONDO , investing $505,218 at an average entry of ~$1.47 — current price is trading ~45% lower, indicating strong long-term conviction.
Not financial advice. Strictly TA-based view. Manage risk accordingly.
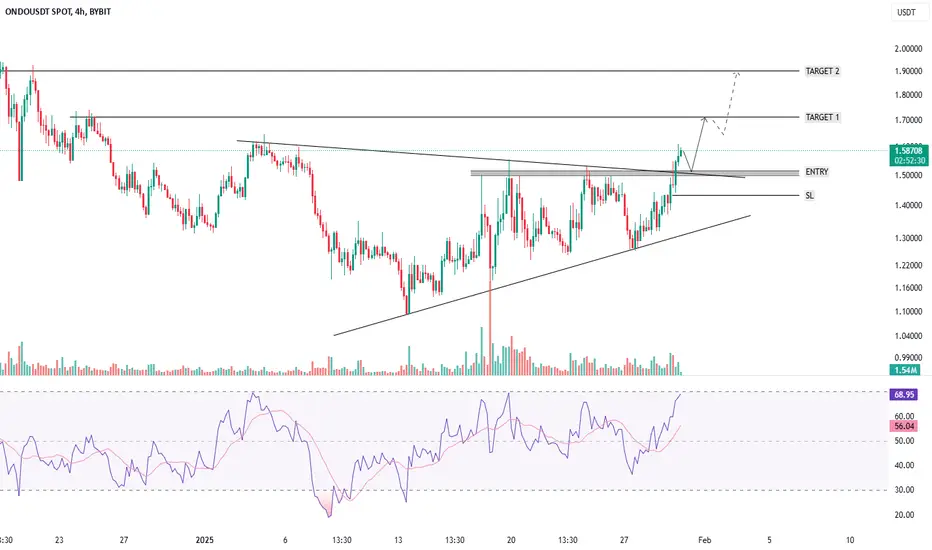
ONDOUSDT - TRIANGLE PATTERN BREAKOUT - BULLISH OUTLOOKSymbol - ONDOUSDT
ONDOUSDT continues to demonstrate an upward trend, with periodic cyclical counter-trend corrections. The chart is currently indicating a potential conclusion of the correction phase, suggesting a readiness for further upward movement. A significant consolidation pattern has developed within the context of the prevailing uptrend. In this regard, the price is attempting to break above the consolidation resistance (triangle) and surpass the next key resistance level at 1.538. This level is of particular importance. Should the bulls successfully maintain support above 1.538, ONDO may experience a recovery towards the 1.7–1.9–2.15 range in the short to medium term.
Support levels: 1.538, 1.44
Resistance levels: 1.7344, 1.90
A minor pullback to support, followed by a false breakdown, remains a possibility. However, sustained price consolidation above this level would confirm readiness for upward movement. Entry, SL & Target levels are indicated on the chart.
Has BLACKROCK's PUMP for ONDO begun?BYBIT:ONDOUSDT 1D
1. From January 9 to 29, the coin price was in a narrow range of re-accumulation, as evidenced by the pattern on the OBV chart marked with a purple rectangle.
2. A similar re-accumulation can be seen on the holy chart in the purple rectangle.
3. The volume engulfing sales pattern marked with a red arc was a good entry point for longs with targets at the top of the range.
EXPECTATIONS :
1. The price moves beyond the upper range to the liquidity area at 1.91 and a false breakout and subsequent correction (during which you can look for an entry point for a short-term long)
2. Smooth further movement with a renewal of historical highs in the next 2-3 months

Technical Analysis OndoThe current technical analysis for Ondo (ONDO) shows a mixed sentiment across various time frames. Here are Chart for your refecence

ONDO - BuyONDO is one of the good token in RWA category.
Trend has changed to bullish - Orange. When BTC pair changes to bullish, a massive pump will be seen.

ONDO TRADE IDEA#ONDO FINANCE
Ondo Finance is a cutting-edge RWA (Real World Assets) project, building the next generation of financial infrastructure to enhance market efficiency, transparency, and accessibility.
⚡️ Accumulation Opportunity: Consider accumulating ONDO within the specified buy zone for potential gains in the short to mid-term.
🔈Buy Zone: $0.75 - $0.70
Selling Targets:
• Target 1: $0.98 (Short-term)
• Target 2: $1.12
• Target 3: $1.28
• Target 4: $1.50
🚨 Stop-Loss: $0.64
💡 Analysis: ONDO is gaining volume and has claimed the 200, 100, and 50 EMAs. A breakout is anticipated soon, making this an ideal time to accumulate in #Spot within the buy range.

ONDO NET BULL RUN TARGET ONDO Crypto Coin: Buy at $0.61 for a Target of $17 Based on Neo Wave and Time Analysis**
This analysis suggests a strong buy for ONDO at the current level of $0.61, with a target price of $17. The forecast is based on Neo Wave theory and time analysis, indicating a significant upward potential.
1. **Current Price Level:**
- ONDO is currently trading at $0.61, presenting a favorable entry point for investors.
2. **Neo Wave Analysis:**
- The Neo Wave theory, an advanced form of Elliott Wave analysis, identifies a corrective wave pattern that has completed its cycle.
- The current wave structure suggests the beginning of a new impulsive wave, which typically leads to substantial price increases.
3. **Time Analysis:**
- Time analysis indicates that ONDO is at the end of a consolidation phase.
- Historical data shows that similar patterns have led to significant price movements within a specific timeframe.
- The projected timeline for reaching the target price of $17 is within the next 12-18 months.
4. **Technical Indicators:**
- Moving Averages: The 50-day and 200-day moving averages are converging, indicating a potential bullish crossover.
- RSI: The Relative Strength Index is currently at 45, suggesting that ONDO is neither overbought nor oversold, providing a balanced entry point.
- MACD: The Moving Average Convergence Divergence indicator shows a bullish divergence, supporting the upward trend prediction.
5. **Market Sentiment:**
- Positive market sentiment and increasing adoption of ONDO's underlying technology are additional factors that could drive the price upwards.

#ONDO - Capitalizing on a DeFi Game-Changer
Description
ONDO is quickly becoming a prominent player in the decentralized finance (DeFi) space, offering unique features and a strong value proposition. Key fundamentals of ONDO include:
- **Innovative Yield Strategies:** ONDO provides users with access to structured yield strategies, allowing for a more tailored approach to earning returns in the DeFi ecosystem.
- **Partnerships and Integrations:** The ONDO protocol has secured significant partnerships with leading DeFi platforms, enhancing its utility and adoption across the industry.
- **Risk Management Tools:** ONDO offers built-in risk management features that help users navigate the volatility of the DeFi market, making it a safer option for investors.
- **Growing User Base:** As more users recognize the benefits of ONDO’s unique offerings, the platform is experiencing steady growth, contributing to its long-term potential.
Given these strong fundamentals, ONDO presents a compelling buy opportunity for investors looking to engage with a transformative force in the DeFi sector.
Disclaimer
Trading and investing in cryptocurrencies involve significant risk and can result in substantial losses. The content provided here is for informational purposes only and should not be considered financial advice. Always conduct your own research, consider your risk tolerance, and consult with a financial advisor before making any investment decisions. Past performance is not indicative of future results, and the value of investments can fluctuate widely.

ONDO MARKET ANALYSIS Amid huge market crash all over the world, ONDO was one of the coins which quick rebound and nicely recovered loss. The chart shows that 0.55 was critical level which it cleared in quick session. But it didn't clear resistance at 0.72 level. Current price is good looking new support.
First major resistance is 0.90 region if it successfully crosses 0.72 level.
Currently we are looking for 0.90 pr8ce level then 1.20 level in short & mid term.

ONDO: Inverse Head and Shoulders Signals Upcoming Breakout🚀💎 Paradisers, after significant consolidation, #ONDOUSDT is showing an inverse head and shoulders pattern, which increases the likelihood of a bullish move.
💎 If #ONDO breaks above the resistance level and closes a candle above it, this will validate the inverse head and shoulders pattern, and we can then expect a bullish move.
💎 In the case of a pullback, we can expect a bounce from the bullish Order Block (OB) + Fair Value Gap (FVG) zone. Remember that if the price goes below the right shoulder, it will invalidate the inverse head and shoulders pattern.
💎 However, if the price doesn't show any bullish signs at the bullish OB and falls below it, closing the candle below, then it will invalidate our idea. In that case, it would be better to wait for more favorable price action to develop.

ONDO-USDT BUY NOWIm Buying ONDO-USDT in Binance
So good to buy with price action
Take profit in this pictures (Tp1 = 1/2 volume, Tp2 = 1/2 volume, Tp3 = All)
Gudluck all!

Are ONDO Bulls Looking For $2 Mark?ONDO has a market cap of $1.31 Billion and is ranked 66th in the cryptoverse. ONDO token has a supply of 10,000,000,000 and 30% of it is circulating in the market. The coin price is currently trading near the value of $0.936 with a gain of 11.2%.
ONDO token price is currently forming strong bullish candles on the daily chart. On the 4 hour chart the asset price is trading above the 50 and 200 Moving Average. Meanwhile on the upside trend the asset price can see a halt near the value of $1.05 and support price can be observed near $0.8
The RSI and MACD of the ONDO token price are in an oversold zone. The overall sentiment of the indicators is bullish.

ONDO: Watch for Potential Shift 🚀💎 ONDO is currently demonstrating a bullish market structure, notably breaking above the bearish order block (OB) with a fair value gap (FVG), indicating a potential shift in sentiment.
💎With ONDOUSDT breaking above the bearish OB, it is now considered a Breaker Block (BB). If the price retraces below the BB and touches the FVG, particularly in the discount zone (Below FIB 50%), and exhibits signs such as CHoCH (Change of Character) or any other bullish indications, it suggests that liquidity within the inner range has been absorbed, potentially setting the stage for a move towards external range liquidity.
💎In simpler terms, I anticipate a bullish move from either the Bullish OB level or the FVG if the price shows signs of CHoCH or other bullish signals.
💎However, if the price breaks down below the bullish OB and the supportive trendline, it would technically be considered bearish. Nevertheless, considering the overall bullish trend in the market, I would disregard this bearish scenario and wait for clearer bullish signals before adjusting trading strategies.
