L&T: Breakout Above Multi-Year Resistance Zone🔍 Technical Analysis
Larsen & Toubro Limited stands as a leading performer in the Infrastructure & Construction sector. Technically, the stock has delivered a super bullish rally spanning over two decades, transforming from below ₹100 to reaching ₹3,860 by April 2024 - representing an impressive 38x+ growth showcasing consistent value creation.
The ₹3,860-₹3,960 zone acted as formidable resistance multiple times over several months. However, October 2025 marked a turning point with positive Q2 FY26 results providing the fundamental catalyst for a decisive breakout above this multi-year resistance zone.
The critical development is that the price has sustained above the breakout level for the past month, demonstrating genuine strength rather than a false breakout. The stock created a new all-time high at ₹4,140 and is currently trading at ₹4,069, consolidating gains near the highs.
Entry Strategy: Fresh entry above ₹4,150 with sustained momentum confirmation.
Targets:
- Target 1: ₹4,300
- Target 2: ₹4,400
- Target 3: ₹4,500
Stop Losses:
- Critical Support: ₹3,860-₹3,960 zone (previous resistance, now support)
No expectations below the ₹3,860-₹3,960 zone as it would invalidate the breakout.
💰 Q2 FY26 Financial Highlights (vs Q1 FY26 & Q2 FY25)
Total Income: ₹67,984 Cr (↑ +7% QoQ from ₹63,679 Cr; ↑ +10% YoY from ₹61,555 Cr)
Total Expenses: ₹59,470 Cr (↑ +7% QoQ from ₹55,655 Cr; ↑ +11% YoY from ₹53,638 Cr)
Financial Profit: ₹8,513 Cr (↑ +6% QoQ from ₹8,024 Cr; ↑ +8% YoY from ₹7,917 Cr)
Profit Before Tax: ₹6,336 Cr (↑ +8% QoQ from ₹5,860 Cr; ↑ +14% YoY from ₹5,555 Cr)
Profit After Tax: ₹4,678 Cr (↑ +8% QoQ from ₹4,318 Cr; ↑ +14% YoY from ₹4,099 Cr)
Diluted EPS: ₹28.54 (↑ +9% QoQ from ₹26.30; ↑ +16% YoY from ₹24.69)
🧠 Fundamental Highlights
Larsen & Toubro delivered exceptional Q2 FY26 performance with consolidated PAT surging 16% YoY to ₹3,926 crore and revenue growing 10% to ₹67,984 crore. The company reported stellar 45% YoY growth in order inflows to ₹1.16 trillion, driving the order book to an all-time high of ₹6.67 trillion (up 31% YoY), providing robust revenue visibility for years.
EBITDA grew 7% YoY to ₹6,807 crore with margins at 10.1%. H1 FY26 consolidated PAT jumped 22% to ₹7,543 crore on 13% revenue growth to ₹1,31,662 crore. International revenues constituted 56% of Q2 revenue at ₹38,223 crore, while international orders accounted for 65% of order inflow at ₹75,561 crore.
The Projects & Manufacturing order book maintains balanced geographic mix with 51% domestic and 49% international. Infrastructure segment dominates with 61% share of order book (₹3.74 trillion), followed by Energy at 30% (₹1.84 trillion), showcasing L&T's core strength in infrastructure and energy.
Strategic initiatives gaining traction include Carbon Light Solutions prospects pipeline at ₹460 billion (doubled from ₹240 billion last year), green & clean energy opportunities at ₹180 billion (up 18x from ₹10 billion), and high-tech manufacturing prospects at ₹310 billion (doubled from ₹160 billion YoY).
The company entered strategic partnership with General Atomics Aeronautical Systems for MQ-series RPAS production to enhance India's defense capabilities. L&T secured major ultra mega orders in Middle East hydrocarbon business and holds L1 position on three bids totaling $4.5 billion in Kuwait with strong pipeline in Saudi Arabia, Qatar, and UAE.
✅ Conclusion
Larsen & Toubro's remarkable two-decade journey from sub-₹100 to ₹4,140 all-time high, backed by exceptional Q2 FY26 showing 16% PAT growth and 45% order inflow surge, validates the infrastructure leadership thesis. Sustained breakout above ₹3,860-₹3,960 resistance with current trading at ₹4,069 provides technical confirmation for next leg toward ₹4,500. Record ₹6.67 trillion order book (31% YoY growth), 65% international order contribution, and balanced geographic mix demonstrate execution excellence. Strategic focus on green energy (₹180 billion pipeline) and defense partnerships provide multi-year growth visibility. Entry above ₹4,150 targets ₹4,500 with strong support at breakout zone.
Disclaimer: This analysis is for educational purposes only. Please consult your financial advisor before making investment decisions. Stock markets are subject to risks.
Larsen & Toubro Ltd.
No trades
Trade ideas

L&T: Breakout Above Multi-Year Resistance ZoneTechnical Analysis
Larsen & Toubro Limited stands as a leading performer in the Infrastructure & Construction sector. Technically, the stock has delivered a super bullish rally spanning over two decades, transforming from below ₹100 to reaching ₹3,860 by April 2024 - representing an impressive 38x+ growth showcasing consistent value creation.
The ₹3,860-₹3,960 zone acted as formidable resistance multiple times over several months. However, October 2025 marked a turning point with positive Q2 FY26 results providing the fundamental catalyst for a decisive breakout above this multi-year resistance zone.
The critical development is that the price has sustained above the breakout level for the past month, demonstrating genuine strength rather than a false breakout. The stock created a new all-time high at ₹4,140 and is currently trading at ₹4,069, consolidating gains near the highs.
Entry Strategy: Fresh entry above ₹4,150 with sustained momentum confirmation.
Targets:
- Target 1: ₹4,300
- Target 2: ₹4,400
- Target 3: ₹4,500
Stop Losses:
- Critical Support: ₹3,860-₹3,960 zone (previous resistance, now support)
No expectations below the ₹3,860-₹3,960 zone as it would invalidate the breakout.
Q2 FY26 Financial Highlights (vs Q1 FY26 & Q2 FY25)
Total Income: ₹67,984 Cr (↑ +7% QoQ from ₹63,679 Cr; ↑ +10% YoY from ₹61,555 Cr)
Total Expenses: ₹59,470 Cr (↑ +7% QoQ from ₹55,655 Cr; ↑ +11% YoY from ₹53,638 Cr)
Financial Profit: ₹8,513 Cr (↑ +6% QoQ from ₹8,024 Cr; ↑ +8% YoY from ₹7,917 Cr)
Profit Before Tax: ₹6,336 Cr (↑ +8% QoQ from ₹5,860 Cr; ↑ +14% YoY from ₹5,555 Cr)
Profit After Tax: ₹4,678 Cr (↑ +8% QoQ from ₹4,318 Cr; ↑ +14% YoY from ₹4,099 Cr)
Diluted EPS: ₹28.54 (↑ +9% QoQ from ₹26.30; ↑ +16% YoY from ₹24.69)
Fundamental Highlights
Larsen & Toubro delivered exceptional Q2 FY26 performance with consolidated PAT surging 16% YoY to ₹3,926 crore and revenue growing 10% to ₹67,984 crore. The company reported stellar 45% YoY growth in order inflows to ₹1.16 trillion, driving the order book to an all-time high of ₹6.67 trillion (up 31% YoY), providing robust revenue visibility for years.
EBITDA grew 7% YoY to ₹6,807 crore with margins at 10.1%. H1 FY26 consolidated PAT jumped 22% to ₹7,543 crore on 13% revenue growth to ₹1,31,662 crore. International revenues constituted 56% of Q2 revenue at ₹38,223 crore, while international orders accounted for 65% of order inflow at ₹75,561 crore.
The Projects & Manufacturing order book maintains balanced geographic mix with 51% domestic and 49% international. Infrastructure segment dominates with 61% share of order book (₹3.74 trillion), followed by Energy at 30% (₹1.84 trillion), showcasing L&T's core strength in infrastructure and energy.
Strategic initiatives gaining traction include Carbon Light Solutions prospects pipeline at ₹460 billion (doubled from ₹240 billion last year), green & clean energy opportunities at ₹180 billion (up 18x from ₹10 billion), and high-tech manufacturing prospects at ₹310 billion (doubled from ₹160 billion YoY).
The company entered strategic partnership with General Atomics Aeronautical Systems for MQ-series RPAS production to enhance India's defense capabilities. L&T secured major ultra mega orders in Middle East hydrocarbon business and holds L1 position on three bids totaling $4.5 billion in Kuwait with strong pipeline in Saudi Arabia, Qatar, and UAE.
Conclusion
Larsen & Toubro's remarkable two-decade journey from sub-₹100 to ₹4,140 all-time high, backed by exceptional Q2 FY26 showing 16% PAT growth and 45% order inflow surge, validates the infrastructure leadership thesis. Sustained breakout above ₹3,860-₹3,960 resistance with current trading at ₹4,069 provides technical confirmation for next leg toward ₹4,500. Record ₹6.67 trillion order book (31% YoY growth), 65% international order contribution, and balanced geographic mix demonstrate execution excellence. Strategic focus on green energy (₹180 billion pipeline) and defense partnerships provide multi-year growth visibility. Entry above ₹4,150 targets ₹4,500 with strong support at breakout zone.
Disclaimer: aliceblueonline.com

L&T on 1W TimeframeStuck in zone for quit a while, now looks like it may show good momentum in upcoming weeks.
Disclaimer: This is just an a price action analysis of stock Tata Motors. Don't consider this as an stock tip or advice. Invest/Trade at your own risk.

LT - RESISTANCE BREAKOUT LT poised for lext level
1) SWING STRUCTURE
2) FIBO LEVELS
3) BREAKOUT
Any dip should be considered as buying opportunity

Tracking the Trend: When Will the Break Come?
The stock continues to consolidate in a sideways trend, and it remains to be seen when this range will break.
Given the company’s strong fundamentals — including a robust order book and tailwinds from increased infrastructure spending — an upward breakout appears more likely.
I’ll keep you all posted as the price action unfolds.

Larsen & Toubro Ltd.(LT)Time cycles are routines that allow you to map a stock movement by measuring the number of days or periods over which the stocks highs and lows occur. But this does not prove whether a reversal will occur in the next time cycle; it is only a possibility.
Regardless of the outcome, the candle formed on the day of the Time Cycle holds significant significance. It's crucial that the market respects this candle, whether it moves up or down. The Time Cycle will often pause briefly near the candle. You'll notice on the chart that this often resembles a support or resistance area.
The candle of the time cycle tells you about the continuity or reversal as well, but you have to forgive the high and low of the candle formed on the time cycle.
You do not have to take any decision on your own. This is its specialty.

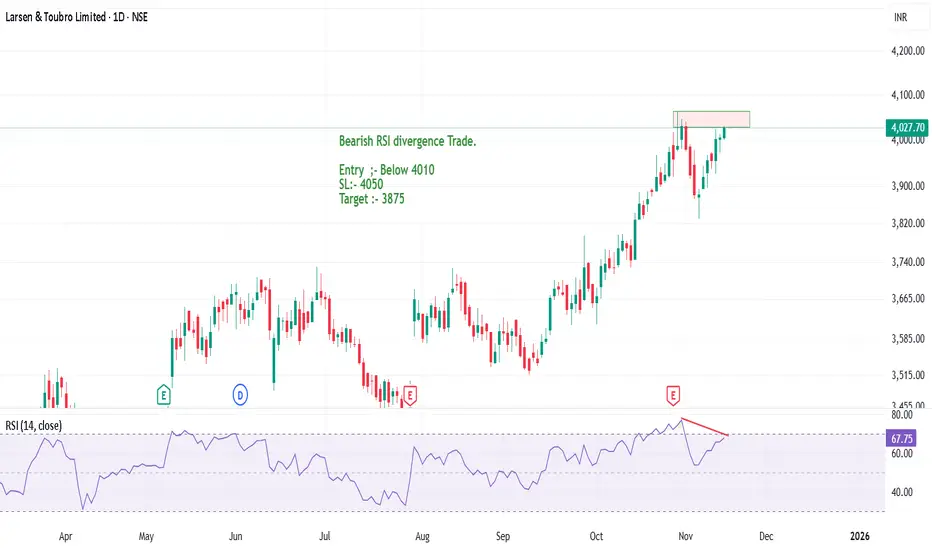
L&T forming a new high or Double Top pattern?Larsen & Toubro is showing a strong bearish RSI divergence on the daily charts. There can be an opportunity to sell the stock in coming trading sessions.
The stock has performed fabulously and good returns has been yeilded by the stock.
If there is a bearish price action, a double top pattern confirmation, good R:R trade can be capture in the stock.
Entry :- Below today's low (4000)
Stop Loss :- 4055
Target :- 3875
A swing trade can be initated in the stock with Target 1 as 3875 and trailing SL for next target upto 3780.
Target 2 can also be made with the help of the 50 EMA.
In case price tries to form a new high is can be shorted only when there is some negative sentiment and price action in the stock.
L&T Multiyear BreakoutLarsen & Toubro Limited - Multi-Timeframe Breakout Analysis
Current Price:4,004.40
CRITICAL SETUP ALERT
L&T is at a pivotal moment with breakouts confirmed on weekly and monthly timeframes. The stock is now in a crucial period that will determine the validity of this range breakout.
KEY TECHNICAL OBSERVATIONS
Weekly Chart Analysis:
- Nearly 1.9 Years of Consolidation (2023-2025) between 3,200-3,800
- Clean breakout above 3,800 resistance with strong momentum
- All major EMAs (20/50/100/200) aligned bullishly
- Long accumulation phase suggests institutional participation
Monthly Chart Analysis :
- Breakout confirmed above 4,250 resistance box
- Strong bullish candle with healthy volume expansion
- EMAs: 20 | 50 |100 I 200 - all rising
Current Status:
✅ Breakout happened on weekly/monthly charts
⏳ Awaiting confirmation via follow-up candle close
📈 Price holding above breakout zone shows strength
🎯 PRICE TARGETS
Based on the range breakout and Fibonacci projections:
- Target 1: 4,451.25 (Immediate resistance)
- Target 2: 4,809.60 (Major psychological level)
- Target 3: 5,424.35 (Extended target - 35% upside)
- Target 4: 5,750+ (Bullish scenario)
📌 CRITICAL LEVELS
Support Zones:
- S1: 3,740 (Breakout retest level)
- S2: 3,611 (20 EMA on weekly)
- S3: 3,419 (Consolidation top - breakdown level)
WHAT MAKES THIS SETUP SPECIAL?
1. Time Factor: 1.9 years of consolidation = strong base building
2. Multi-Timeframe Alignment: Breakout on both weekly AND monthly charts
3. Volume Confirmation: Significant expansion during breakout
4. Long-Term Trend: Steep uptrend from 2020 lows still intact
For Conservative Traders:
- Wait for successful retest of 3,740-₹3,800 zone
- Confirm with strong bounce and volume
- Enter on confirmation with tighter stops
For Long-Term Investors:
- Accumulate on any dip to 3,700-3,800
- Strong fundamental backing (Infrastructure leader)
- Multi-year breakout suggests sustained momentum
- Target: 5,500-6,000 (12-18 months)
- ❌ Failure Signal: Close below 3,740 = False breakout, back to range
What to Watch:
1. Monthly candle close (crucial for pattern confirmation)
2. Volume sustenance above breakout level
3. No bearish engulfing on weekly/monthly timeframe
4. Hold above previous consolidation high (3,800)
DISCLAIMER:
This analysis is for educational purposes only and NOT financial advice.
- Technical patterns may fail; past performance doesn't guarantee future results - Breakouts can be false; always use stop losses - Conduct your own research and consult a financial advisor - The author may or may not hold positions in L&T - Trading/investing involves substantial risk of capital loss - You are solely responsible for your investment decisions
**Trade responsibly with proper risk management.**
#LarsenToubro #LT #Breakout #TechnicalAnalysis #NSE #Infrastructure #RangeBreakout #MultiTimeframe #BlueChip #IndianStocks

L&T (Larsen & Toubro) - Monthly Chart Breakout L&T (Larsen & Toubro) - Monthly Chart Breakout Analysis! 📈
Symbol: LT | Exchange: NSE | Timeframe: 1 Month
🔑 Key Observations from the Chart
Mega Breakout Confirmed: The stock has delivered a decisive monthly close above its long-term resistance and previous all-time high zone around ₹3,861.90. This is a classic, multi-year breakout from a prolonged phase of consolidation and prior price discovery. This move is structurally highly bullish.
Price Action & Volume: The breakout is supported by strong, above-average trading volumes (visible on the monthly bar, especially the most recent one on the right), indicating significant institutional interest and conviction behind the move.
Indicator Strength (RSI): The Relative Strength Index (RSI) on the monthly chart is comfortably in the bullish zone, confirming the underlying momentum. The indicator has turned upwards from a level that avoided the "overbought" zone (a sign of strength in an uptrend), suggesting more room for expansion.
Previous Support (The Base): The stock formed a strong base of support in the range of ₹2,965 to ₹3,200 over the past year (the green zone). This zone, especially the horizontal green line at ₹2,965.30 (which marks the low of the major dip in 2023-2024), acts as a critical long-term anchor.
🎯 The Trade Setup: Bullish Outlook
1. Breakout & Target Projection:
The clean breakout above the ₹3,860 - ₹3,900 resistance zone opens the doors for the next major leg up.
Immediate Target (T1): The next logical psychological and horizontal resistance is at ₹4,400.
Mid-Term Target (T2): Based on recent price action and broader market outlook, a target of ₹4,567.70 (the red line drawn on the chart) and beyond towards ₹5,000+ is now in play.
2. Key Levels to Watch:
Crucial Support (Breakout Retest): The breakout level, now acting as support, is around ₹3,860 - ₹3,900.
Invalidation/Stop-Loss: A decisive monthly close below the swing low of the recent consolidation zone, conservatively placed around ₹3,650, would signal a potential failure of the breakout and require a review of the bullish thesis.
💡 Analyst's View
The robust technical setup, coupled with strong fundamental tailwinds in the infrastructure and capital goods sector, makes L&T a top pick for the coming quarters. The multi-year breakout is a high-conviction signal for long-term investors and positional traders.
Disclaimer: This is for educational and analysis purposes only and is not a financial recommendation. Always do your own research (DYOR) before investing.
#LT #LarsenAndToubro #StockMarketIndia #TechnicalAnalysis #Breakout #Nifty50 #InfrastructureStocks #IndianEquities

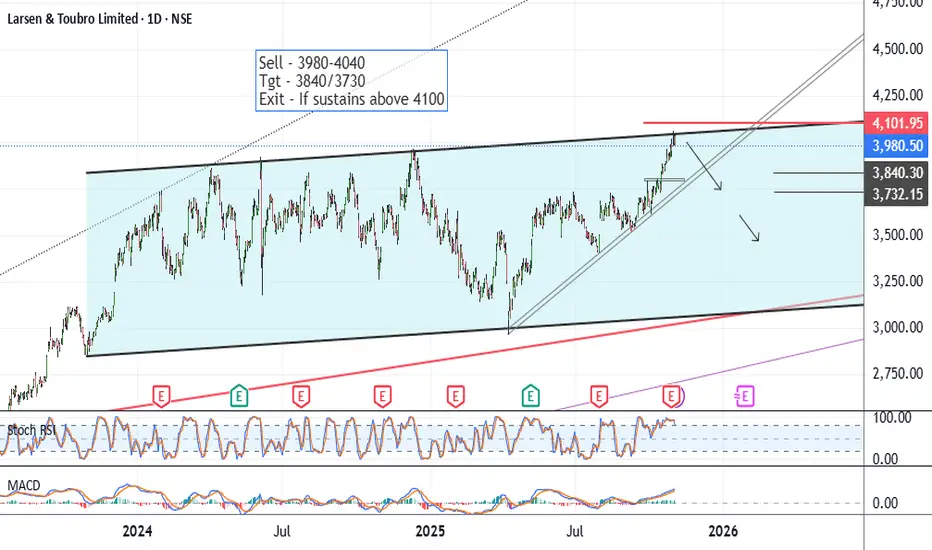
LT - Positional Short SetupCMP 3980 on 04.11.25
In the last 2 years, the stock has been traveling in a rising wedge pattern. At present, it has reached higher levels. If it reverses from these levels, there could be a short opportunity.
All important levels are marked on the chart.
Possible targets may be 3840/3730 or even more downside, depending upon the scenario.
If it sustains above 4100, the exit plan should be exercised.
All the above illustrations and descriptions are for educational and observation purposes only. It is not a buying or selling recommendation.
All the best.
LT market structure shift LT bullish setup, 30 ema above 50 ema above 100 ema and market structure shift, stoploss below 50 ema closing basis, risk rewar 1:2
Larsen & Toubro (L&T) financial update and key features for 2025:
Market Capitalization: Approximately ₹3.6 lakh crore
Revenue (FY 2025): ₹2.26 lakh crore (~$27 billion), showing steady growth
Net Profit (FY 2025): ₹16,000 crore+, reflecting solid profitability
Earnings Per Share (EPS): Around ₹55-60
Price to Earnings (P/E) Ratio: In the range of 30-35, indicating reasonable valuation for the industrial sector
Business Segments: Engineering & Construction, Manufacturing, Financial Services, IT and Technology Services
Order Book: Strong and diversified, exceeding ₹5 lakh crore, underpinning future revenue visibility
Dividend Yield: Around 1.2%-1.5%
Long-term Growth Drivers: Large infrastructure projects in India, government focus on urbanization and defense manufacturing, digital & technology expansion
Financial Health: Robust balance sheet with low debt and strong cash flows
L&T remains one of India's premier conglomerates with a diversified portfolio and stable financial metrics, well-positioned to benefit from rising infrastructure and industrial spending

L&T near breakout zoneL&T is consolidating in the upper end of the channel, a break out above 4000 would give a big move towards 5000 in the short term(6 -12 months) and over a longer time frame of 2years can even see levels of 8000+

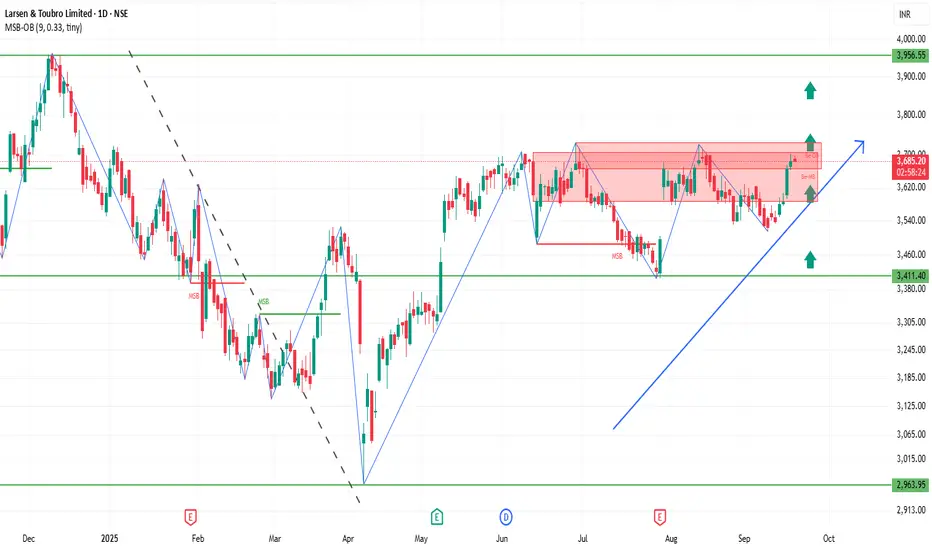
Larsen & Toubro: Wave 3 Heating Up — Eye on the Final 5After a clean impulse from ₹2,965 to ₹3,708 (Wave 1) and a extended flat correction to ₹3,405 (Wave 2), Larsen & Toubro has resumed its upward journey in what appears to be an extending Wave 3 .
Structure in Focus
Wave 3 reached the 1.618 × Wave 1 projection near ₹3,969 — an ideal zone for minor profit-taking.
A short-term Wave 4 pullback could unfold toward ₹3,860 – ₹3,795 (Fib 0.236–0.382 retrace).
As long as price holds above ₹3,727 (invalidation) , the structure stays firmly impulsive.
Once Wave 4 confirms, a final Wave 5 rally could target ₹4,180–₹4,250, extending as high as ₹4,300 if momentum persists.
Bigger Picture
L&T remains a heavyweight within the Nifty 50, and its impulsive rhythm may just be the hidden engine powering Nifty’s climb.
If this count plays out, a fresh high in L&T could easily set the tone for the index to follow suit.
Disclaimer: This analysis is for educational purposes only and does not constitute investment advice. Please do your own research (DYOR) before making any trading decisions.

LT 1 Day Time Frame 📈 Current Price Snapshot
Current Price: ₹3,827.25
Day's Range: ₹3,744.30 – ₹3,841.40
52-Week Range: ₹2,965.30 – ₹3,963.00
Market Cap: ₹5.27 lakh crore
Volume: 1,160,071 shares
The stock is trading near its 52-week high, reflecting strong bullish momentum.
📊 Technical Indicators
Relative Strength Index (RSI): Approximately 70, indicating the stock is in overbought territory.
Moving Averages:
50-Day MA: ₹3,650
200-Day MA: ₹3,500
MACD: The MACD line is above the signal line, confirming upward momentum.
Pivot Points:
Support: ₹3,744
Resistance: ₹3,841
The stock is trading above its moving averages, indicating a strong bullish trend.

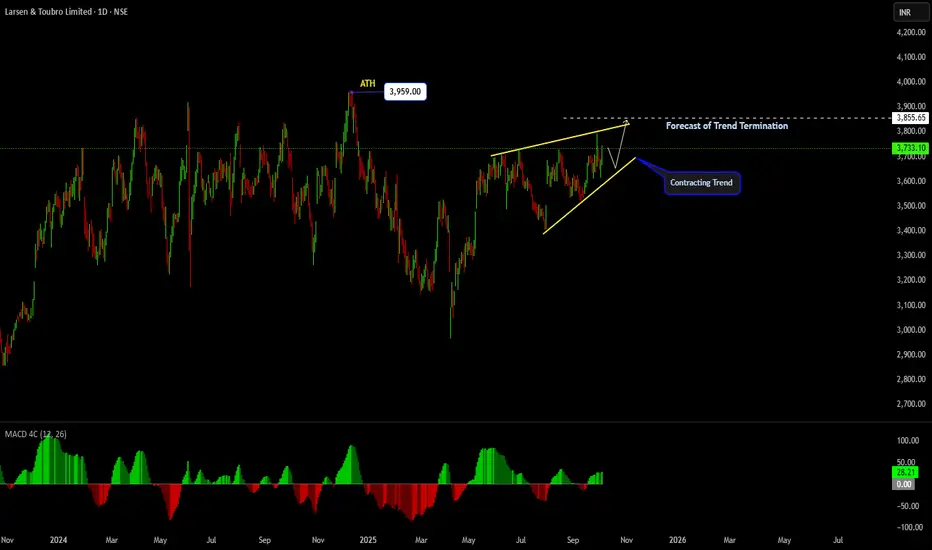
Contracting TrendMost People Try to look for patterns that are created in the Market
Few Go to extent of Coding the pattern Identification
I love Manual scanning then rushing for some thing that still Yet to become patterns
I have put up my view
This is education content
Good luck
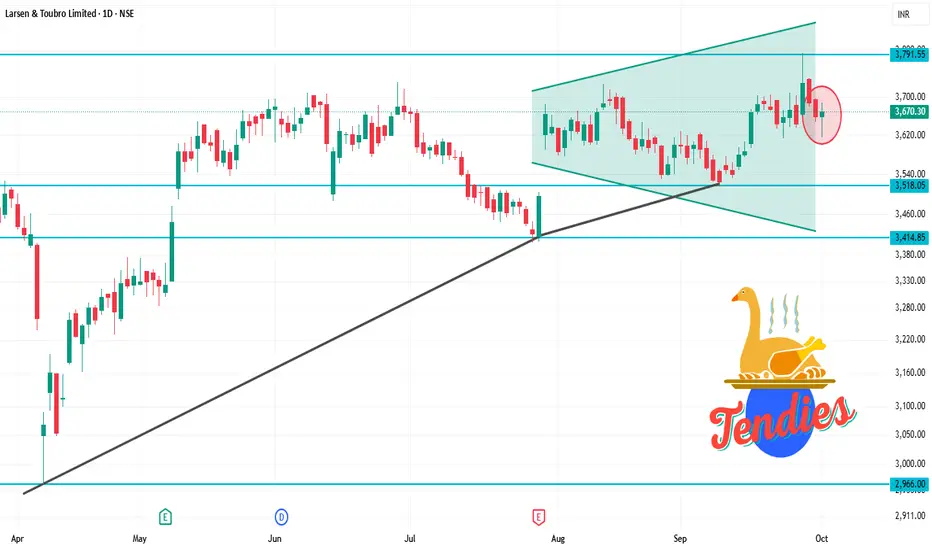
LT 1D Time frameCurrent Snapshot
Current Price: ₹3,670.30
52-Week High: ₹3,963.50
52-Week Low: ₹2,965.30
Strategy & Outlook
Bullish Bias: The stock is in a short-term uptrend with positive momentum indicators.
Buying Opportunity: Consider entering near support zones (₹3,600–₹3,650) with a target towards ₹3,700–₹3,750.
Risk Management: Place stop-loss orders below the support levels to manage potential downside risks.
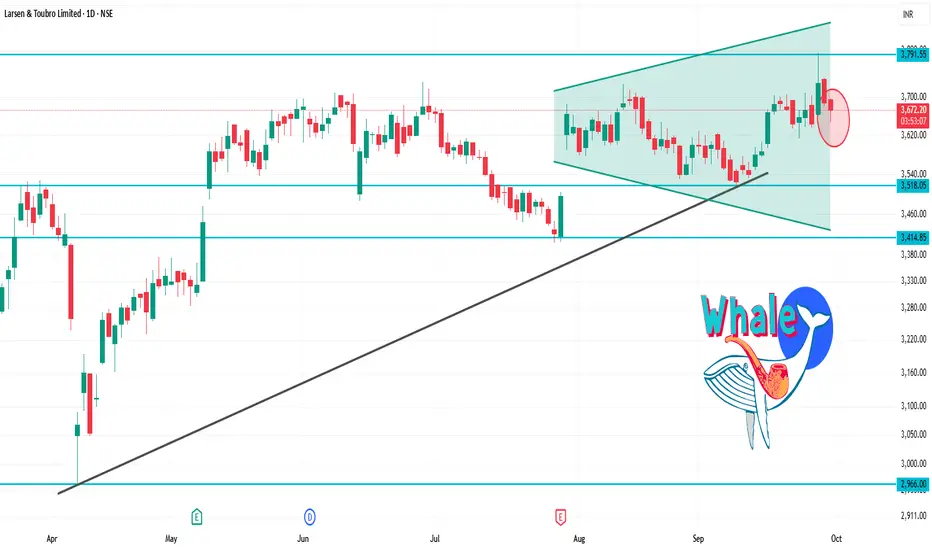
LT 1D Time frameCurrent Price: ₹3,655.30
Day’s Range: ₹3,648.00 – ₹3,696.60
52-Week Range: ₹2,965.30 – ₹3,963.50
Technical Indicators
RSI (14-day): 41.19 — indicates a neutral to slightly bearish momentum.
MACD: -1.47 — suggests bearish momentum.
Moving Averages: Mixed signals — short-term averages are bearish, while long-term averages are bullish.
Technical Summary: Predominantly Sell signals across various indicators.
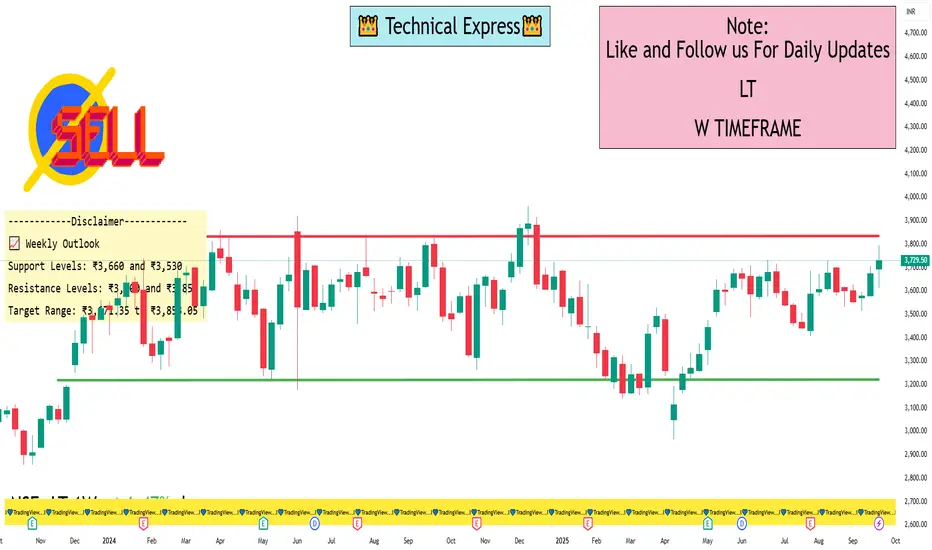
LT 1 Week View📊 Weekly Price Range (Sep 22–26, 2025)
High: ₹3,794.90
Low: ₹3,661.00
Closing Range: ₹3,642.15 – ₹3,731.10
Average Closing Price: ₹3,673.80
Trading Volume: Significantly above average, with 241,575 shares traded on September 26, compared to the 50-day average of 126,661 shares.
🔧 Technical Indicators
Relative Strength Index (RSI): Indicates bullish momentum.
Moving Averages: Both 50-day and 200-day moving averages suggest a positive trend.
MACD & Stochastic Oscillator: Both indicators are aligned with upward momentum.
Volume Delivery: High delivery volumes suggest strong investor confidence.
📈 Weekly Outlook
Support Levels: ₹3,660 and ₹3,530
Resistance Levels: ₹3,800 and ₹3,850
Target Range: ₹3,671.35 to ₹3,853.05
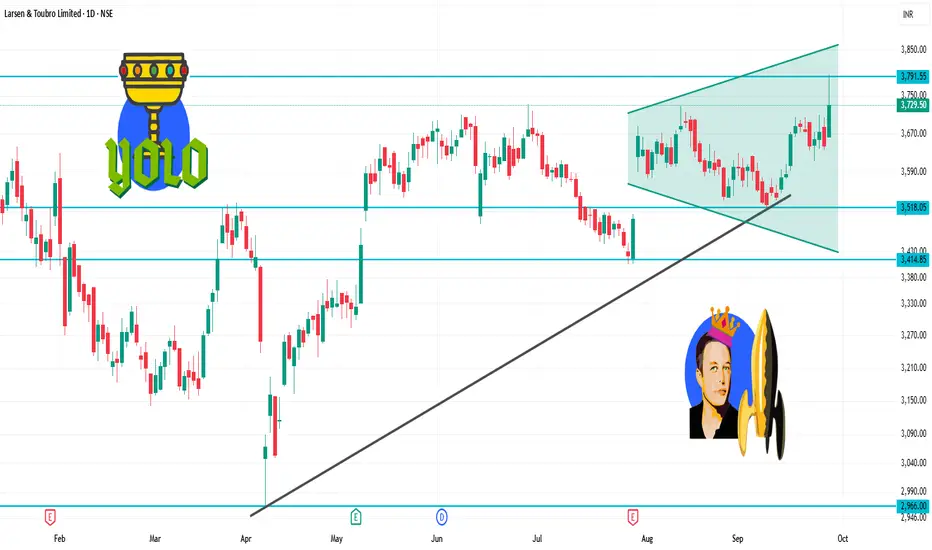
LT 1D Time framePrevious Close: ₹ 3,644
Today Open: ₹ 3,664
Day’s High: ₹ 3,795
Day’s Low: ₹ 3,661
Current / Last Traded Price: around ₹ 3,730
⚡ Strategy
Bullish Side:
Buy on dips near ₹ 3,700 – 3,720 with stop loss below ₹ 3,660. Target ₹ 3,760 → ₹ 3,795.
Bearish Side (Only if Weakness):
If price falls below ₹ 3,660, short opportunities may open toward ₹ 3,600.
Larsen & turboL&T Stock holding its current uptrend showing a very good strength in comparison of its mother index nifty 50 direction. its gowing againest tide look at this, very useful insight at this time.

LT 1D Time frameClosing Price: ₹3,644.40
Day’s Range: ₹3,635.70 – ₹3,704.00
Previous Close: ₹3,657.60
Change: Down –0.80%
52-Week Range: ₹2,965.30 – ₹3,963.50
Market Cap: ₹5.13 lakh crore
P/E Ratio (TTM): 32.31
Dividend Yield: 0.93%
EPS (TTM): ₹112.81
Beta: 1.20 (indicating moderate volatility)
🔑 Key Technical Levels
Immediate Support: ₹3,635 – ₹3,640
Immediate Resistance: ₹3,700 – ₹3,710
52-Week High: ₹3,963.50
52-Week Low: ₹2,965.30
📈 Technical Indicators
RSI (14-day): 45.2 – indicating a neutral condition.
MACD: Negative, suggesting bearish momentum.
Moving Averages: Trading below the 50-day and 200-day moving averages, indicating a bearish trend.
📉 Market Sentiment
Recent Performance: L&T experienced a decline of 0.80% on September 25, 2025, underperforming the broader market.
Volume: Trading volume was significantly higher than its 20-day average, indicating increased investor activity.
📈 Strategy (1D Timeframe)
1. Bullish Scenario
Entry: Above ₹3,700
Stop-Loss: ₹3,635
Target: ₹3,750 → ₹3,800
2. Bearish Scenario
Entry: Below ₹3,635
Stop-Loss: ₹3,700
Target: ₹3,600 → ₹3,550

LT longLT can touch 4001 levels within this month
Inverted head and shoulder pattern has created successfully now waiting for breakout.

LT 1D Time frameCurrent Snapshot
Price: ₹3,695 (slightly higher than yesterday’s level).
Stock is holding near resistance but still above strong supports.
Trend is bullish to sideways.
📌 Key Levels
Immediate Resistance: ₹3,740 – ₹3,800.
Immediate Support: ₹3,650 – ₹3,670.
Stronger Support: ₹3,600, and deeper support near ₹3,100 on longer timeframe.
✅ Outlook
If LT sustains above ₹3,670, bulls remain strong and a breakout above ₹3,740 could push toward ₹3,800+.
If it falls below ₹3,650, then short-term weakness may test ₹3,600.
As long as it stays above ₹3,600, the larger trend remains intact.