LT Jumps on Strong Q1 FY26 Results, Continues Steady Climb WithiTopic Statement:
LT surged nearly 6% after posting impressive Q1 FY26 earnings, reinforcing its position within a mildly bullish up-trending channel.
Key Points:
1. The stock may experience temporary bullish momentum driven by strong quarterly results
2. It continues to trade within a mildly bullish up-trending channel, making channel-based trading reliable
3. Two trend lines on the chart highlight the ongoing trend strength and underlying support for the stock
4. Since recovering from COVID in 2021, the price has consistently remained above the 200-day EMA, reflecting long-term bullishness
LTOUF trade ideas

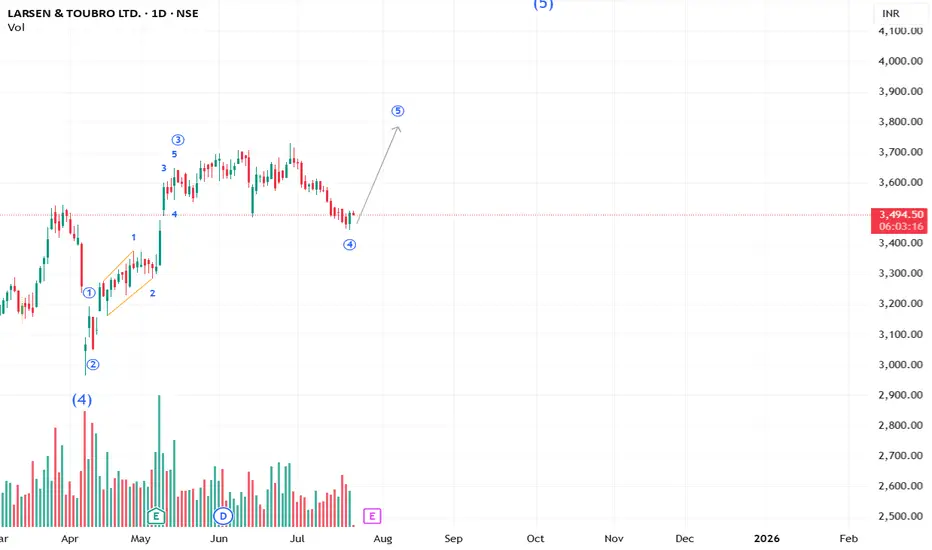
The last move on the way in LT? #LT We may see an upside in LT to finish the last wave 5 to go above 3732. Don't risk more than 2% of your capital on any trade.
**This analysis is based on the Elliott Wave Principle.
This analysis is for educational purposes only and not investment advice.
Please consult your SEBI-registered advisor before making any investment decisions. Markets are subject to risk.**
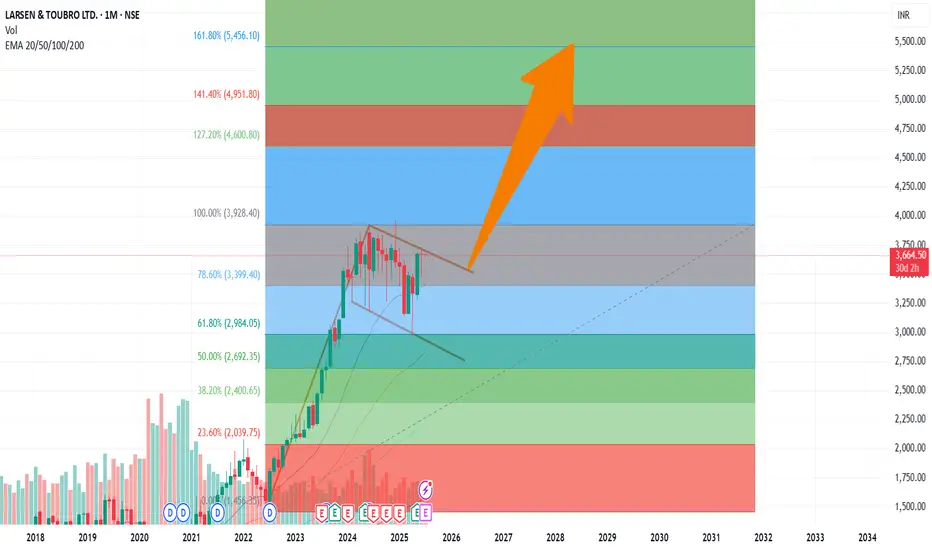
Larsen Accumulate Target 5400 - Wait for BreakoutLarsen is currently in long term channel and the breakout from this will give a rally.
Wait for Breakout from channel.
Target 1 - 3900
Target 2 - 4200
Target 3 - 4800
Target 4 - 5400
No stop loss
This is long term view

Larsen & Toubro Ltd. (L&T)Market Outlook:
Analysts are optimistic about L&T’s growth, particularly due to its international order pipeline, which is expected to constitute over half of its order book next year. Elara Securities upgraded L&T to an "accumulate" rating with a target price of ₹4,051, citing its diversified portfolio and global opportunities.
Larsen & Toubro Ltd. (L&T ) is a $30-billion Indian multinational conglomerate headquartered in Mumbai, specializing in engineering, procurement, and construction (EPC) projects, high-tech manufacturing, and services. It operates across multiple sectors, including infrastructure, defense, energy, and technology, with a strong global presence. Here’s a concise overview based on recent developments:
Recent News and Performance (as of June 3, 2025) :
New Contracts: L&T secured significant orders worth ₹1,000–2,500 crore from the Rajasthan government for water supply and fluorosis mitigation projects in Jhunjhunu and Ajmer districts, involving its water and effluent treatment business. These include EPC contracts for rural water supply and system strengthening.
Financial Performance: For Q4 FY25, L&T reported a 25% year-on-year increase in consolidated profit after tax to ₹5,497 crore and an 11% rise in revenue to ₹74,392 crore. The company won orders worth ₹3,56,631 crore in FY25, reflecting an 18% growth.
Dividend: L&T declared a final dividend of ₹34 per share for FY25, pending shareholder approval.
Stock Performance: On May 9, 2025, L&T’s stock surged 3.12% to ₹3,424.1, outperforming the BSE Capital Goods index. Over the past month, it gained 11.93%, compared to 8.77% for the index. The stock hit a 52-week high of ₹3,963 on December 10, 2024, and a low of ₹2,967.65 on April 7, 2025.
Defense Expansion: L&T is scaling its defense business, aiming for multi-billion-dollar growth, driven by India’s military modernization and export opportunities. It recently developed TEER, an in-house aerial target system for weapons testing.
Legal Developments: The Supreme Court provided relief to L&T by disposing of its appeal against the Mumbai Metropolitan Region Development Authority (MMRDA) as "infructuous" after MMRDA scrapped a ₹14,000 crore tender process where L&T was disqualified.
Other Ventures: L&T is expanding its shipbuilding facilities at Kattupalli, Chennai, with a ₹1,000 crore investment and exploring fabless semiconductor chip design.
Key Business Segments:
Infrastructure: Major projects include water supply, roads, bridges, and urban development.
Defense: Manufacturing naval vessels, defense equipment, and systems like TEER.
Energy: Focus on renewable energy, clean energy, and transmission projects, especially in the GCC region.
Technology: L&T Finance Ltd. reported a record ₹2,644 crore profit after tax in FY25, with a ₹2.75 dividend, while LTIMindtree, another group company, announced a ₹45 dividend.

LTLT
consolidated entire day
keep an eye
buy only above 3723
for target zone near 3803/3937
swing trade

Larsen & Tourbo LtdWaiting for Breakout If stock broke 3675 with good volume. You can expect good rally in the stock. Good Luck

L&T Maintains Bullish Momentum Within a Rising ChannelTopic Statement:
L&T is in a strong bull run, consistently moving higher within a clear uptrending channel.
Key Points:
The stock is moving upwards in a bullish uptrending channel, making channel-based trading straightforward
It continues to gain momentum as it respects the channel boundaries
The price has overextended above the 200-day EMA, suggesting the stock is highly overbought and may face short-term resistance

LT ready to touch 4000CUP pattern in W.
Taken support on the MA and broken them.
RSI is strong with divergence.
waiting for few days of consolidation before boom.

LT 15 MINS TF GOLDEN CROSSOVERGolden crossover 9 EMA and 200 EMA
9 EMA is cutting 200 EMA from down. This is a golden crossover and price is expected to move up and If you zoom out the chart and have a look at it we will be able to see price trying to make HH and HL.

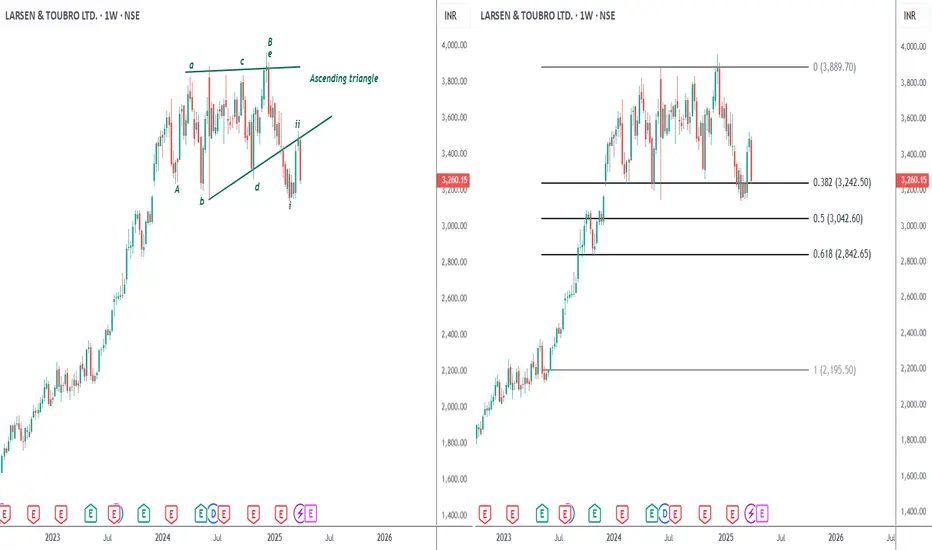
this wave is devastatingL&T CMP 3260
Elliott - the 3rd of C is the most devastating. This is one stock where I can see the 3rd has started. This wave falls like a knife. Below 3242 it will rush to 3K and 2840. In my view this wave will not finish before 2200.
Conclusion - we all know the thrust of a triangle is very powerful on either side. The test from below was an opportunity. Strong stocks showing weakness is extremely bad news.
Larsen & Toubro: At Key Support After Strong Multi-Year RallyTechnical Analysis:
L&T has shown a strong bullish sentiment over the past two decades. The stock has experienced significant growth, with notable annual increases:
2021: +47.24%
2022: +10.02%
2023: +69.05%
2024: +2.32%
The stock created an all-time high of ₹3,963.5 in December 2024, followed by a phase of profit booking and correction. Currently, L&T is consolidating within the ₹3,100-₹3,300 support zone, which has served as strong support multiple times in February, May, June, and October 2024. The stock's next move within this zone will determine its future trend.
In this bullish rally, we have observed multiple instances where the stock faces a major resistance, breaks out, and then the same resistance turns into a support, leading to new higher highs. This pattern has been consistent since 2018, reinforcing the stock’s bullish structure.
Currently, the stock can either:
Break out from the support zone and move towards an All-time high, or
Break down from the support zone, retest it as resistance, and continue a correction phase.
For a bullish scenario, traders should watch for strong support confirmation with bullish candlestick patterns. For a bearish scenario, the stock must show strong rejection from support with bearish patterns.
Fundamental Analysis:
L&T's Q3 FY25 results showed strong revenue growth, though profitability was impacted by rising costs. Below are the key financial metrics (values in ₹ crore):
Total Income: ₹64,668 in Q3 FY25, ₹51,024 in Q2 FY25, ₹55,128 in Q3 FY24.
Total Expenses: ₹59,460 in Q3 FY25, ₹46,302 in Q2 FY25, ₹50,290 in Q3 FY24.
Total Operating Income: ₹5,208 in Q3 FY25, ₹4,722 in Q2 FY25, ₹4,838 in Q3 FY24.
Profit Before Tax: ₹5,333 in Q3 FY25, ₹5,555 in Q2 FY25, ₹4,772 in Q3 FY24.
Profit After Tax: ₹4,001 in Q3 FY25, ₹4,113 in Q2 FY25, ₹3,595 in Q3 FY24.
Diluted Normalized EPS: ₹24 in Q3 FY25, ₹25 in Q2 FY25, ₹21 in Q3 FY24.
Quarterly Performance Insights:
L&T's Q3 net profit rose 14% YoY to ₹3,359 crore, though it missed expectations due to EBITDA margin contraction of 70 basis points to 9.7%.
Operating margins were impacted by a 50% increase in raw material and component costs and a 16% rise in construction material consumption.
Revenue was expected to increase 18% YoY to ₹65,065 crore, with net profit projected to increase 24% YoY from ₹2,947 crore.
L&T secured ₹1,16,036 crore in new orders, reflecting 53% growth YoY.
Infrastructure projects saw an order inflow of ₹49,070 crore, up 13.6% YoY.
Conclusion:
L&T has a strong long-term bullish structure, with higher highs and higher lows. The ₹3,100-₹3,300 support zone is crucial for the stock’s next move. A breakout above this zone with strong volume could push L&T towards an All Time High, while a breakdown could signal further profit booking.
Disclaimer: This analysis is for educational purposes only. Investors should conduct their own research before making any trading decisions.


Larsen & Toubro Ltd. (L&T) is a potential short candidateA. Breakdown from a Late-Stage Base
Trend: The stock appears to have formed a late-stage base with multiple failed breakout attempts.
Breakdown Confirmation:
The price is trading below key moving averages (50-day, 150-day, and 200-day).
B. Trading Below Key Moving Averages
The stock is currently below the 50-day, 150-day, and 200-day moving averages.
The 50-day (shorter-term trend) has crossed below the 150-day and 200-day MAs, indicating a bearish trend.
C. Weak Bounces & Rally Attempts
There have been failed bounce attempts in previous sessions.
Volume appears low on up days and high on down days, suggesting distribution by institutions.
D. Support Breakdown
The stock is hovering around a major support level (~3,271-3,340 INR).
If this support breaks convincingly on high volume, it could trigger a further sell-off.
Next support level: 3,031 INR (potential profit target).
2. Entry & Risk Management for Short-Selling
Entry:
Ideal entry would be below 3,270 INR with strong selling volume.
A short entry on a weak rally into resistance (~3,340-3,405 INR) could also be considered.
Stop-Loss:
Place a stop above the 50-day MA (~3,502-3,529 INR).
If price reclaims the 50-day MA on strong volume, the short thesis is invalid.
Profit Target:
First Target: 3,031 INR (previous major support).
Extended Target: If it breaks 3,031 INR, further downside is possible.

Impulse Wave 3 Completion & Wave 4 Correction Ahead!Based on Elliott Wave Theory, it appears that the third impulsive wave has reached completion, signaling the beginning of the fourth corrective wave. According to the rules of wave analysis, wave four typically retraces less than 38.2% of wave three. Additionally, the second corrective wave retraced more than 50% based on Fibonacci levels, further confirming its structure and the initiation of the third wave. Given these factors, a potential target of 2381 is anticipated for the corrective phase.

View on Larsen and Toubro (L&T) L&T current price: 3458 on 1/02/2025
The stock has taken support at 3407 but unable to cross 3630 after testing it twice, now this level is acting as Resistance, if fails to trade above this level we can see it trading a range of 3630-3407.If the stock sustains above 3630, we may upside move to 3800-3900.

LT buy or SellToday we can see bounce back from bottom 3400.
Price trading between support zone 3400 to 3480. When price break below 3433 then we can think for bearish trend and if price break above 3444 then we can go for up trend.

Larsen And Toubro Positional Short Trade Setup!L&T Sell Positional - 3420, With Stop - 3455, For Target - 3250.

L&T breaking outL&T came out of the channel breakout and testing the support, it should be a good buy if price close above 3650

LT | A rollercoaster indeed!Points to be noted:
-------------------------------------------
1. A symmetrical triangle breakdown was done. Then price retested it and followed up the selling.
2. This follow-up was exhausted by a violent reversal back to the retest point.
3. This reversal was further cemented by a HH-HL breakout of the triangle.
4. Now a new demand zone has been created at 3520. This is good place to initiate long.
---------------------------------------------
Entry - 3525, Tgt - 3852, SL - 3450
---------------------------------------------
Disclaimer: This idea is NOT a trade recommendation. Please make your own analysis before entering trades

Trade Idea for LARSEN & TOUBRO LTDTrade Idea for LARSEN & TOUBRO LTD.
Technical Overview
The chart highlights a strong resistance zone near 3,727–3,750 , which has been tested multiple times. This is a key level to watch for a potential breakout.
Price is currently taking support at the 200 EMA (black line), showing a critical area for bulls to step in.
This is a pre-breakout trade designed to capture the impulse breakout move if the price successfully breaches the resistance zone.
Trade Setup
Entry:
Enter the trade once the price confirms a W pattern or any other bullish pattern on a smaller time frame (e.g., 1H or 4H) near the current level.
Alternatively, wait for the breakout above 3,750 with strong bullish candles.
Stop Loss:
Place the stop loss below the 200 EMA or the recent swing low, around 3,550 , to manage risk effectively.
Target Levels:
Initial Target: 3,950 – A conservative target aligned with the measured move from prior breakouts.
Extended Target: 4,100–4,150 – Based on the previous impulse move of ~677 points .
Risk/Reward Ratio:
This trade offers a 1:4 risk/reward ratio , providing a high probability of favorable returns.
Additional Notes
RSI: Currently at 46 , showing neutral conditions but watch for a bullish crossover.
Volume: Monitor for increasing volume near the resistance zone to confirm breakout strength.
This trade requires patience to wait for a bullish setup on lower timeframes.
