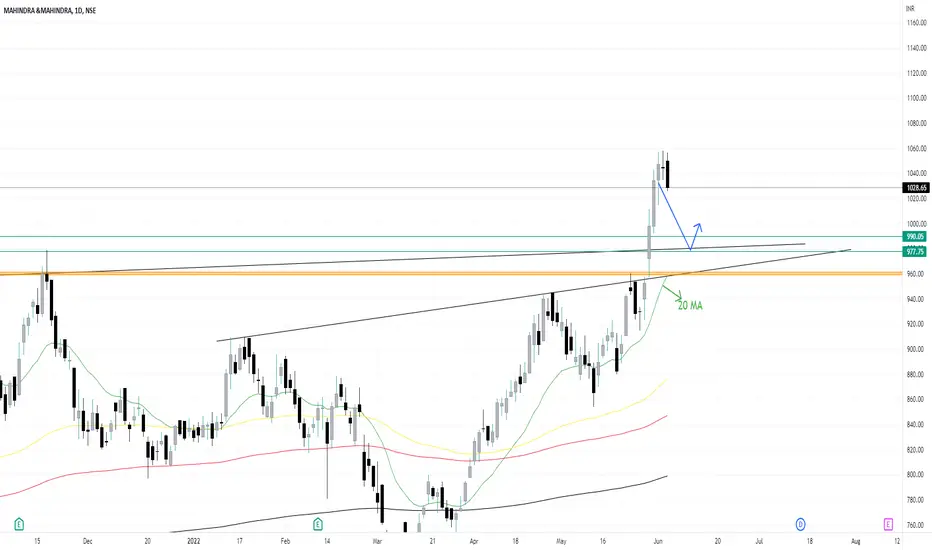
Probability of Break Out and RetestLookout for the 20 MA. High probability that the price could come down for a retest at 20 MA . Enter on the close of a green bar after touching 20 MA.
MAHMF trade ideas
EVENING STAR PATTERN IN DAILY TIME FRAME M_M all time high & good time for short.Because market are bearish & sideways.

4 Years Breakout Mahindra & Mahindra About 4 Years #Multiyear #Breakout in #M_M (Mahindra & Mahindra Ltd)
Mahindra and Mahindra has given a good breakout and one can ride this stock for medium term (6-12 months)
ONLY FOR #educational
NOT SEBI REGISTERED. #LEARNEARN (DONT TRUST ANYONE)
Note : - invested in #M_M
#nifty50 #sharemarket #BREAKOUTSTOCKS #Multibagger #sharemarket #sharemarketindia #sensex #technicalanalysis #kukiinvest #Chartanalysis #headandshoulders #doubletop #doublebottom #parallelchannel

swing trade idea for M&Mtrend line breakout then retested
going with strong up trend
running above 200 DMA

M&M | Simple trendline breakout - Looks potential for 15%M&M | Simple trendline breakout - Looks potential for 15%
CMP : 840
SL : 700
Target : 960
1:3 risk reward setup

Mahindra and MahindraMahindra and Mahindra has given a good breakout and one can ride this stock for medium term (6-12 months) while keeping a stop loss at 958.

M&M - BreakoutAuto stocks seem to be on fire and one of the stocks making an ATH is M&H.
Nice C&H breakout.
Surely a buy on retest candidate. The new Safari has been launched. Soon their EV cars will be launching in a sequence.
Long at CMP or on retest. (ideally retest). Stoploss below 975.

M&M- INVERTED HEAD & SHOULDERS PATTERN BREAKOUT.M&M- Inverted Head & Shoulders Pattern Breakout Daily Time Frame. Only Education Purpose .

Multi year breakout M&M brokeout this trendline after almost 4years with great volumes wait for weekly close for confirmation.then we can initiate a long trade. NOT FA


M_M is looking good at this levelM_M is crossing major resistance level.
So look for some good opportunity.
id fm short term stocks.

long term BUY M&M M&M looking super strong with the target of 1750 for long term.
M&M is trading at all time high and broken the resistance by making V-shape pattern in monthly chart.

M&MThe stock has been silently resisting the downfall also known as Relative Strength and that is where usually the next leaders emerge from. In a conducive market, such stocks are off the fences. Could this emerge as a probable new leader once things settle down and the market turns for the good? For now, it has given a good break out and with other auto names running, this could be seen as a good bet here for a positional long play.

#M&M - POTENTIAL BO STOCKS#M&M - POTENTIAL BO STOCKS
CMP : 952.85
Disclaimer : We are not Sebi registered analyst or Authorized analyst
The charts / Levels / Price projections are only for educational purpose.
This is our personal view, Pls consult your financial advisor before taking decision - Buy / Sell
We will be not responsible for your profit and Loss
Please like and retweet if you like this idea.

MAHINDRA AND MAHINDRA LONGMahindra and mahindra would go on a bullish trend
rational: ascending channel, above 200sma
entry point above the trendline. stop loss at the support line. target at the resistance line created by the double top. Accuracy: 70%. hold period 3 to 6 months. back-test for false breakout NSE:M_M

Mahindra and Mahindra Chart Analysis !!📈 M&M 📉
My Findings :-
1. Breakout from downtrending trenline zone.
2. Higher High and Higher Low Formation.
3. Close Above March 2022 High.
Bias- Long
Target- 901 and 960
SL- 822
RR- 1: 2.5
All Important Supports and Resistances are drawn in chart. All levels are on closing basis.
Please have a look and revert back if you need some more study on it.
Disclaimer : Consult Your Financial Advisor Before Taking Any Decision On This Analysis.

M_M Long !NSE:M_M
Multi year BO level , Weekly Time Frame !
Wait for strong close above the trendline on Weekly basis.

Ready for BreakoutMahindra and Mahindra is near its resistance zone and ready for breakout.
Wait and Watch this stock.

M_MM_M: Looking Good
Expecting Multi Years Trend Line Breakout Above 980
Buy Above/CMP 941.90 Add Every Dip Stop-Loss Closing Below 890 (Safe) 840 (Risky)
Target 990-1040-1095-1150+++
Positional Call


Mahindra Breakout ViewMahindra:
Trendline Breakout done
Approaching Resistance
Long only above 947 with SL 935

Mahindra and Mahindra short term buyTrade stratergy:
Hr retracement done + 15 Min tf trend line formation and head and shoulder pattern formation. when market broken the trend line then enter the trade.

