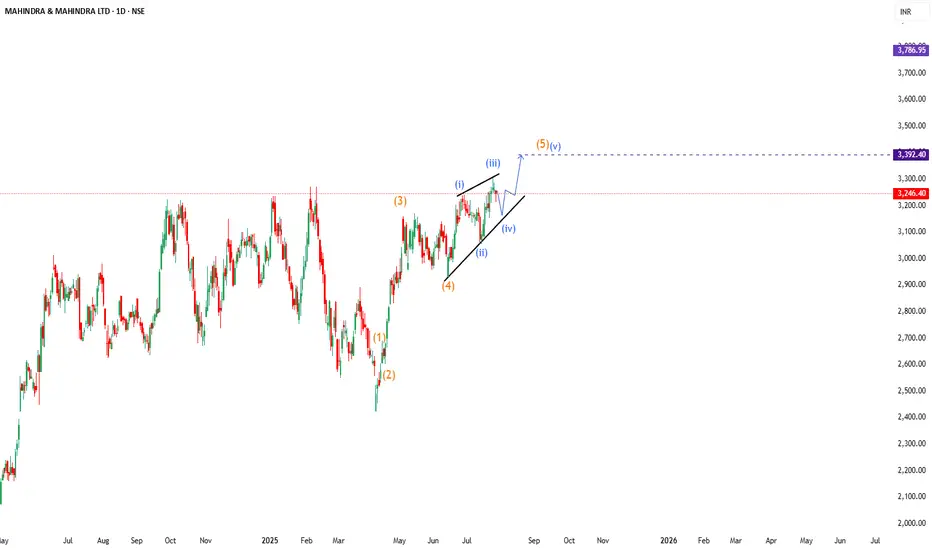
Wave Theory Applied , Ending Diagonal Pattern I have been Using Wave Theory for over a 20 Years in my Life and every time I see Patterns
which are logical & Self Explanatory I know what i am looking at ,
In this pattern Friends i see an Ideal pattern which ends the Motive wave after an strong
momentum in its prices ,
I have always said market repeat in itself , I wonder how people interoperation would be
This is education content if you have any Questions please feel free to comment below i will try
to explain
Good luck
Trade ideas
M&M Short term Swing trade with 1:3.5 RRIf Nifty holds its current level of 24,600 and is not bearish for next two-three trading sessions then
there are high chances that this setup will work and buyers will take control in M&M.
It is a supply & demand + Trend + Liquidity Trap based setup.
The setup looks good but the only concern is the overall market sentiment so take your risk accordingly.
Good Risk to Reward for first Target is 1:3.5
Let me know if you have any questions or doubts.
Happy to help!
Gaurav.

M&M _ Rising Wedge Formation📊 M&M – Technical & Educational Snapshot
Ticker: NSE: M&M | Sector: 🚙 Auto
CMP: ₹2,7XX (as of 16 Aug 2025)
Rating (for learning purpose): ⭐⭐⭐⭐
Pattern Observed: 📉 Rising Wedge Formation (Bearish Reversal Case Study)
🔑 Key Reference Levels (For Learning)
Support / Breakdown Zone: Lower wedge trendline
Resistance / Rejection Zone: Upper wedge trendline
Bearish Projection (Case Study): ~₹2,410
Bullish Continuation (Alternative View): ~₹3,300
📌 Pattern Observations
✅ Price forming higher highs & higher lows but within converging trendlines
✅ Momentum slowing → smaller swings inside wedge
✅ Typical bearish reversal structure (confirmation needed)
✅ Volume + RSI divergence can add conviction
📝 STWP Trade Analysis (Educational Illustration Only)
1️⃣ Bearish Breakdown (Primary Scenario)
Observation: Breakdown below wedge support often studied as bearish signal
Stop Loss (Learning Reference): Above upper wedge / recent swing high
Downside potential: ₹2,410 (measured move projection)
2️⃣ Bullish Breakout (Alternative Scenario)
Observation: Breakout above wedge resistance may lead to continuation
Stop Loss (Learning Reference): Below wedge / recent swing low
Upside potential: ₹3,300
📊 Risk Management & Confirmation
Traders typically wait for daily close outside wedge boundaries
Volume confirmation is key → spikes above average strengthen the move
RSI divergence often adds confidence to the setup
📌 Summary (Learning View Only)
The M&M Rising Wedge is a classic reversal study.
Key lesson: A wedge pattern teaches how slowing momentum can shift market control — but confirmation with volume + price close is essential before validating either direction.
⚠️ Disclaimer – Please Read Carefully
The information shared here is meant purely for learning and awareness. It is not a buy or sell recommendation and should not be taken as investment advice. I am not a SEBI-registered investment advisor, and all views expressed are based on personal study, chart patterns, and publicly available market data.
Trading — whether in stocks or options — carries risk. Markets can move unexpectedly, and losses can sometimes be larger than the money you have invested. Past performance or past setups do not guarantee future results.
If you are a beginner, treat this as a guide to understand how the market works — practice on paper trades before risking real money. If you are an experienced trader, remember to assess your own risk, position sizing, and strategy suitability before entering any trade.
Consult a SEBI-registered financial advisor before making any real trading decision.
By reading, watching, or engaging with this content, you acknowledge that you take full responsibility for your own trades and investments.
________________________________________
💬 Found this useful?
🔼 Give this post a Boost to help more traders discover clean, structured learning.
✍️ Drop your thoughts, questions, or setups in the comments — let’s grow together!
🔁 Share with fellow traders and beginners to spread awareness.
✅ Follow simpletradewithpatience for beginner-friendly setups, price action insights & disciplined trading content.
🚀 Stay Calm. Stay Clean. Trade With Patience.
Trade Smart | Learn Zones | Be Self-Reliant 📊
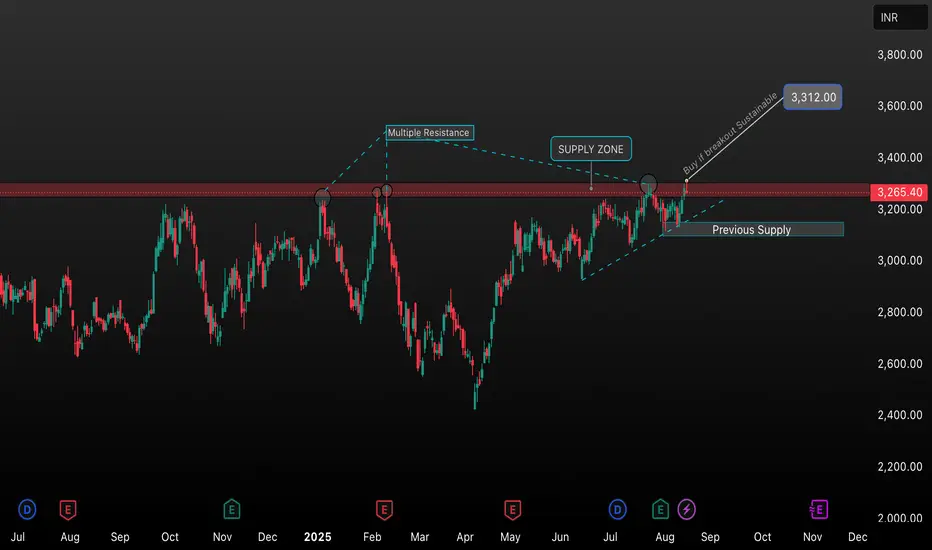
M&M Key Resistance Breakout – Supply Zone AnalysisThis chart highlights the crucial price action of M&M around the 3,265–3,300 INR supply zone. The region has acted as multiple resistance points in the past, making it a significant barrier for bulls. The current move shows a potential breakout above this supply zone, with a breakout target projected towards 3,312 INR. Traders should watch for a sustained close above this level for possible long opportunities. The previous supply now turns into a potential support level, strengthening the bullish bias if retested successfully.
Key Levels:
• Resistance/Supply Zone: 3,265–3,300 INR
• Breakout Target: 3,312 INR
• Support (Previous Supply): Around 3,200 INR
Trading Plan:
Wait for confirmation of a sustained breakout above the supply zone. If the price holds above, consider a buy entry targeting 3,312 with a stop loss below the previous supply.
Feel free to edit/shorten this for your specific style or requirements!
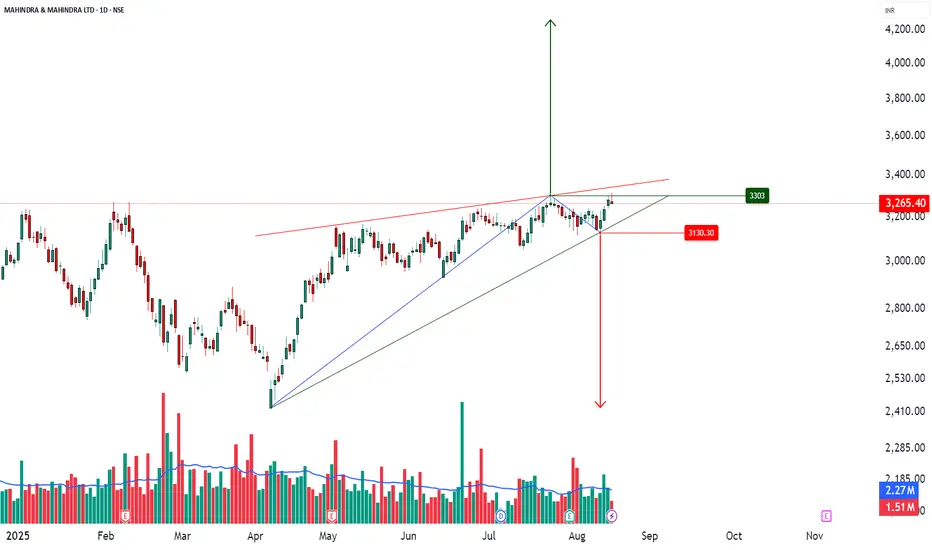
Mahindra & Mahindra – Trendline Breakout Signals Potential Downs📉 Mahindra & Mahindra – Bearish Setup Analysis
Pattern Formation: A clear M pattern has formed near the major resistance zone around ₹3,293, indicating potential trend exhaustion.
Trendline Break: Price has decisively broken the rising trendline, signaling a shift from bullish to bearish momentum.
Support Zone: Next strong support lies near ₹2,903, which is also the target zone based on the M pattern breakdown.
Risk–Reward: Short entry considered around ₹3,140 with stop-loss above ₹3,293 (resistance zone) and target near ₹2,903 offers a favorable R:R setup.
Market Structure: Recent lower highs and lower lows after the M pattern support the bearish bias.
Confirmation: Watch for a possible pullback/retest towards the broken trendline before further downside movement.
Summary:
If the breakdown sustains below the trendline, M&M could see further downside towards ₹2,903. A failed breakdown (price closing back above ₹3,200) would invalidate this bearish setup.
M&M ANALYSIS 07-AUG-2025LTP: 3210
Supports: 2934/2360
Resistances: 3300
As long as the above supports hold, we can see 3300 first.
Further targets,
3500-3666-3743
4189-4377-4777
5134 (ultimate target 1)
5534
5780-6088 (ultimate target 2)
6587, 7285
7870 (ultimate target 3)
8701, 10000*

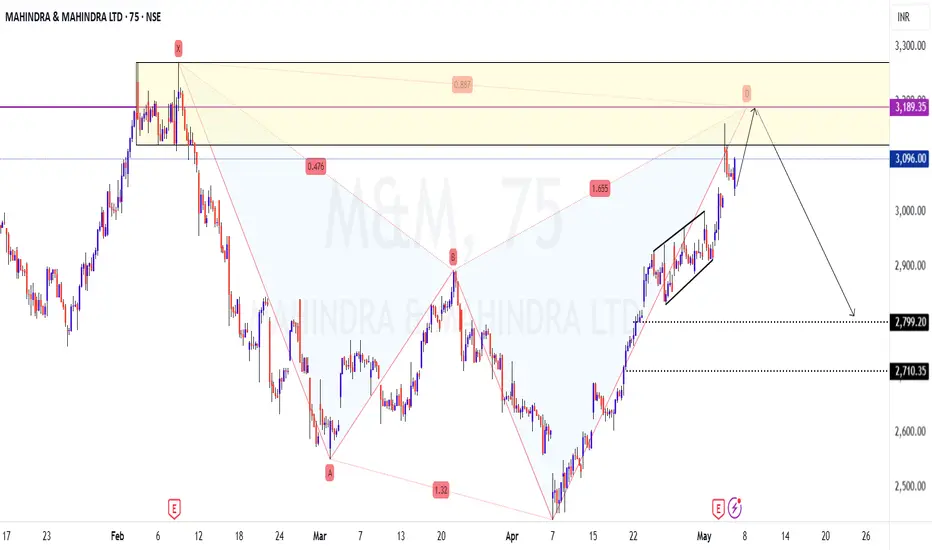
M_M C Wave CorrectionTriple Bearish Divergences
Elliot Impulse completed (1-2-3-4-5 Complete)
Elliot Correction In Progres (A Complete, B Complete, C may start).

M&M SHORT IDEAM&M has formed a negative candle in Wedge pattern, if the day closing is below the lower line of the wedge, it can fall further to up to 2990-2970 levels.
Monday and Tuesday should confirm if it is breaching a key support line.

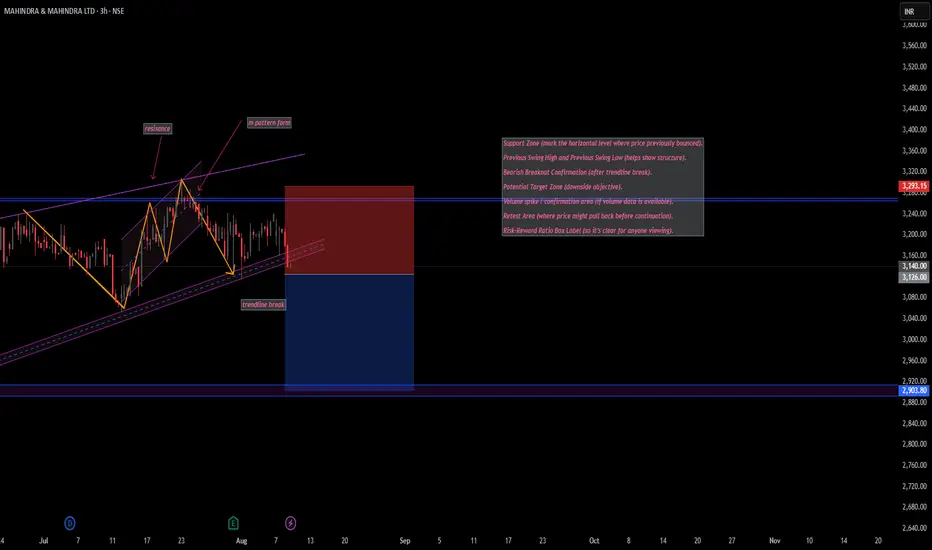
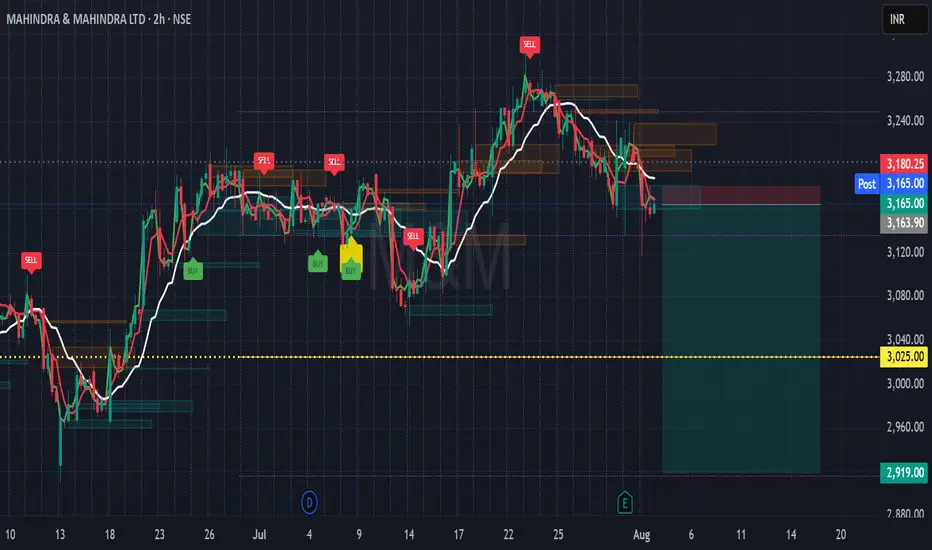
M&M Short Setup-Rejection from Supply Zone + Trend ConfirmationThis 2H chart on Mahindra & Mahindra Ltd. reflects a structure-aware short opportunity, based on price rejection from a key resistance zone and alignment with Leola Lens SignalPro logic.
🔎 Technical Structure Highlights:
🔴 SELL signal confirmed as price failed to sustain above recent supply clusters.
🟤 Multiple rejection blocks visible near ₹3,180 — now acting as resistance.
⚪ Price broke below the adaptive white base trendline, turning it into overhead pressure.
🟡 Prior yellow caution marker (trend shift risk) proved meaningful as momentum faded.
🟥 Defined invalidation level above ₹3,180.25.
🟢 Bearish targets align with previous demand zones near ₹3,025 and ₹2,919.
📌 Context Note:
Trend has shifted from congestion to downside acceleration. A clean break of recent structure suggests caution for longs. Watch for volatility around upcoming earnings.
📚 This is a technical case study — for educational use only.
Always trade with risk controls and your own judgment.
#M&M #Mahindra #NSEStocks #PriceAction #ShortSetup #StructureTrading #TechnicalAnalysis #SignalPro
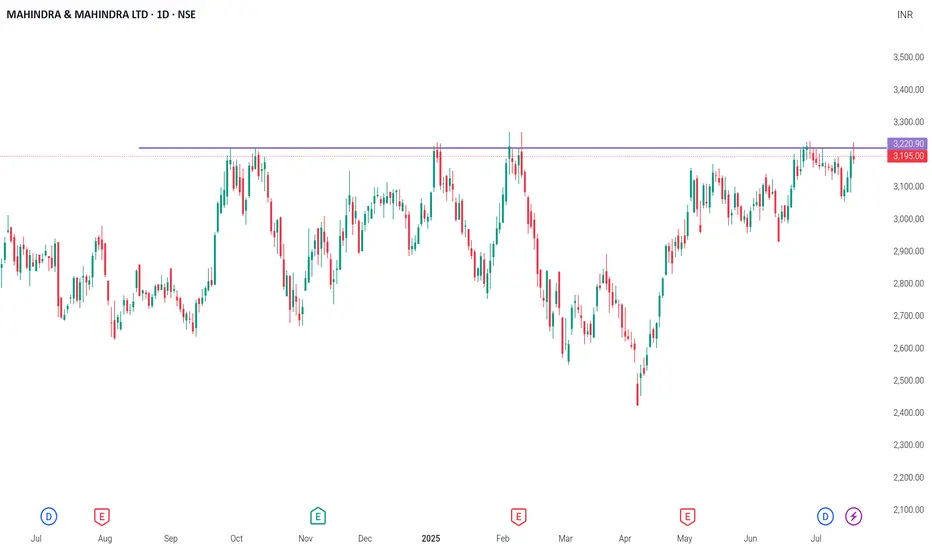
Mahindra and Mahindra Leverage TradeFor the very first time I am publishing this idea that I recorded today. M&M has been consolidating for a while, it made a high if 3222 in September 2024 and has been consolidating for 11 months. Has tried to breach the level many times, but failed. Had been tracking this recent move. I mostly take the leveraged trades so the stock fits the pick. Started picking up around 3180 when it bounced back from the lows of 3152. I bought 3200 calls, with an Avg price of 65. Scaled up with 3300 Calls at an avg price of 31. All journaled and recorded live today. Not a rocket science, just tracking the simple candlestick patterns. Also had HDFC Life 740 calls which I squared off today and made some profits, which gave me additional leverage to carry on additional risk of 3300 call. Also bought some position in MTF at an avg price of 3210. As of now trade seems safe. Would post as we go along and close the trade. Hope for the best.


At Critical Resistance!testing a strong resistance zone near ₹3,220
A level that has rejected price multiple times in the past 10 months.
🟢 If it breaks out, we could see a fresh bullish rally toward new all-time highs.
🔴 If rejected, expect sideways or bearish pressure back to the ₹3,000–₹3,100 zone.
This is a make-or-break level
Smart money is watching.
M&M (Simple Breakout)Stock has consolidated and retested the resistance multiple times. A breakout is imminent.
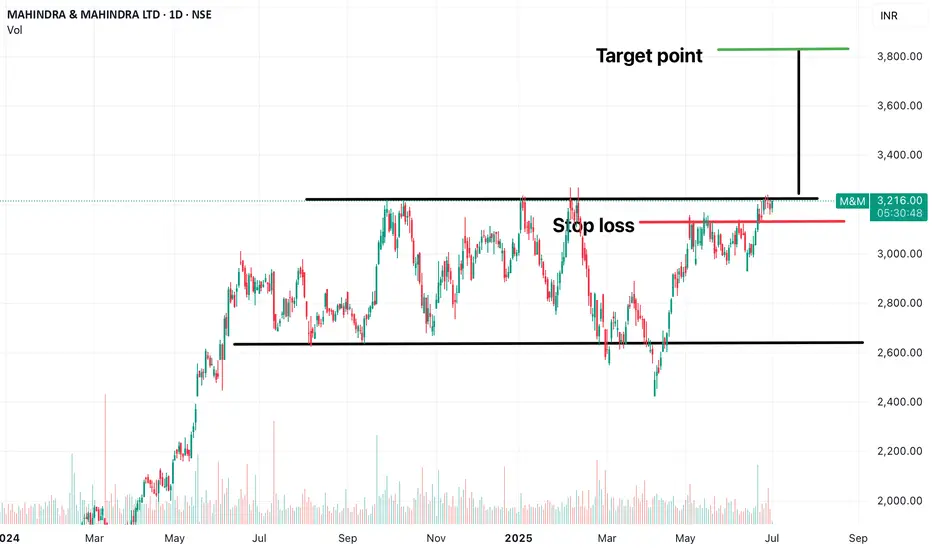
Mahindra & Mahindra On daily candle chart, a consolidation zone is clearly visible. 2500-2600 is support area and 3200-3280 is resistance area. It seems M&M is ready to give breakout above resistance zone. Trigger point will be auto sales number. Among 4 wheelers this company is showing strength. In case it gives breakout traders must keep stop loss below red line on closing basis. Good luck !
M&M... Ready for the Reversal .....?? MAHINDRA & MAHINDRA LTD: CMP: 2585.10; RSI: 38.12
Mahindra and Mahindra stock is 21% down from its recent highs and in oversold zone. Script is below its all moving averages 10...200 days EMA. On daily chart Harmonic Shark pattern is visible . Current market price is, at its Potential Price Reversal Zone (PRZ), and price trend reversal can unfold in coming days. It can be rewarding bet for aggressive traders with risk to profit of 1:3.
Entry: 2510-2600;
Stop loss- 2425;
Targets:
Target -1- 2835 (Book 50% profit);
Target-2-2985
✅ FOR MORE TRADING IDEAS LIKE THIS, LIKE, SHARE, AND FOLLOW MY IDEA STREAM ✅

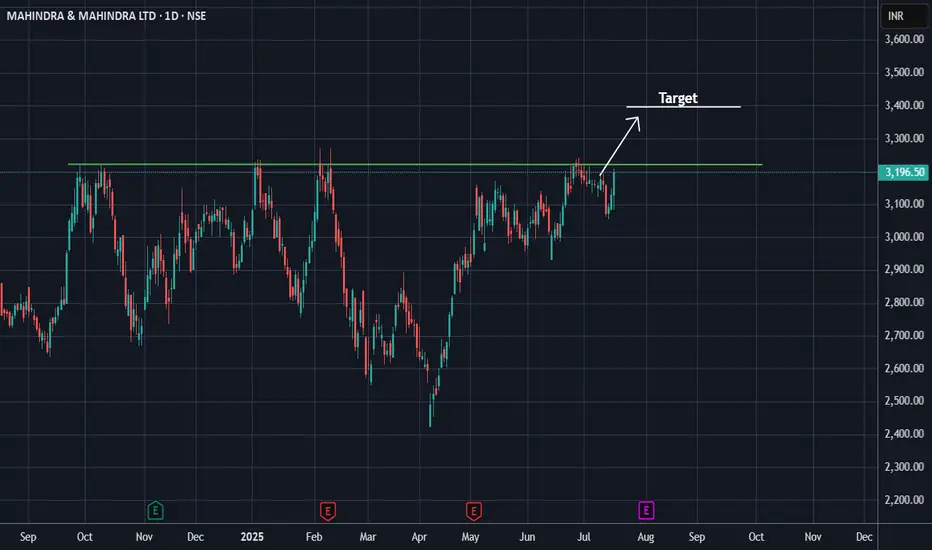
Yearly Breakout Candidate @3200M&M is trying to break out of a year-long consolidation.
Many mutual fund houses have been accumulating M&M, good strong business, healthy CF as well and overall market share, sales, and profits are growing.
Good opportunity if the stock gives a monthly closing above 3200.

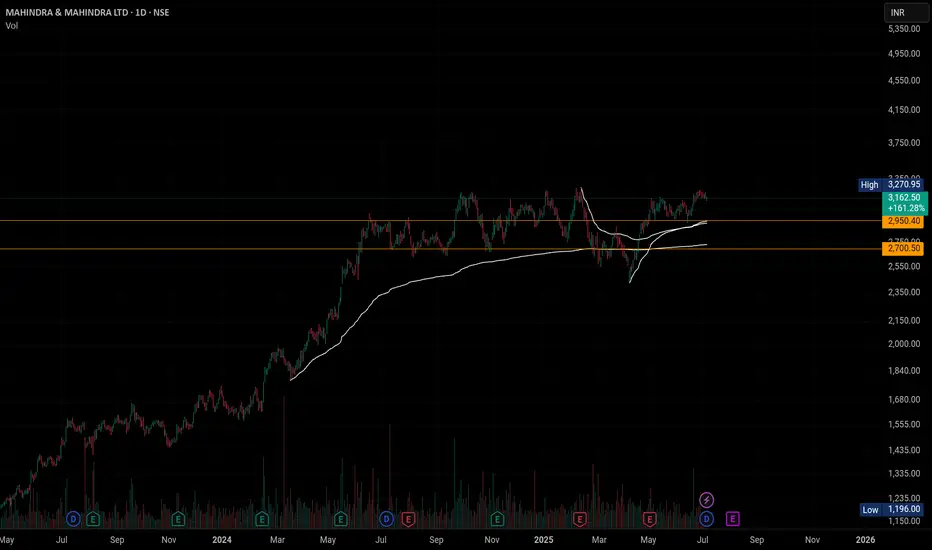
Mahindra & Mahindra – Activity Picking Up! Watch CloselyHey Family, here’s another stock showing a strong technical setup! 🚀
📈 Stock: Mahindra & Mahindra Ltd (NSE: M&M)
🔍 Key Observations:
📊 Chart Pattern:
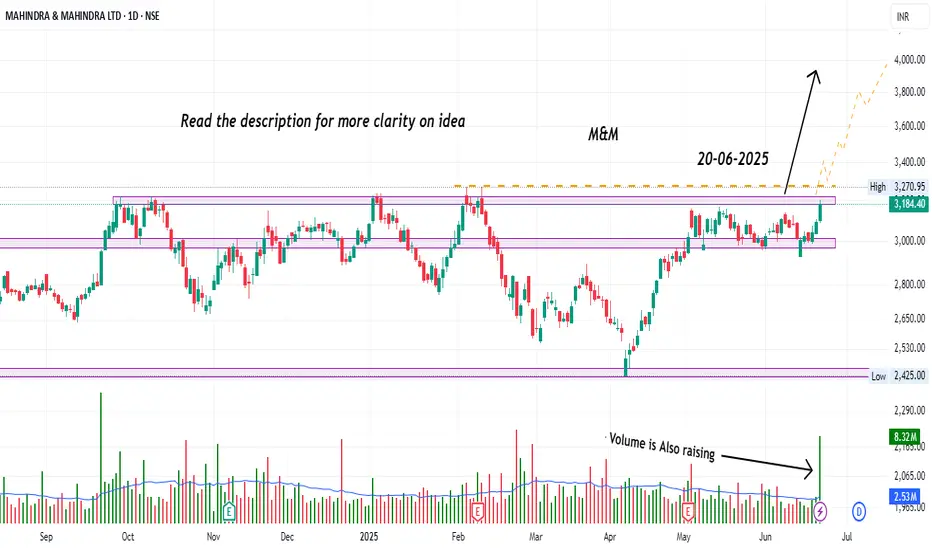
The stock is displaying a Horizontal Breakout Setup from a well-defined multi-month resistance zone, dating back to 07-10-2021. This forms a strong bullish continuation base, indicating potential for a sustained move higher.
📈 Recent Price Action:
• M&M has recently tested the upper boundary of its resistance zone around ₹3,270, which has been respected multiple times in the past (notably on 18-06-2025 and 20-06-2025).
• The current close at ₹3,184.40 (+2.90%) on June 20, 2025, shows increasing buying momentum near this critical resistance level.
• Volume surged to 8.32M, significantly above average, confirming institutional participation and validating the price action.
📦 Volume Insight:
The volume spike on the breakout attempt signals strong accumulation. This is a vital confirmation factor for the bullish case.
💡 Trading Recommendation:
Aggressive Approach:
• Traders can consider participating based on the current price structure, using proper risk management techniques aligned with individual trading plans.
Conservative Approach:
• Alternatively, wait for a clear breakout confirmation with strong follow-through and closing strength above the resistance zone before considering entry. This helps reduce false breakout risks.
🧠 Rationale:
The recent price behavior, combined with heightened volume activity, reflects growing interest in the stock. Such conditions often signal a shift in market sentiment. Observing how the stock reacts in the coming sessions can provide useful cues. Traders should focus on structure, strength, and participation—adapting their approach based on personal style and risk preference.
🚨 Disclaimer: This is not financial advice. All views are shared for educational purposes only. Please do your own research and always manage your risk before making any trading decisions.
📢 What’s your view? Drop it in the comments and boost the idea if you found it useful – your support helps us keep sharing quality setups! 💬🔥
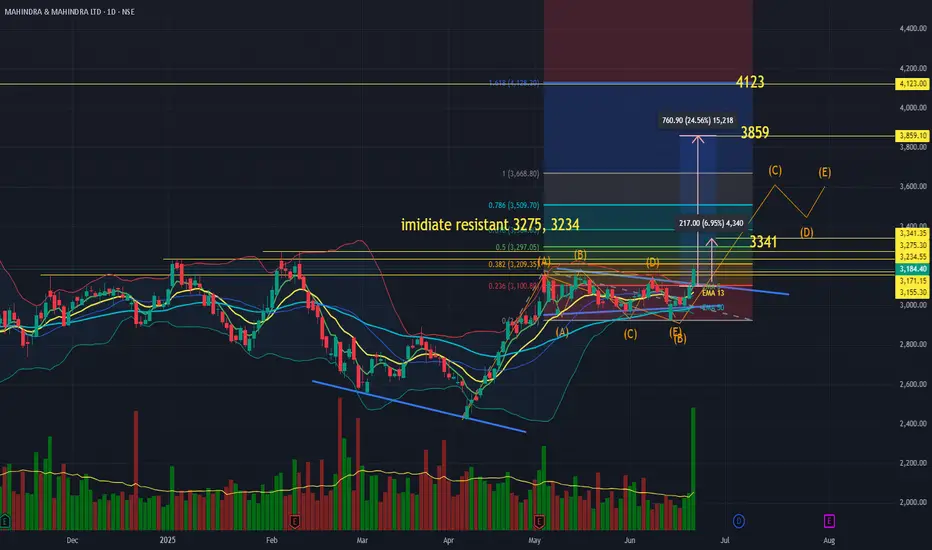
Mahindra and Mahindra flag &pole break out (possibility 3rd waveMahindra and Mahindra flag &pole break out (possibility of 3rd wave as per study
Break out of resist 3170
Flag and pole break out breakout, angular trend line breakout
immediate resistant 3275, 3234
with target of as per trend base fib retracement 1st 4123, 2nd 3859 3rd 3341
Bollinger band challenged up side ema positive crossover
parameter macd uptick abv 0 line and positive cross over
rsi 64.35,
as per Elliotte wave, stock moved from completion of 2nd wave and could be entering into 3rd wave , as per the study 3rd wave target will be measured through TBFR, and it would be 4123
this is for study purpose only
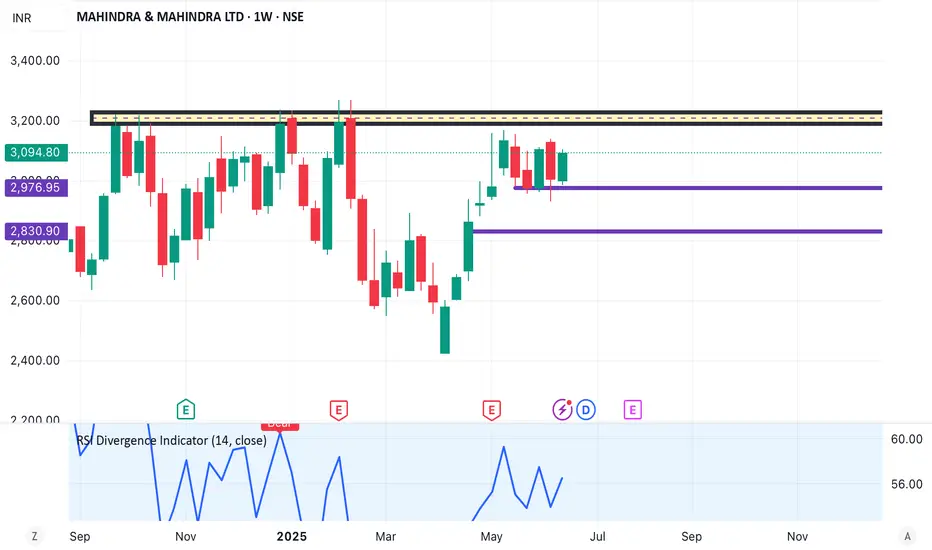
Mahindra & Mahindra weekly chart idea🔥 Mahindra & Mahindra (M&M) Weekly Chart वर जबरदस्त Breakout Setup तयार होत आहे:
✅ Flag Pattern पूर्ण – Ready for breakout
✅ Inverted Head & Shoulders – ₹3,200 is neckline (Line Chart वर स्पष्ट)
✅ Fibonacci Retracement – 0.382 वरून Price ने वळण घेतलं आहे
✅ Trendline Resistance – ₹3,270 वर Breakout confirm झाल्यास momentum वाढेल
✅ RSI Divergence – Bullish confirmation
📈 Confluence of 3 strong technical signals:
🔹 Flag pattern +
🔹 Inverted H&S +
🔹 Fibo bounce = 🔥 High conviction breakout
---
🎯 Targets (post breakout above ₹3,270):
▶ Target 1: ₹3,680
▶ Target 2: ₹3,900
🛡 Stop Loss (weekly close basis): ₹2,975
---
🙏 जय माऊली!
चार्टने दिला संकेत – कृती ठेवा ठाम, breakout आल्यावर होईल श्रीराम!
#mahindra #nse #priceaction #flagpattern #headandshoulders #technicalanalysis #tradingview
Divergence Test Divergence is when the asset price moves in the direction opposite to what a technical indicator indicates. When a stock is diverging, it signals weaker price trends and the beginning of a reversal.

M&M PRZ at 3190 - Not a place or time to go long nowThe Shark pattern PRZ is placed at 3180-200 levels. Expecting the price to sell off from there. A minimum of 50-60% of the CD leg could be the level to expect on this counter in the coming days.. Not a place to go long
M$M DOUBLE BOTTOM BREAKOUT M&M breaking double bottom weekly
with good volume since few week
RSI good, RSI divergence
breaking 20 ema also
#target1 3100 breaking it
will reach #target2 3230
NO BUY/SELL RECOMENDATION
