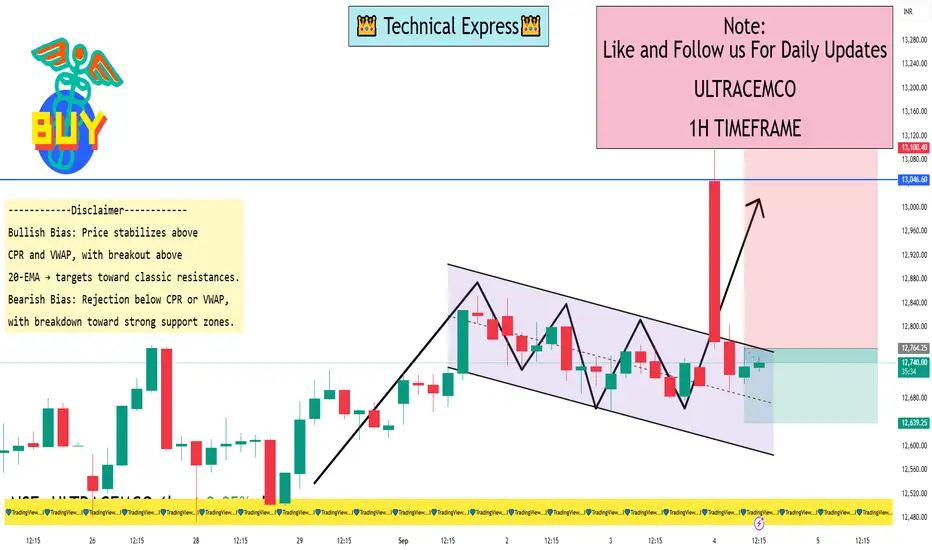
ULTRACEMCO 1 Hour View1-Hour Intraday Support & Resistance Levels
While exact 1-hour pivot levels can vary by provider, here are actionable intraday targets based on recent sources:
Munafasutra suggests a lower intraday target near ₹12,772 and an upper target around ₹12,888, with an immediate level at approximately ₹12,739
These are useful for identifying short-term trading bands.
Summary: Key Levels to Monitor on 1-Hour Chart
Immediate Support: ₹12,772 (Munafasutra)
Lower Intraday Band: ₹12,607 – ₹12,670 (classic pivot S2/S1 levels)
Pivot Zone: Around ₹12,720
Resistance Range: ₹12,783 – ₹12,896 (classic R1–R3), plus Munafasutra upper target near ₹12,888
How to Use These Levels
Use the ₹12,772 level as your lower threshold. A drop below may open up the S2/S1 zone for further downside.
Treat ₹12,720 – ₹12,783 as the core pivot/resistance zone; a break above may validate continuation toward the upper range.
Watch ₹12,888 – ₹12,896 as a potential upper resistance, where intraday rally may pause or reverse.
Final Take
For short-term intraday trades, focus on:
Watch zones: Support at ₹12,772–₹12,720 and resistance at ₹12,783–₹12,888.
Use the pivot range (~₹12,720) as your benchmark for bias—below hints bearish pressure, above signals upside potential.
Monitor technical momentum via trading platforms (e.g., RSI, MA crossovers) to confirm directional moves.
UCLQF trade ideas
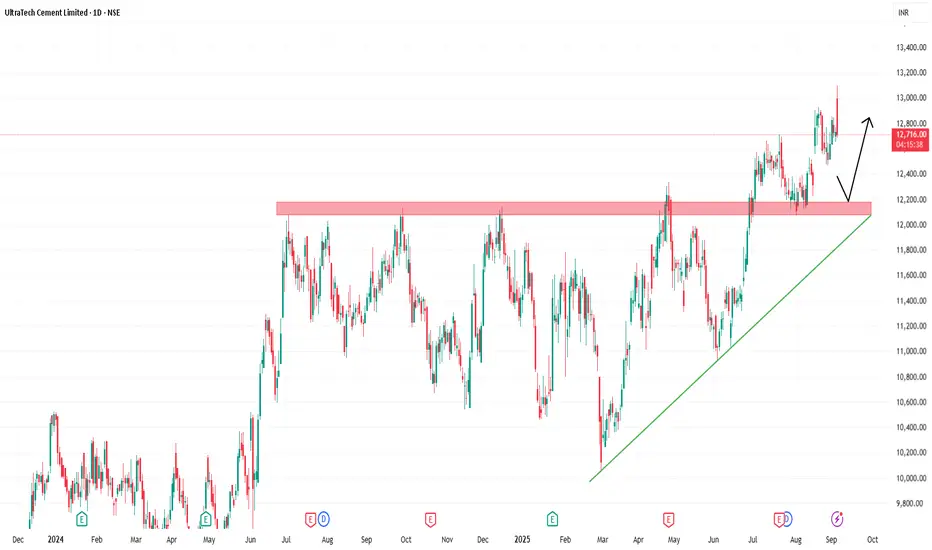
UltraTech: Two-Decade Bull Rally Reaches New SummitTechnical Analysis
UltraTech Cement presents one of the most spectacular long-term growth stories in Indian equity markets. Having observed this stock for two decades, the journey from ₹250 levels to ₹12,000 represents a phenomenal 48x growth over 20 years - a testament to consistent value creation.
The ₹12,000 level acted as formidable resistance from July 2024 to July 2025, creating a year-long consolidation phase. This resistance was finally breached in July 2025, coinciding with confirmation of positive YoY quarterly results that provided the fundamental catalyst needed for the breakout.
Currently trading at ₹12,700, the stock has successfully broken above the psychological ₹12,000 barrier. This breakout, supported by strong fundamental performance, opens up the path for the next leg of the bull rally.
Entry Strategy: Enter on any dips toward ₹12,200-₹12,300 range, ensuring the ₹12,000 level holds as new support.
Targets:
Target 1: ₹13,000
Target 2: ₹13,500
Target 3: ₹14,000
Stop Losses:
Critical Support: ₹12,000 (previous resistance, now key support)
If the market doesn't sustain above ₹12,000 level, no more expectations on this stock.
Q1 FY26 Financial Highlights (vs Q4 FY25 & Q1 FY25)
Total Income: ₹21,275 Cr (↓ -8% QoQ from ₹23,063 Cr; ↑ +13% YoY from ₹18,819 Cr)
Total Expenses: ₹16,869 Cr (↓ -9% QoQ from ₹18,456 Cr; ↑ +7% YoY from ₹15,801 Cr)
Operating Profit: ₹4,406 Cr (↓ -4% QoQ from ₹4,608 Cr; ↑ +46% YoY from ₹3,017 Cr)
Profit Before Tax: ₹3,008 Cr (↓ -3% QoQ from ₹3,101 Cr; ↑ +62% YoY from ₹1,857 Cr)
Profit After Tax: ₹2,221 Cr (↓ -10% QoQ from ₹2,475 Cr; ↑ +49% YoY from ₹1,493 Cr)
Diluted EPS: ₹75.54 (↓ -10% QoQ from ₹84.23; ↑ +46% YoY from ₹51.78)
Fundamental Highlights
UltraTech Cement delivered exceptional Q1 FY26 performance with consolidated net profit surging 49% YoY to ₹2,221 crore, driven by strong volume growth of 9.7% YoY to 36.83 million tonnes. Income rose 13% with EBITDA per MT increasing ₹337.
Market cap stands at ₹3,75,630 crore (up 11.1% in 1 year) with stable promoter holding at 59.2%. The company increased grey cement capacity by 3.5 MTPA in Q1 FY26, bringing total capacity to 192.26 MTPA.
UltraTech has allocated ₹10,000 crore capex for FY26 to bolster capacity and energy efficiency initiatives. Company achieved over 1 GW renewable power installations milestone and expects 7-8% sustainable volume growth.
UltraTech is on track to become world's top cement seller outside China with operational footprint of 34 integrated units, 30 grinding units, and 9 bulk terminals across India. In FY25 alone, the company added 42.6 MTPA capacity, accounting for 55% of the entire sector's expansion.
Strategic positioning includes targeting 209.3 MTPA output by FY27 and maintaining strong operational metrics with focus on sustainability through renewable energy integration.
Conclusion
UltraTech's remarkable 20-year bull run from ₹250 to ₹12,700, combined with 49% YoY PAT growth and successful ₹12,000 resistance breakout, validates the long-term growth thesis. The 192.26 MTPA capacity milestone, ₹10,000 crore FY26 capex, and 1 GW renewable energy achievement position the company as industry leader. Technical breakout toward ₹14,000 appears feasible provided ₹12,000 support holds. Strong fundamentals justify premium valuation in cement sector leadership.
Disclaimer: lnkd.in

UltraTech: Two-Decade Bull Rally Reaches New Summit🔍 Technical Analysis
UltraTech Cement presents one of the most spectacular long-term growth stories in Indian equity markets. Having observed this stock for two decades, the journey from ₹250 levels to ₹12,000 represents a phenomenal 48x growth over 20 years - a testament to consistent value creation.
The ₹12,000 level acted as formidable resistance from July 2024 to July 2025, creating a year-long consolidation phase. This resistance was finally breached in July 2025, coinciding with confirmation of positive YoY quarterly results that provided the fundamental catalyst needed for the breakout.
Currently trading at ₹12,700, the stock has successfully broken above the psychological ₹12,000 barrier. This breakout, supported by strong fundamental performance, opens up the path for the next leg of the bull rally.
Entry Strategy: Enter on any dips toward ₹12,200-₹12,300 range, ensuring the ₹12,000 level holds as new support.
🎯 Targets:
Target 1: ₹13,000
Target 2: ₹13,500
Target 3: ₹14,000
🚫 Stop Losses:
Critical Support: ₹12,000 (previous resistance, now key support)
If the market doesn't sustain above ₹12,000 level, no more expectations on this stock.
💰 Q1 FY26 Financial Highlights (vs Q4 FY25 & Q1 FY25)
Total Income: ₹21,275 Cr (↓ -8% QoQ from ₹23,063 Cr; ↑ +13% YoY from ₹18,819 Cr)
Total Expenses: ₹16,869 Cr (↓ -9% QoQ from ₹18,456 Cr; ↑ +7% YoY from ₹15,801 Cr)
Operating Profit: ₹4,406 Cr (↓ -4% QoQ from ₹4,608 Cr; ↑ +46% YoY from ₹3,017 Cr)
Profit Before Tax: ₹3,008 Cr (↓ -3% QoQ from ₹3,101 Cr; ↑ +62% YoY from ₹1,857 Cr)
Profit After Tax: ₹2,221 Cr (↓ -10% QoQ from ₹2,475 Cr; ↑ +49% YoY from ₹1,493 Cr)
Diluted EPS: ₹75.54 (↓ -10% QoQ from ₹84.23; ↑ +46% YoY from ₹51.78)
🧠 Fundamental Highlights
UltraTech Cement delivered exceptional Q1 FY26 performance with consolidated net profit surging 49% YoY to ₹2,221 crore, driven by strong volume growth of 9.7% YoY to 36.83 million tonnes. Income rose 13% with EBITDA per MT increasing ₹337.
Market cap stands at ₹3,75,630 crore (up 11.1% in 1 year) with stable promoter holding at 59.2%. The company increased grey cement capacity by 3.5 MTPA in Q1 FY26, bringing total capacity to 192.26 MTPA.
UltraTech has allocated ₹10,000 crore capex for FY26 to bolster capacity and energy efficiency initiatives. Company achieved over 1 GW renewable power installations milestone and expects 7-8% sustainable volume growth.
UltraTech is on track to become world's top cement seller outside China with operational footprint of 34 integrated units, 30 grinding units, and 9 bulk terminals across India. In FY25 alone, the company added 42.6 MTPA capacity, accounting for 55% of the entire sector's expansion.
Strategic positioning includes targeting 209.3 MTPA output by FY27 and maintaining strong operational metrics with focus on sustainability through renewable energy integration.
✅ Conclusion
UltraTech's remarkable 20-year bull run from ₹250 to ₹12,700, combined with 49% YoY PAT growth and successful ₹12,000 resistance breakout, validates the long-term growth thesis. The 192.26 MTPA capacity milestone, ₹10,000 crore FY26 capex, and 1 GW renewable energy achievement position the company as industry leader. Technical breakout toward ₹14,000 appears feasible provided ₹12,000 support holds. Strong fundamentals justify premium valuation in cement sector leadership.
Ultracemco long targets : 12304,12332,12360,12490It has given long signal on Gann indicators today as well. It is long on most of my indicators.
Ultracemco long targets : 12304,12332,12360,12490
#Nifty50 #BankNifty #Sensex #StockMarketIndia #HNIInvestors #Swingtrading

Ultracemco short target 12293, 12263 now @ 12322Have given targets up to 12540 already based on Gann signals. One can do long , short , both - all targets will be met.
#Nifty50 #BankNifty @TradingView #Sensex #StockMarketIndia @zerodhaonline #TechnicalAnalysis #DayTrading @CNBC_Awaaz #IntradayTrading #OptionTrading #MarketsWithETNOW #PriceAction

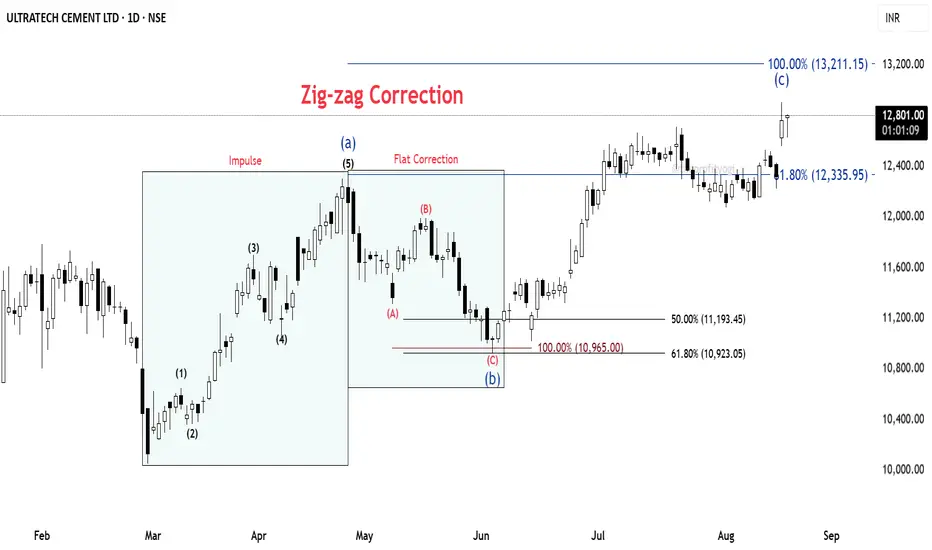
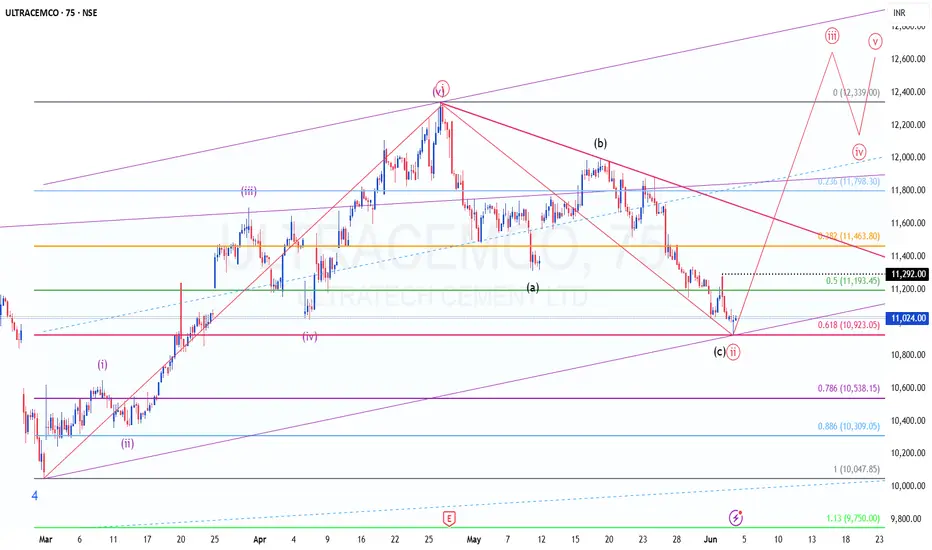
ULTRACEMCO: Wave C started from strong Fib clusterULTRACEMCO – Daily Chart Analysis
🔹 Base Point: The count begins from the low made on 3rd March 2025.
🔹 From this low, the price moved up in the form of a clear impulse wave, completing a 5-wave structure.
🔹 This was followed by a corrective fall, retracing 61.8% Fibonacci of the prior impulse.
⚡ Correction Phase:
The decline is counted as an ABC Flat correction (red).
Within this, the C wave extended fully to the 100% Fibonacci projection.
At this point, we observe a strong cluster zone formed by the 61.8% retracement and 100% extension, indicating confluence and potential support.
📈 Current Development:
From this support, the price has begun to move up again, showing the characteristics of a fresh impulse.
The overall structure fits into a larger Zig-Zag correction, where Wave C is still under development.⏳
📝 Summary:
✅ Impulse up (5 waves)
✅ Flat correction (A-B-C) complete at Fib cluster
🚀 Wave C of Zig-Zag unfolding
#ULTRACEMCO #NSEStocks #ElliottWave #Fibonacci #WaveAnalysis #TradingSetup #PriceAction
#Ultracemco Long Targets : 12370, 12490After some correction and consolidation it may have restarted it's journey. Its long on daily charts and technical indicators.
#Nifty50 #BankNifty #Sensex #StockMarketIndia #StockMarketIndia #PriceAction

ULTRACEMCO - on the verge of falling=========================
ULTRACEMCO
=========================
Weekly
Bearish Divergences in 3rd & 5th wave seen.
Elliot Impulse Wave seems complete 1-2-3-4-5
Daily
Bearish Divergences observed.
Impulse wave complete.
Correction wave A and B seems complete. Correction wave C to start.
Huge Call writing observed
=========================

Ultracemco Long Target : 12511 , 12540 ; currently @ 12470Has given long signal after consolidating for a while, will cross 12700.

Ultracemco Long Target : 12410 ; Now @ 12350Has been giving long signals. This one is the closest to its current LTP. Should complete fast , given NIFTY also has given long signal till 12706.

UltraTech Cement | Pullback Opportunity after Breakout?Description:
- After breaking out of a consolidation zone, UltraTech Cement is showing a controlled throwback towards prior resistance, now acting as support.
- Weekly structure remains intact with sloping EMAs and positive momentum.
- Daily & Hourly charts show minor weakness but no structural breakdown.
- EFI suggests lower TF selling pressure, while weekly remains stable.
📌 Entry Zone: ₹12,037
📉 Stoploss: ₹11,850 (ATR-based)
🎯 Targets: ₹12,937 → ₹13,139 → ₹13,427
Cement sector is gaining strength in the broader infra rally — watching for confirmation on bounce from support.

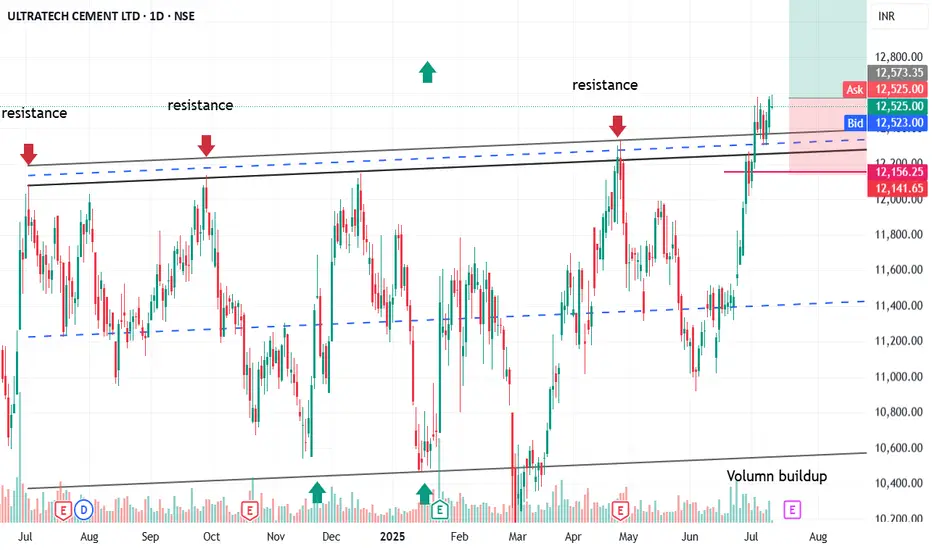
UltraTech Cement Rides Strong Bullish Channel, Eyes Breakout BeyTopic Statement:
UltraTech Cement continues its bullish run, driven by consistent growth and cement’s critical role in construction-led demand.
Key Points:
1. The stock moves strictly within a well-defined uptrending channel, making it highly suitable for channel-based trading
2. It rarely dips below the 200-day EMA, and prices near this level have historically presented strong investment opportunities
3. The price is currently facing resistance at the 12000 mark, but a weak breakout appears to be underway, signaling potential continuation

Ultratech Cement at supportCement stocks are posting good results. Ultratech is the king of this sector. Try to buy it at support.

ULTRACEMCO : A opportunity to get 1: 4.5 RR in channel BO• Ultra tech was moving in parallel channel from Q3-2024.
• A perfect channel could be fitted on the stock.
• Last 1 weeks there is a significant volumn spike in the stock.
• Last week closing was above the channel
• If this week closing is above previous week closing then bullish move confirmed
• Swing stop loss is 1214
• Target are channel length + 12500 that is 12500 + 2000=14500 in the chart.
• An opportunity of 1: 4.5 RR in swing trending.
• Already retested the support
• Go long only when todays daily close is above yesterdays close. As index looking week tread with caution and sl.
• Idea is for educational purpose and explore the price action learning with trading psychology.
• Have fun traders!!! 😊
UltraTech Cement Breakout Setup | Targets ₹13,617 to ₹18,000UltraTech Cement has decisively broken out of a multi-month consolidation zone (resistance near ₹12,339), confirming a strong bullish channel. The price action is respecting a steep ascending support line and forming higher highs and higher lows.
The breakout occurred just before the Quarterly Result, indicating confidence from participants ahead of earnings. This setup opens up a new bullish leg targeting much higher zones in the coming months.
Key Levels & Targets:
Breakout Level: ₹12,339
Target 1: ₹12,956
Target 2: ₹13,617
Target 3: ₹14,248
Wave Projection Targets: ₹16,000 → ₹17,000 → ₹18,000
Support & Risk Areas:
Support Zone: ₹12,339 → ₹11,677
SL Zone: Below ₹11,159 invalidates the bullish structure
Trendline Support: Rising with price action
Trade Plan:
Entry Zone: On retest of ₹12,340–12,500 or on strength above ₹12,960
Stop Loss: Below ₹11,150
Target Zone: ₹13,600 → ₹18,000 (mid to long term)
Structure: Weekly Breakout from Channel + Bullish Price Action
Timeframe: Medium to Long Term (2–6 months)
The Cement sector is heating up with infra and construction tailwinds, and UltraTech’s structure suggests early participation may reward positional investors.
Disclaimer:
This analysis is for educational purposes only. Always do your own research and use strict risk management before taking entry or exit decisions.

UltraTech Cement – Weekly Trendline Breakout | Swing Trade Plan📈 Trade Setup Explanation:
UltraTech Cement has formed a weekly trendline breakout after months of consolidation, with confirmation on both daily and weekly timeframes. Here’s the breakdown:
✅ Weekly Trendline Breakout confirmed with candle close above key resistance (~₹12,320).
✅ Daily Breakout occurred earlier with strong volume, confirming bullish momentum.
✅ Volume Pattern indicates increasing participation from buyers.
✅ Price retested the breakout zone — providing a great averaging or entry opportunity.
📌 Entry Plan:
Partial entry already initiated after the daily breakout.
Add position when the price sustains above ₹12,320 on a weekly close.
Ideal for swing traders aiming for a multi-week move toward ₹14,950.
📉 Risk Management:
Stop Loss: ₹10,900 (below recent support)
Reward to Risk Ratio: ~2.7:1
Proper position sizing advised to manage risk.
🔍 Strategy:
This is a breakout-pullback continuation setup. The stock has consolidated between ₹10,900–12,300 range for months. With broader market support and a sectoral push, UltraTech Cement looks ready for the next leg up.
Disclaimer:
This is for educational purposes only. Do your own research before investing or trading. Not a SEBI registered advisor.

Is it time to get bullish on ULTRACEMCO?CMP : 11020
TF : Hourly
Primary view:
Looks like we are in for the 3rd of 5th wave upmove (or) we are ending the 2nd of 5th
Indications/Reasoning:
1. Price is taking support at the 61.8% retracement of this first leg up from 10050 to 12340
2. On shorter time frame, one can observe 5 wave upmove followed by 3 wave downmove.
3. Price is taking support at the SuperTrend on Daily TF
4. The ABC corrective move halted at the 100% extension of the AB leg (AB=BC)
5. Price is at the Cloud Base
6. Expecting HAMMER candle by today's close.
Chart with counts on Larger TF (from COVID Lows at 2910) is copied below
Action Plan:
We need confirmation of the break of trend, for which, it needs to take out swing high at 11300 first. And then the falling trendline from the top.
At 11020, it is a good looking LRHR set up (STOP of 100-150 points)
Disclaimer: I am not a SEBI registered Analyst and this is not a trading advise. Views are personal and for educational purpose only. Please consult your Financial Advisor for any investment decisions. Please consider my views only to get a different perspective (FOR or AGAINST your views). Please don't trade FNO based on my views. If you like my analysis and learnt something from it, please give a BOOST. Feel free to express your thoughts and questions in the comments section.
ULTRACEMCO BearishAs per Supply and Demand price is at supply zone and any breakout only leads to further upside if not we may see some bearish move / profit booking from the current levels. just a view not a reco...

#Ultracemco short target - 12088
#Ultracemco after a good run, is correcting today, Nifty is looking short with volumes. #Ultracemco may drop to 12088.
#stocks #StocksInFocus #StockMarketIndia #Nifty #TargetHit #PriceAction
Please consult SEBI-registered advisor before making investment decisions.
Ultracemco Sideways ( Educational Purpose Only)It is sideways with Golden Death Indicator. VWAP 3 and 30 days are long. Its gaining momentum today. On the long side estimated targets are 11530 and 11630. On the short side estimated targets are 11300 and 11200. At the time of this analysis its trading at 11440.
I am not a SEBI-registered investment advisor. Please consult a qualified SEBI-registered advisor before making investment decisions.
#ultracemco #stocks #StocksInFocus #StockMarketIndia #Nifty

Ultracemco Bearish ( Educational Purpose Only)Ultracemco to drop to 11330 . Looking bearish on Gann indicators.
This content is for educational purposes only reflects personal views, not investment advice. I am not a SEBI-registered investment advisor. Please consult a qualified SEBI-registered advisor before making investment decisions.

Cementing a Comeback?
Ultratech Cement has been grinding sideways after a sharp vertical rally and is now defending a multi-candle support near ₹11,360–₹11,370. The higher low structure, combined with the fresh breakout attempt from a tight range, sets the stage for a potential upside.
The volume on the breakdown attempt was weak, and the recovery has been steady—signaling buyers are active.
Trade Setup:
• Buy Entry: ₹11,405–₹11,410 (on confirmation or breakout)
• Stop-loss: Below ₹11,360
• Targets:
• First: ₹11,480
• Final: ₹11,530
If momentum picks up above the mini range high, this could retest the swing highs of June 17.

Will UltraTech Cement Bounce Back from the ₹10,500 Multi-SupportThis weekly chart of UltraTech Cement Ltd (NSE: ULTRACEMCO) highlights a key technical setup, focusing on long-term price behavior and support-resistance zones.
Key Observations:
• 🔼 Life High Resistance: ₹12,339 remains a critical resistance level.
• 🧱 Multi-Support Zone: ₹10,500 has acted as strong support multiple times in the past.
• 📉 EMA Support: Price is currently taking support near the 50-week Exponential Moving Average.
• 📊 RSI Level: RSI stands at 51.65 — indicating a neutral momentum, with room for either side.
• 🔄 The stock is consolidating in a broad range; a breakout above ₹11,800 could indicate bullish strength.
This setup suggests that traders and investors may watch for a bounce or breakdown from the support zone, especially with improving volume patterns and support holding firm.
⸻
Analysis By Mayur Jayant Takalikar --For
LEARNING & OBSERVATIONAL USE ONLY.
⚠️ Disclaimer:
I am not a SEBI-registered investment advisor.
The above content is shared purely for educational and informational purposes. Please consult your financial advisor before making any investment decisions. Trading in the stock market involves risk — invest only after thorough research.
