Ultratech good to watchNSE:ULTRACEMCO
Good to keep on the radar
Always respect SL & position sizing
========================
Trade Secrets By Pratik
========================
Disclaimer
SEBI UNREGISTERED
This is our personal view and this analysis
is only for educational purposes
Please consult your advisor before
investing or trading
You are solely responsible for any decisions
you take on basis of our research.
UCLQF trade ideas

Long Ultratech cementUltratech cement form cup & Handle in daily time frame
RSI Above 60 - Bullish Signal
MACD is ready for bullish crossover
Long Build up in future contract


Ultratech Big Rewards aheadInverted head and shoulders pattern in weekly frame.
Cements stock is buzzing and cement rate hikes in the way so this would be nice swing trade

Ultratech Cement Bullish Breakout As we can see Ultratech Cement , confirmed Bullish Breakout on daily timeframe. all indicators turned positive . For me this is the best time for selling this scrip in future market

ultracement longterm buyultratech cement
buy 7000
stoploss 6800
target 7800
ultratech cement multi pattern breakout

ULTRACEMCO - Inverted HnS breakout - 25% upside potentialULTRACEMCO has given a trendline break out along with head and shoulder pattern breakout at 7000 levels.
Target is coming to 8700-8750 levels.
SL: Daily close below 6900
Target timeframe: 2-4 months

ULTRATECH CEMENT Inverted H&S breakout with fall in volumes
Don't miss this trade
target 7200
sl 6850 NSE:ULTRACEMCO

#ultratechcement📌Looking good to enter once sustain above 7010
📌Support at 6650
📌Target 7400-7600-8000

Ultratech Double Top Formation On 4H Time Frame Stock Showing Reversal Of Double Top Pattern. We will wait for proper breakdown. Thanks for your support :-)
Disclaimer : I am not SEBI registered analyst. Do your own analysis before taking trade. I am not responsible for your profit or loss.

ULTRATECH CEMENTNSE:ULTRACEMCO near to the Inverse Head & Shoulders Breakout.
Above 7000 Can give a good Bullish momentum.

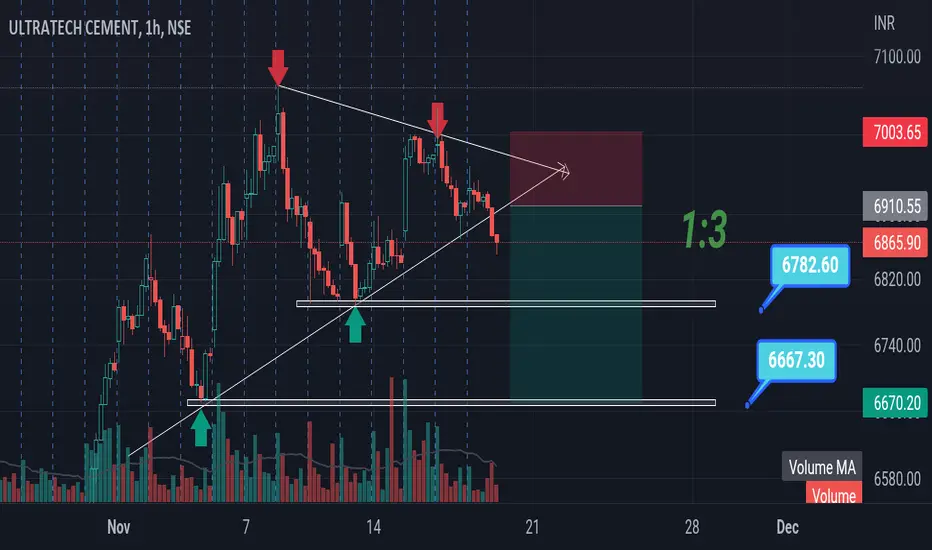
Ultratech 1hr time frame symmetrical triangle Ultratech 1hr time frame symmetrical triangle with powerful breakout but retest is also important if retest is successfully and it's make bearish sign then we will entered a trade but retest not succesfull then we avoid this trade
Take a short entry
Entry : 6910
Target 1 : 6782
Target 2 : 6667
Stop loss : 7003
ULTRATECH Breakout Ultratech near a breakout on marked level. A good closing above the line in Daily candle (strong) will trigger decent up move.

ULTRACEMCOINVERSE HEAD & SHOULDERS PATTERN FORMATION
Buy @ cmp & in dips till 6650 | WCBSL 6500 | Tgt 7650 / 8050 / 8850+
Immediate Resistance - 1700
Strong Resistance Zone - 7150_7225. WCB above 7225 will start trending move

Expecting an upmove in UltraTech Cement Ltd.The stock NSE:ULTRACEMCO is taking resistance at a tight range of 6970 - 7080 ( indicated in the white line and a thin violet rectangular bar). Which earlier acted as support seen in the graph.
Here I have taken a weekly time frame of the stock where a reverse head and shoulder pattern could be observed in the chart( indicated in a violet arc). Which is considered bullish momentum.
Looking for the stock to pass the 7100 level along with volume action
keeping an immediate target at 8000
stop loss below the 6800 level if the stock retraces after crossing the 7100 level.
*this analysis is for educational purpose and not any kind of stock recommendation

Ultratech - Inverted Head & ShoulderClear pattern formation, waiting for breakout in few days....
Follow Bull Master on YouTube to start from basics on how to identify entry in any chart.

MIDCAP may be on FireNSE:CNXMIDCAP NSE:ASHOKLEY NSE:ASAHIINDIA NSE:BAJAJHLDNG NSE:GRAVITA NSE:IEX NSE:PIIND NSE:POLYCAB
Good to keep on the radar
Always respect SL & position sizing
========================
Trade Secrets By Pratik
========================
Disclaimer
SEBI UNREGISTERED
This is our personal view and this analysis
is only for educational purposes
Please consult your advisor before
investing or trading
You are solely responsible for any decisions
you take on basis of our research.

Ultratech Cement ( both side trade possible )Price now at resistance, Its a good buy above 7075 level where it might break the following resistance trendline for a target price of around 7800 and a good sell below 5983 which is 500D moving average for a target price of around 5150. Always trade at your own risk and own knowledge.
Good Luck, Jai Hind 🇮🇳

Positional Pick ( Ultratech Cement)The Stock is forming Inverted Head & Shoulders type of Pattern.
Can go long after sustains above round level of 7000.
SL:-6675
Targets:- 7550, 7950, 8270(ATH)

Good potential set up in UltratechChart pattern and levels mentioned in chart.
Follow strict risk management

Inverse head and shoulder pattern Weekly time frame= inverse head and shoulder pattern, And trendline breakeout happen with good volume . we wait for proper H line breakout , it happens go for long

Head and shoulder pattern breakout in ULTRACEMCO.ULTRACEMCO
Key highlights: 💡⚡
📈 On 1D Time Frame Stock Showing Breakout of Head and shoulder Pattern .
📈 Strong Bullish Candlestick Form on this timeframe.
📈It can give movement upto Breakout target of 8710+.
📈 Can Go Long in this stock by placing stop loss below 6650-.
📈 Breakout this can give risk:reward upto 1:5+.
