PENDLEUSDT - READY TO POP?Symbol - PENDLEUSDT
PENDLEUSDT appears to be transitioning from a phase of prolonged consolidation into a potential distribution phase. The coin is currently testing a significant resistance level, the breakout of which could initiate a renewed upward movement.
The price is exhibiting strength as it attempts to breach the upper boundary of the recent range. A sustained consolidation above the key level of 4.400 would suggest bullish continuation. Supportive macro conditions particularly the ongoing bullish momentum in Bitcoin are lending strength to the altcoin market. Should this trend persist, altcoins including PENDLEUSDT may follow suit, shifting from consolidation into broader distribution.
Key Resistance Levels: 4.320, 4.400
Key Support Levels: 4.024, 3.622
Should the price confirm a breakout by holding above the critical resistance level, this would likely signal the beginning of a more aggressive upward move. In such a scenario, a potential target lies near the 4.800 level.
Trade ideas

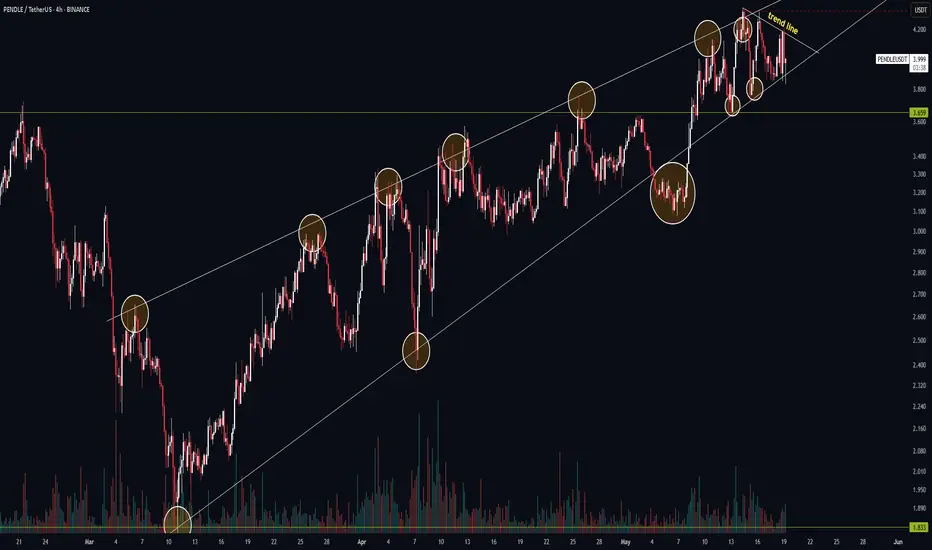
PENDLE 4H Analysis — Market Coiling for a Potential BreakoutBINANCE:PENDLEUSDT
🔹 Cycle Structure:
HWC (High Wave Cycle / Long-Term): Bullish 🔼
MWC (Medium Wave Cycle / Mid-Term): Bullish 🔼
LWC (Low Wave Cycle / Short-Term): Ranging 🔁
With both HWC and MWC showing bullish direction, the overall market sentiment is bullish for now.
🔍 Price Structure Insights:
The market is currently in a compressed range, and price action looks like a spring being coiled — meaning once it breaks out, we might see a sharp move.
Now, let’s remember:
We never deal in certainties — this game is all about probabilities.
Here’s what we're seeing:
More touches to the top of the range → indicates bullish pressure
Decreasing volume during dips → another bullish signal
So, with these confirmations, my bias leans toward the long side.
That said, if a valid short trigger comes up, I’ll mention it — but personally, I won’t take a short on this one.
📈 Long Entry Options (from riskier to safer):
Early Entry: Break of trendline (1H timeframe) — higher risk, earlier entry
Medium-Safe Entry: Break of horizontal resistance at 4.33
Safer Entry: Break of the main trendline (trend-confirmation)
⚠️ No matter how "safe" a setup looks, there’s always a chance of hitting stop-loss.
The safer the setup, the lower the probability of getting stopped out — but it’s never zero.
📉 Short Setup:
A short could be considered below 3.66 (support break)
However, as mentioned — I personally won’t take this short given the bullish context.
📌 If you want a specific coin analyzed, let me know in the comments.
I’ll pick a few requests for the next breakdown.
Without proper risk management, you're just a ticking time bomb. ⚠️
— PXA 📊
PENDLE Long Setup – Key Support Retest at $3PENDLE is pulling back into the $3.00 zone, a key level that previously acted as resistance and is now being retested as support. This classic support-resistance flip often marks the foundation for a bullish reversal, especially if price holds with strength.
📌 Trade Setup:
Entry Zone: Around $3.00
Take Profit Targets:
🥇 $3.41
🥈 $3.80
Stop Loss: Daily close below $2.80

PENDLE CHART ANALYSIS : LONG OR SHOT? SEED_DONKEYDAN_MARKET_CAP:PENDLE is currently facing resistance and CRYPTOCAP:BTC is struggling to clear main resistance at 67k. If PENDLE doesn't hold current price at 4.30 zone, next support stands at 3.40 zone, which is also a mid supply zone.
In case of bullish move from support or from current price value 6.00 level is most likely to happen in few weeks.

Are PENDLE Bulls Ready To Move Beyond $10?Pendle has a market cap of $988 Million and is ranked 87th in the cryptoverse. It has observed a surge of 49% in the trading volume. The token price is currently trading near the value of $6.4 with a slight surge in the intraday session. It is forming weak bullish candles on the daily chart.
The upside momentum of the PENDLE can see a halt near the value of $8. Meanwhile, the downside trend of the asset price can see a bounceback from $5.
The RSI of Pendle is currently at 63 with a positive slope in it. The overall momentum of the RSI and MACD is bearish in nature.

PENDLE BEARISH TRADEPendle Makes 4hr double top pattern and also retest it`s neckline and rejected many time so we planned short in premium group and it`s running well. targets and all mentioned in chart. BYBIT:PENDLEUSDT.P
