US Dollar Index (DXY / USDX) – Long-Term Structure & Macro ConteUS Dollar Index (DXY / USDX) – Long-Term Structure & Macro Context
Introduction
The US Dollar Index (DXY) plays a central role in shaping global liquidity, commodity cycles, and risk sentiment.
This analysis focuses on the long-term structural framework of the Dollar and is intended strictly for

Part 2 Candle Patterns Profit Potential in Buying Options
a) Unlimited Upside in Call Buying
Max profit can be extremely high if stock surges.
b) High Return on Small Investment
Low premium gives high leverage.
Example: ₹5,000 investment generating ₹25,000 profit.
c) Best for Momentum Trades
Short-term sharp moves c

SME IPO Buzz: The New-Age Gateway to Huge Profit OpportunitiesIn recent years, SME IPOs (Small and Medium Enterprise Initial Public Offerings) have emerged as one of the most talked-about wealth-creation avenues in the Indian stock market. While mainboard IPOs attract headlines and institutional money, SME IPOs have quietly delivered extraordinary listing gain

Premium Chart Patterns Practical Application of Chart Patterns
Chart patterns are not foolproof but are valuable tools when combined with other technical indicators. Traders often use volume analysis to confirm pattern breakouts, as significant volume adds credibility to the pattern. Risk management is essential, with st


Divergence Secrets Risks in Option Trading
High volatility risk
Time decay for buyers
Unlimited loss for sellers
Gap-up or gap-down opening risk
Liquidity issues in stock options
Wrong position sizing leads to heavy losses
Tips for Option Traders
Always trade with a clear plan: entry, exit, stop-loss.
Avoid t

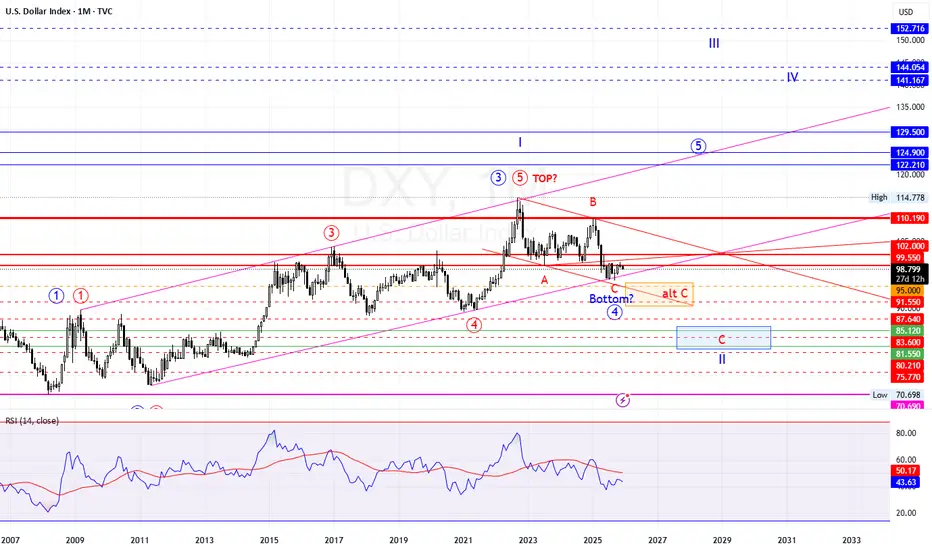
DXY – Monthly Elliott Wave Analysis | Major Support Test AheadDXY – Monthly Elliott Wave Analysis | Major Support Test Ahead - DEC 2025
Previous Analysis:
The US Dollar Index (DXY) appears to be completing a major corrective (A-B-C) structure after topping around 114.78, which is potentially the Wave ⑤ top of a long-term cycle. The index has retraced sig
DXY(DollarIndex) Sell Pressure in Weekly time frameIt seems dollar is under correction in Weekly time frame, and it suggest's it's getting weakening for an Target of 94.650

DXY Strong bearish continuation. Sell-side liquidity swept below range; smart money positioned short for markup into discount arrays. Reduced buy pressure and building downside volume below

Dollar seems Bearish for Long termDollar index(DXY) seems to entering the bearish setup for an Target of 94.500.
As per wave analysis one can go for shorting the Dollar for the above target.

See all ideas
Displays a symbol's value movements over previous years to identify recurring trends.
Frequently Asked Questions
US Dollar Index reached its highest quote on Sep 28, 2022 — 114.680 USD. See more data on the US Dollar Index chart.
The lowest ever quote of US Dollar Index is 88.143 USD. It was reached on Feb 16, 2018. See more data on the US Dollar Index chart.
US Dollar Index is just a number that lets you track performance of the instruments comprising the index, so you can't invest in it directly. But you can buy US Dollar Index futures or funds or invest in its components.