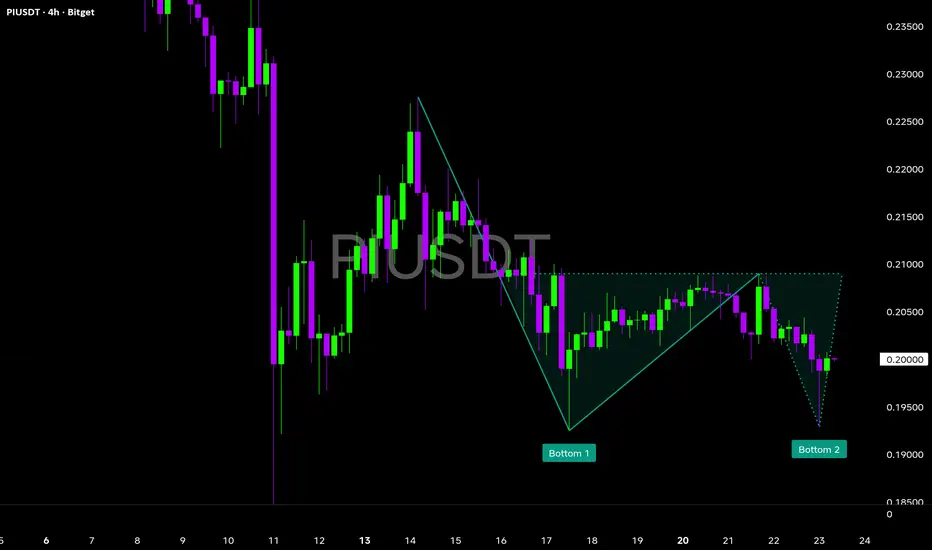
$PI forming a potential double-bottom — patience still keyNASDAQ:PI forming a potential double-bottom — patience still key ⏳
After the sharp rejection from the highs, price formed Bottom 1, bounced, and is now revisiting a similar zone to print Bottom 2. This is a classic area where the market decides whether buyers step back in or the range breaks down.
What’s important here is confirmation, not prediction.
Bullish expectation:
• Strong hold above 0.202–0.200
• Break and close above 0.208
• Opens upside toward 0.212 → 0.218
Bearish risk:
• Clean loss of 0.200
• Could slide toward 0.195–0.191
Right now, #PI is still inside a decision box. Let the second bottom prove itself before taking bias — the real move starts after confirmation, not during uncertainty.
What traders are saying

$PI is currently trading inside a tight triangle structure NASDAQ:PI is currently trading inside a tight triangle structure on the 1H chart, showing clear compression after the recent downside move. Price is making higher lows while facing consistent rejection near the upper trendline — a classic pressure-building setup. This kind of structure usually doesn’t last long.
Right now, the market is waiting for confirmation.
Bullish scenario:
• Clean breakout and close above 0.206–0.208
• Opens room toward 0.212 → 0.217
Bearish scenario:
• Breakdown below 0.202
• Pullback likely toward 0.198 → 0.195
As long as price stays inside this triangle, patience is key. The real move starts after the structure breaks — not before.
Watch the candle close. That’s where the answer is.

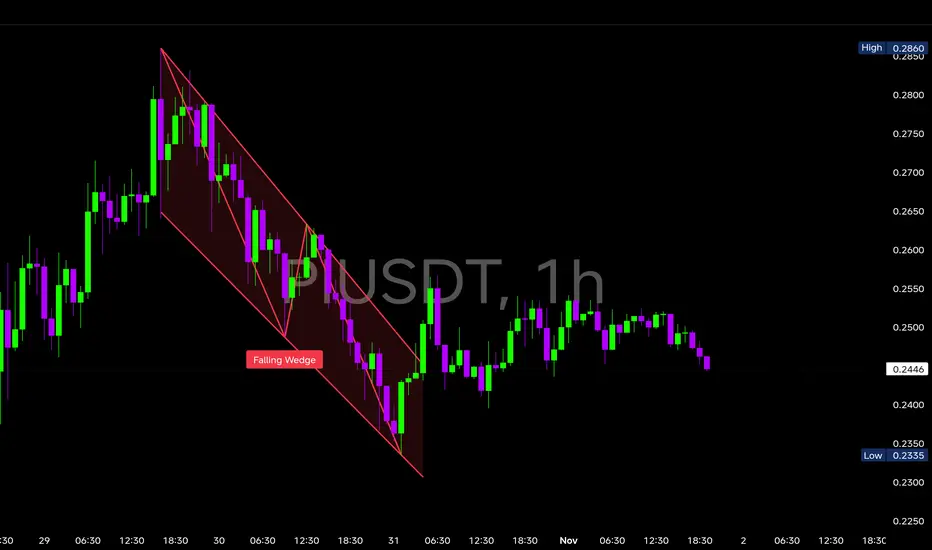
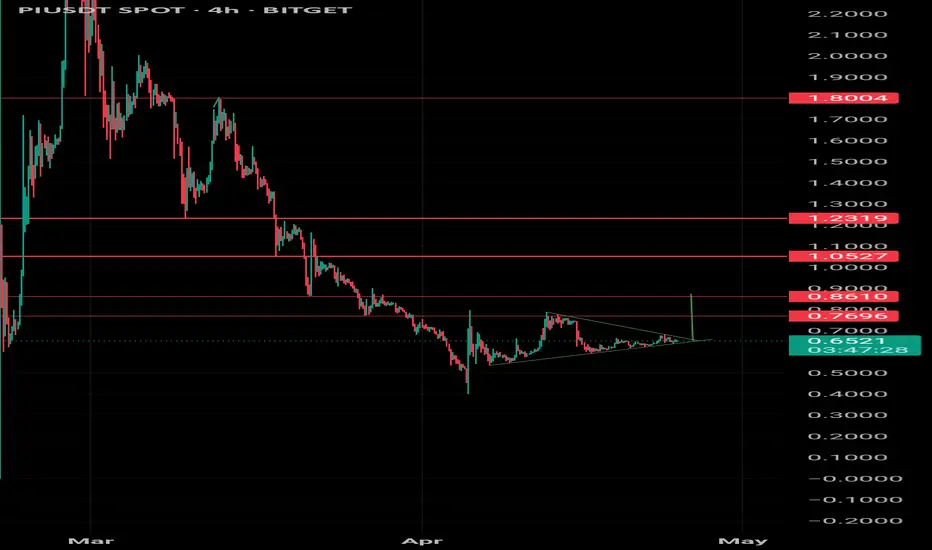
$PI is showing a Falling Wedge on the 1H chart NASDAQ:PI is showing a Falling Wedge on the 1H chart
🔹 Key Support Zones
$0.243 – $0.245: Wedge support zone (critical defense).
$0.235: Extended downside if pattern fails.
🔹 Resistance Zones
$0.252: Wedge breakout level.
$0.260: Next immediate resistance after breakout.
$0.275 – $0.280: Target zone on confirmation (aligns with previous structural highs).
Support stands strong around $0.243 – $0.245, while a close above $0.25 could trigger a rally toward $0.260 – $0.280! 🚀
Keep eyes on the wedge breakout and trade with discipline! ⚡
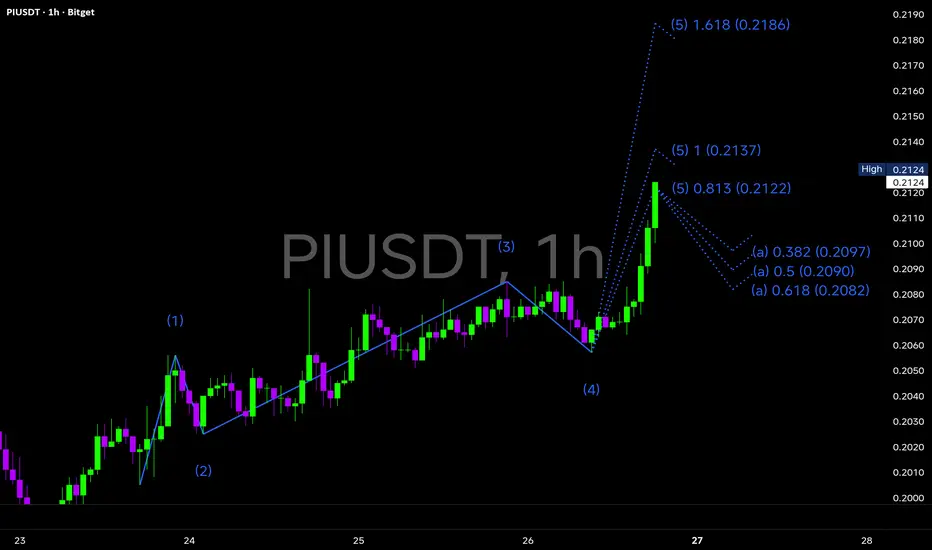
$PI is currently completing its 5-wave impulse structure NASDAQ:PI is currently completing its 5-wave impulse structure on the 1H chart — signaling the end of Wave (4) correction and the start of a potential explosive Wave (5) rally.
The structure clearly shows Wave (1) → (4) formation, with Wave (5) extension now active.
Immediate upside targets lie at:
🔹 0.2117 (0.75 fib projection)
🔹 0.2137 (1.0 fib extension)
🔹 0.2186 (1.618 fib target) — if momentum continues 🚀
RSI supports short-term bullish continuation but nearing overbought, hinting a minor pullback before the next leg.
🔁 Possible Retracement Zones (after Wave 5 completes):
0.2094 (0.382 fib)
0.2087 (0.5 fib)
0.2080 (0.618 fib) — strong accumulation zone
🎯 Short-Term Outlook:
#PI looks primed for a measured push toward 0.218, completing its fifth wave pattern.
Watch for pullbacks near 0.208 — could offer re-entry for continuation toward new highs.
A confirmed breakout above 0.214 may trigger momentum buyers into action.
$PI forming a Potential Double Bottom Pattern!NASDAQ:PI forming a Potential Double Bottom Pattern! 📉
#PI is currently testing a crucial reversal zone after completing two symmetric dips near the $0.19–$0.20 support — hinting at a possible double bottom formation.
🔸Bottom 1: Formed near $0.193, marking the first major support test.
🔹Bottom 2: Retesting the same zone with decreasing sell volume — a sign of bear exhaustion.
🔸Neckline resistance: Around $0.208–$0.210 — a breakout above this level could confirm bullish reversal momentum.
🎯 If confirmed breakout: Price could push toward $0.215 → $0.22
⚠️ If rejection continues: Watch the $0.19 zone — losing this may extend downside pressure.
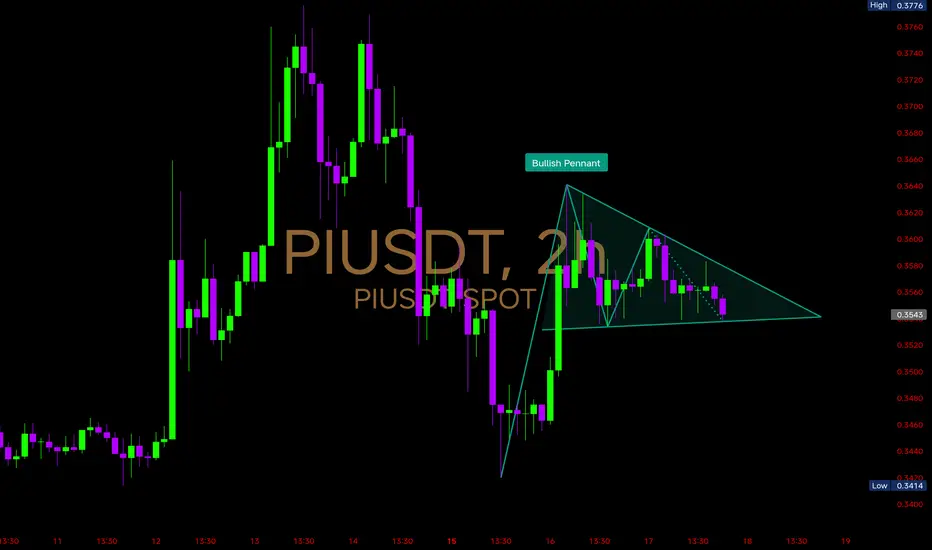
$PI is coiling inside a Bullish PennantNASDAQ:PI is coiling inside a Bullish Pennant, and the next move depends on whether bulls can break through $0.365 🚀
Support Zone: $0.341 – $0.345 (recent low & pennant base)
Resistance Zone: $0.360 – $0.365 (upper pennant trendline)
Breakout Trigger: A clean break above $0.365 could confirm the pennant breakout.
🎯 Upside Targets if breakout succeeds:
$0.377 (recent high)
$0.390 (measured move of pennant)
$0.41+ (extension target if momentum continues)
⚠️ Bearish Scenario:
If price fails to hold $0.341, we may see a pullback towards $0.325 – $0.315 support region.
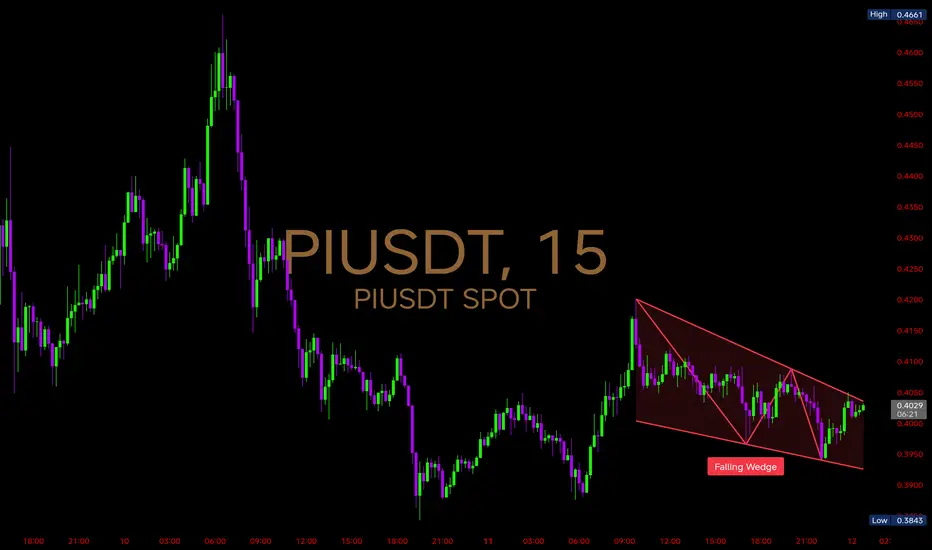
$PI 15mins Chart Analysis NASDAQ:PI 15mins Chart Analysis
Price is currently trading inside a falling wedge — a pattern often seen as a bullish reversal setup when confirmed with a breakout.
🔍 Key Observations:
Price is compressing between lower highs & higher lows within the wedge
Current range: 0.3843 (low) to 0.4050 (upper wedge resistance)
Breakout confirmation would require a close above 0.4100, ideally with volume expansion
Support at 0.3950 remains key for wedge integrity — losing it could delay reversal potential
📈 Probable Scenarios:
Bullish Case: Breakout above 0.4100 triggers short-term relief rally, potentially retesting 0.4200 zone
Bearish Case: Breakdown below 0.3950 could invalidate wedge and resume the corrective leg
This wedge could mark the early signs of seller exhaustion. Watch for breakout confirmation before anticipating stronger upside momentum.
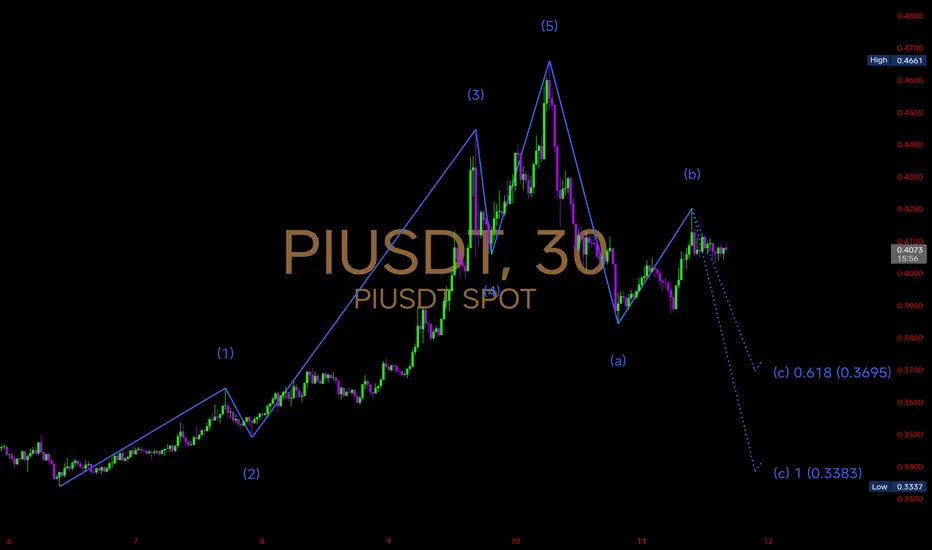
$PI – Elliott Wave Correction Unfolding NASDAQ:PI – Elliott Wave Correction Unfolding
The recent 5-wave impulse topped at 0.4661, marking a strong rally phase ✅.
Now, the structure is shifting into a corrective ABC wave:
Wave (a) completed with a sharp drop
Wave (b) rebound nearing completion around the 0.4100 region
Wave (c) projection:
First support at 0.3695 (Fib 0.618 retracement)
Deeper correction possible towards 0.3383 if selling pressure accelerates
📊 Key Observations:
Short-term structure favors a bearish pullback before the next bullish setup
Watch 0.4100 — failure to break higher keeps correction in play
High volatility expected during completion of Wave C
Conclusion : If price holds above 0.3695 after the correction, bulls may regain control. But a break below could extend the retracement to 0.3383 before any major rebound.
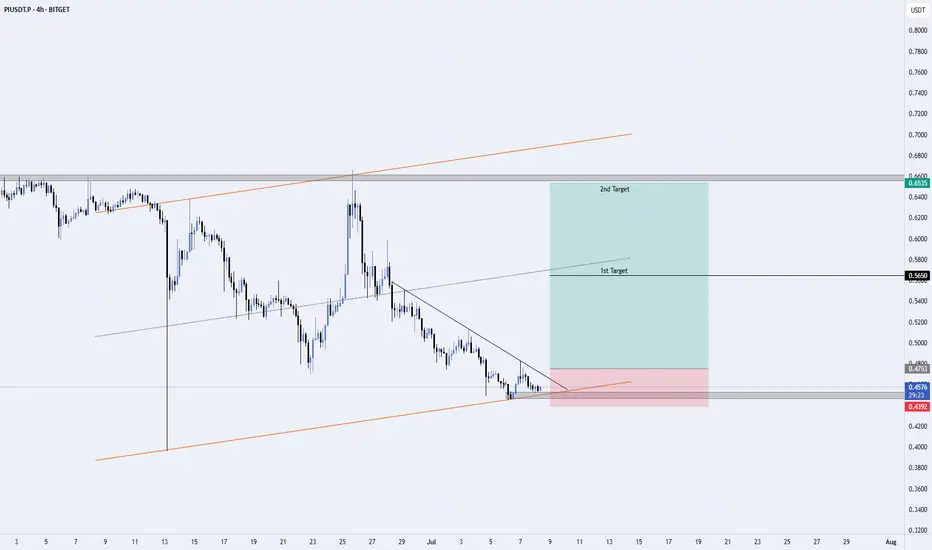
PIUSDT – Potential Long Setup from Ascending Channel Support (4HI’m watching PIUSDT closely as it approaches a significant confluence of technical levels on the 4-hour chart:
🔹 Key Highlights:
Ascending Channel Support: Price is testing the lower boundary of the channel (orange trendline).
Descending Trendline Resistance: Creating a wedge structure—breakout potential if momentum builds.
Bullish Structure: Clear rejection wicks and consolidation near support suggest accumulation.
✅ Trade Plan:
Entry Trigger: Confirmed breakout and close above the descending trendline.
Targets:
🥇 1st Target: 0.5650 (local resistance)
🥈 2nd Target: 0.6550 (major horizontal resistance)
Stop Loss: Below 0.4392 (breakdown invalidates the setup)
⚠️ Risk Management:
Always use proper position sizing and a disciplined stop loss. This setup is shared for educational purposes—do your own research before entering any trades.
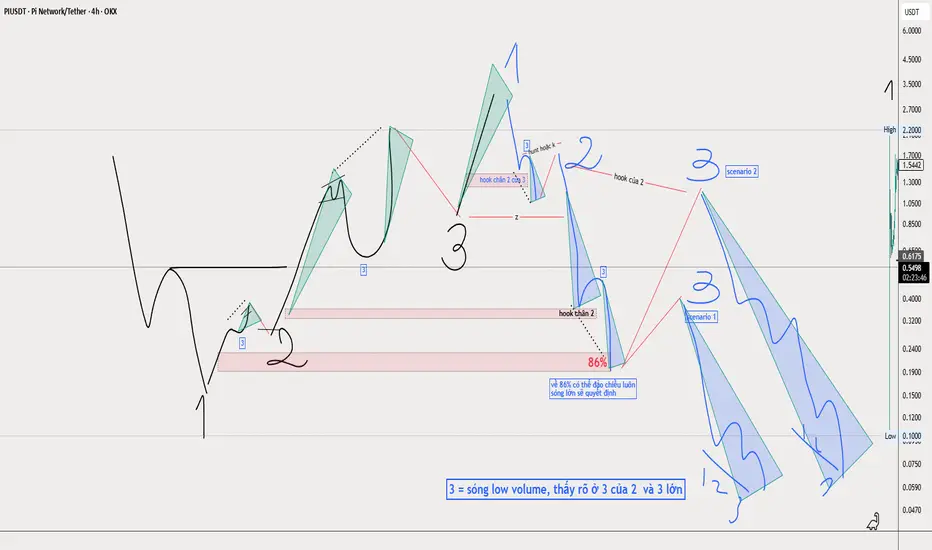
anatomy of hook 123f and counting numbersanatomy of hook and counting number abcs song 123
swing 1 = swing 1 + 2 + small mini low volume 3 of 1
swing 2 = swing 1 + 2 + swing 3 low volume 3 of 2
swing 3 =big low volume
swing 3 low volume = swing low volume continuation 3 +3
after break high/ low that made the swing, count 3 fractal --> high probability of reversal here
PIUSDT playout testTesting the waters with PIUSDT analysis – still learning the ropes, so this is more of an exploration than expert advice. Watching how Pi Network is pairing up against USDT to understand potential trends, support/resistance levels, and what the market sentiment looks like. Feedback and tips welcome
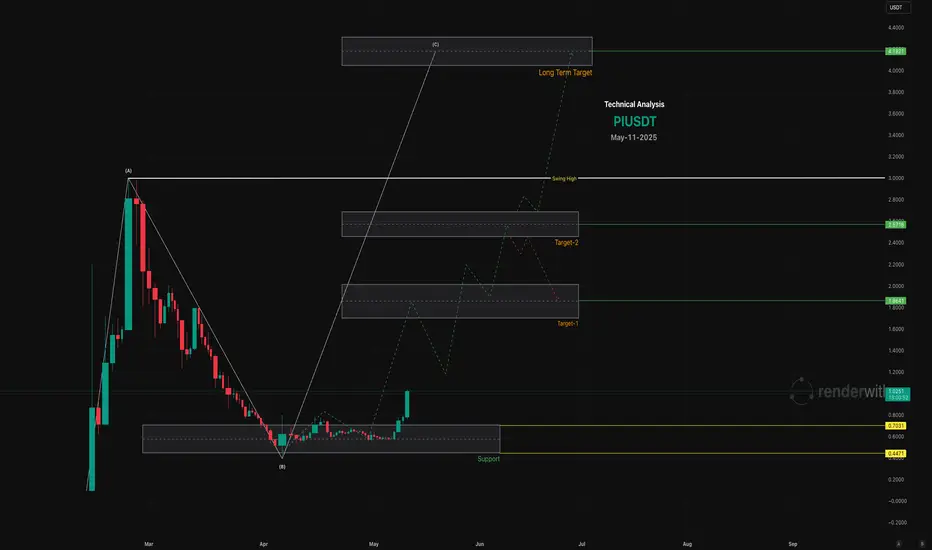
PI Network Can Touch $4 In This Bull Run
Support: Key support levels are at $0.5192, $0.5465, and potentially $0.40 (all-time low) if selling pressure persists.
Resistance: Immediate resistance is at $1.7000, $2.000, A break above $1.70 would signal a strong bullish reversal.
Psychological Levels: $2.00 is a critical psychological barrier, with $2.98 (all-time high from February 2025) as a long-term target.
Chart for your reference
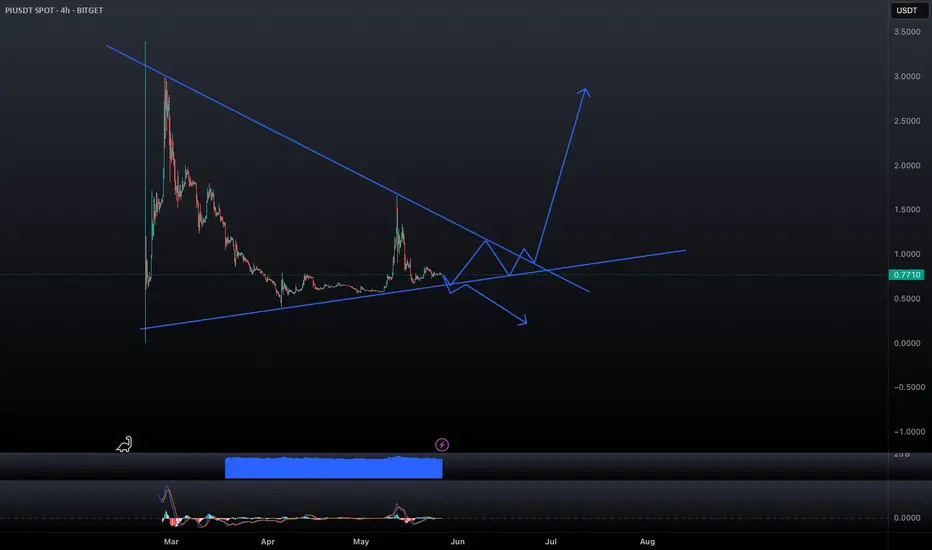
PIUSDT Breakout Watch - Targets AheadPIUSDT is currently consolidating in a symmetrical triangle on the 4H chart. A breakout from this pattern could bring strong momentum. If it breaks out to the upside, these are my key resistance levels and potential targets:
First Target: $0.7696
Second Target: $0.8610
Third Target: $1.0527
If these levels are broken with volume, the next major resistance lies at $1.2319 and $1.8004 respectively.
Always manage risk properly, especially around key breakout zones. Let’s see if PIUSDT gives us a clean breakout and follow-through.
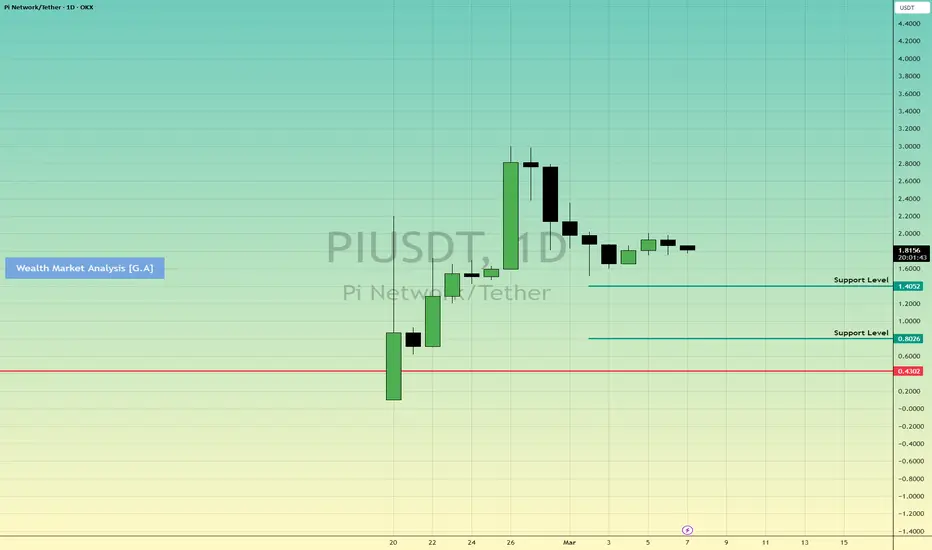
A very good buying opportunity in pi network coin.PI coin is in a very good demand zone in daily time frame. Legout of the demand zone is very good. We can target 2.8 level in pi which is a supply zone. Trade has good risk to reward ratio of 1:4. Follow risk management

A daily candle rejection of PI and potential places to get in.After the launch of NASDAQ:PI , it was listed in several exchanges. Around the same timeframe Binance's official website conducted a voting wheather to list PI. More votes were secured in favour of listing. This pumped the price as high as 3$ and consecutive fall happened because the official Binance said they will only list PI after properly studying the project. The current place is likely to get rejected and it will run farther down. And the below supports are the places I will consider bidding. After some time under 1$ mark, Binance will come again for listing, hopefully.
MEXC:PIUSDT
PiUSDT @ 0.6075/1.2333PiUSDT @ 0.6075/1.2333
Support: 1.12
Above 1.57, we can see move towards 2, 2.7 and 3.
Break of 3, next target zones:
3.3-3.6-4.2
5.07-5.4-6
6.8
7.4-7.8-8.4
Further 9.8-10.2-11.34, 15.77.
NOTE: My views are for long term only. Not intra or short term.

Best price to buy PIBased on current price action. Best price to buy this is marked.
Note that buying might be risk and one might have to hold for longer period of time.
We must always look to buy cheap or low price so holding will be easy.
Thank you
Follow for more.
Girish Anchan
WMA
Just a ViewPI network is looking good. As it has taken support of 0.5 level of FIB i.e. 1.55$ and bounced from there. If it breaks the level of 3$ then the 1st target will be $5 and 2nd target $8 .
View is intact until it hold its support or else the view will be invalidate and it will fall for its another support $0.8.
This is just a view from my side. Do your own research and do investment as per your risk management.
Thank you 🙏🙏🙏🙏🙏

A great buying opportunity in pi network coinPiUsdt is in daily timeframe demand zone. The legout of the demand zone is very nice so there are very high chances of market going up from here. And one more important thing is there important fibonacci level of 61.8 also. This trade has a good risk reward ratio of 1:7. Trade with proper risk management.

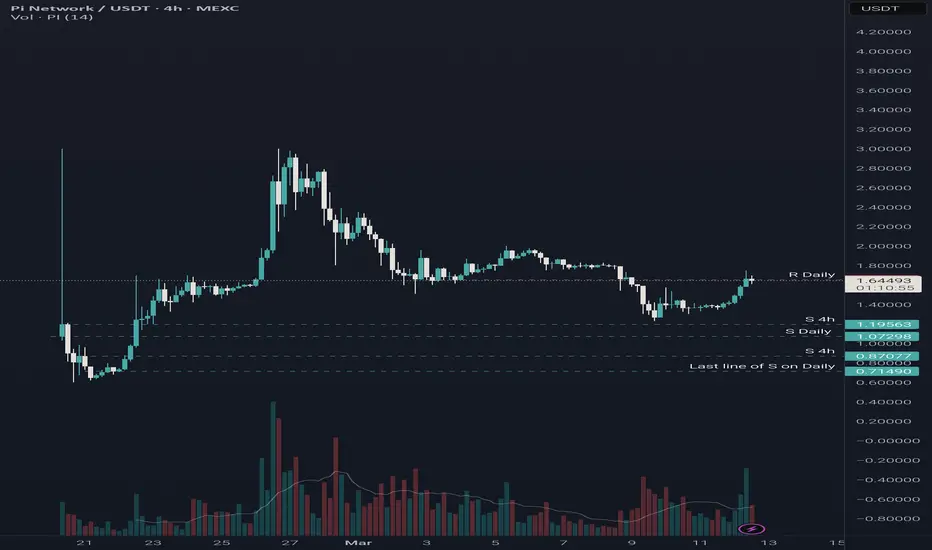
PI support zonesI have marked the 2 significant support zone for PI coin right now. We can expect price to take off from any one these levels. This time price is expected to reach 4.5$ levels or above.

PI spot chart 2 $ targetPrice has been consolidating last 2 days testing the trendline multiple times, We can expect price to break the trendline and push upto 2$ level soon and above.

PIUSDT / PINETWORK / PICOIN: BIGGER PICTURE ANALYSIS 20-FEB-2025PIUSDT / PINETWORK / PICOIN: Bigger Picture Analysis 20-FEB-2025
As you all know, Pi Coin is listed in the market and fall below 3$ after listing.
CMP: 1.83
Resistances: 16.96/200/500
Immediate resistance 17. Pi need a break of this for move to the next level of 31.
Upside targets level by level:
Level 1: 31, 119, 233, 314, 440
Strong Resistance 500. Break of 500 next we can see 610, 721.
Further, 810-883-1001, 1164, 1314-1377-1498.
Ultimate Target Zones: 440-610, 810-1001, 1314-1498, 1805-1887-2119, 3050.
This is my analysis for long term.
