RNDR/USDT Long SetupRender (RNDR) is showing a promising long setup after rebounding strongly from a well-tested support zone. The price broke out of a tight consolidation range with a decisive bullish candle, signaling renewed buying interest. This breakout was accompanied by a surge in volume, confirming participation from larger players. After the breakout, RNDR formed a bullish retest with a higher low, indicating that buyers are stepping in early. The structure now shows a shift from sideways to upward momentum, and as long as the current bullish structure holds, RNDR appears poised for further upside with the next key resistance zone in sight.
RENDERUSDT.P trade ideas

Render Network - Set to Surge from Next Month OnwardCurrent Price and Market Context
Current Price: ~$3.04 USDT with a 24-hour trading volume of ~$55.4M).
Recent Performance:
Down -21.97% over the past week.
Down -30.62% over the past month.
Down -58.58% over the past year.
All-Time High: $13.6330 USDT on March 17, 2024.
All-Time Low: $0.274 USDT on June 18, 2022.
Market Sentiment: Technical analysis from TradingView indicates a strong sell signal on daily and weekly timeframes, with a bearish outlook on monthly charts.
#Support Levels
Support levels are price zones where buying interest has historically prevented further declines, often identified by chart patterns, Fibonacci retracements, or high-volume areas.
$3.50–$1.80 (Key Support Zone):
This zone has been a strong demand area, with multiple bounces observed (e.g., double bottom formation).
A daily close below $1.50 could invalidate this support, targeting lower levels still we are in buying zone even if we breal 1.5
This level aligns with historical accumulation zones and increased volume, indicating strong buying interest.
Resistance Levels
Resistance levels are price zones where selling pressure has historically capped upward moves, often aligned with Fibonacci retracements, psychological levels, or prior highs.
$4.20–$4.245 (Immediate Resistance):
Acts as the middle line of a descending channel on shorter timeframes (e.g., 1-hour, 4-hour charts).
Recent rebounds from $4.20 suggest selling pressure at this level.
$5.00–$5.64 (Major Resistance):
A key psychological and technical barrier, with $5.00 noted as a near-term target in bullish scenarios.
Aligned with the green resistance zone ($5.747–$6.038) on TradingView, requiring high volume to break.
Take-profit targets for long positions are often set around $5.64.
For Support and resistance refer the chart for ur analysis
Trend - Will bullish in the next 1 or 2 3 weeks
-- Disclaimer --
This analysis is based on recent technical data and market sentiment from web sources. It is for informational purposes only and not financial advice. Trading involves high risks, and past performance does not guarantee future results. Always conduct your own research or consult a SEBI-registered advisor before trading.
#Boost and comment will be highly appreciated
$RENDER Could Be the Next Nvidia of CryptoCRYPTOCAP:RENDER Could Be the Next Nvidia of Crypto
CRYPTOCAP:RENDER is one of the strongest AI projects in crypto right now — and it’s only getting started. The dip you see now?
That’s an accumulation opportunity for long-term believers!
▶️ Best Buy Zone: $4 – $3.40
▶️ Targets: $8.6 / $15 / $25 / $40 / $50
▶️ Strong Support: $2.90 – $2.50
As long as we’re above that — we’re super bullish! ✅
Why CRYPTOCAP:RENDER Can Hit $30–$50 This Cycle:
✅ Solves real problems – powers AI, 3D, VFX, gaming
✅ Trusted by giants – Netflix, Disney, Apple, Unreal Engine
✅ Limited supply + burn = strong tokenomics
✅ On Solana now – faster, cheaper, better
✅ Rides the AI wave – GPU demand is booming
✅ Last cycle = 49x. This time? Bigger stage, bigger vision.
It’s like the Nvidia of Web3 — but decentralized.
👇 If you believe in the future of AI + GPU power…
Keep your eyes on $RENDER. This one’s not just hype.
NFA & DYOR
RENDER/USDT After liquidity sweep on buy sideRender/USDT token after liquidity swept on the buy side. Market maker Sell model (AMD Model)
Accumulation, Manipulation and distribution. Ict Concepts applied to Crypto Trading.

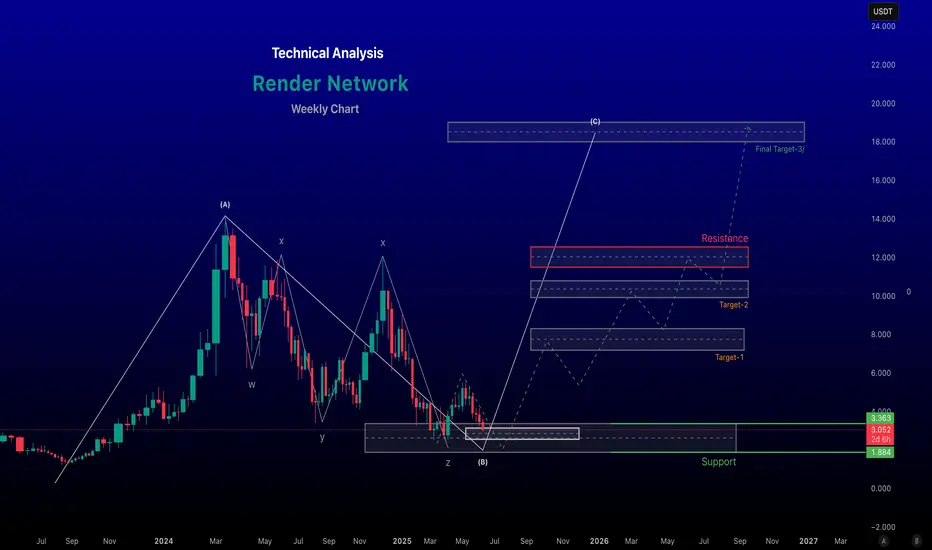
RENDER TECHNICAL ANALYSIS - WEEKLY🗣️The #render Network has shown significant price movement, reflecting both the volatile nature of #cryptocurrencies and specific developments within its ecosystem.
👉As of the latest updates, the price of RENDER is around $4.50 USD, with a 24-hour trading volume hovering around $64 million.
❣️Here's a brief #Chart overview based on recent data

RENDER/USDT Bullish Chart Analysis#RENDER/USDT Chart Analysis
CRYPTOCAP:RENDER looks promising, with the next uptrend depending on the $4 support level. If $4 holds, we could see a target of $20!
However, if $4 breaks, expect a potential drop toward $1 support.
Key Levels:
Strong Supports: $4 / $1.50
Resistance: $6.50

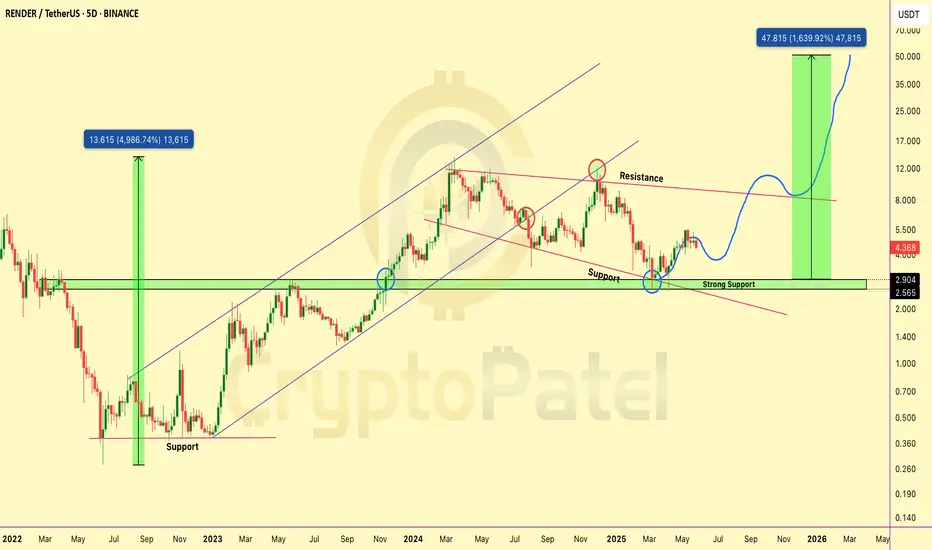
RENDER/USDT BULISH DEPIN CPU ON SOLANABINANCE:RENDERUSDT
The chart shows a bullish outlook for the RENDER/USDT pair, highlighting a strong support level near $3.41, which aligns with the 0.236 Fibonacci retracement level.
The price recently bounced from this support and is trending upwards, with a target near $17.05 by May 2026.
The chart also shows significant volume spikes, supporting the upward momentum.
The RSI indicates potential for further bullish movement, and the price is above key moving averages, adding to the bullish sentiment.
