Bullish Trade Setup for XRP/USD - Pattern CompletionThis is a bullish setup based on a harmonic pattern completing, with the price approaching a key resistance zone. Our entry, stop-loss (SL), and take-profit (TP) levels are clearly marked on the chart.
Entry: 3.0628
The entry point is marked when the price reaches the ideal level for the pattern completion.
Take Profit (TP): 3.1832
This is the target area where the price is expected to move towards, as per the harmonic pattern and previous price action.
Stop Loss (SL): 2.9627
The stop-loss is placed below the low of the last structure to protect from unexpected price movement.
Technical Analysis:
Pattern Identification:
A clear bullish harmonic pattern is visible, with points X, A, B, C, and D forming a potential Bat or Gartley pattern. This type of setup has historically shown a high probability of reversal or continuation at point D.
Price Action Confirmation:
The price has already shown some signs of reversal at point C, with increasing buying volume at the current levels.
The market sentiment is strong, and we are entering at a point where the pattern completion aligns with the overall bullish market structure.
Volume:
There is a noticeable increase in volume as the price approaches the resistance zone (point X), supporting the idea of a bullish breakout.
Risk-to-Reward (RRR):
The setup offers a 1:2.56 RRR, which is well within an acceptable range, ensuring that the potential reward outweighs the risk taken on the trade.
Why This Trade Makes Sense:
Pattern Confirmation: The harmonic pattern is completing, and price action aligns with the expectations of a move higher.
Key Resistance Break: If the price breaks above the marked resistance, this could signify a strong continuation of the bullish trend.
Solid Risk Management: With a well-placed stop loss, the trade is risk-managed while giving the price room to move.
This setup provides a good risk-to-reward ratio and a high probability of success, based on the technical confluence of the harmonic pattern and price action.
RIPPLE trade ideas

XRP/USD Trade Setup: Bearish Position on Technical AnalysisTimeframe: 1 Hour
Entry Price: 3.0229
Take Profit (TP): 2.8769
Stop Loss (SL): 3.1199
1. Market Overview
XRP is currently in a bearish phase, and the price action indicates that a downward continuation is likely. The market has been rejecting higher levels, with strong resistance at the 3.1777 zone, and now the price appears to be moving lower.
2. Entry Criteria:
The entry point is set at 3.0229, just below the current price level, where we anticipate the market to continue its downward movement after facing resistance at higher levels.
The recent price action shows a clear rejection from the upside, and we are expecting further downside once the price breaks below the immediate support near the entry.
3. Technical Indicators:
Heikin Ashi Candles: The chart uses Heikin Ashi candles, which help smooth the price action. The red candles indicate a bearish sentiment, confirming the continuation of downward pressure.
Volume Analysis: The increase in volume during the recent selling phase is confirming that the bears are in control and the trend may continue to the downside.
4. Support & Resistance Levels:
Resistance: The price is facing resistance around 3.1777, which has proven to be a significant level of rejection.
Support: The main support zone is located near the 2.8769 level, which coincides with our take profit (TP). This is a logical target as it aligns with previous lower levels and current trend structure.
5. Risk-Reward Ratio:
The Stop Loss is placed at 3.1199, just above the recent swing highs and resistance level, ensuring we limit risk in case of a market reversal.
The Take Profit is set at 2.8769, offering a solid risk-reward ratio of 1:1.5. This level is where we expect the price to find support and potentially reverse after hitting the target.
6. Trade Management:
Monitor Resistance Level: If the price fails to break below the entry and starts moving upward, consider adjusting the stop loss or exiting the position to limit losses.
Trailing Stop: Once the price starts moving in your favor, consider implementing a trailing stop to lock in profits as the price moves lower.
7. Potential Risks:
False Breakdown: A false breakdown is always a risk, where the price could temporarily dip below the support and reverse, hitting the stop loss before continuing lower.
Market Volatility: Be mindful of the inherent volatility in the crypto market, which can lead to sudden reversals due to news or other external factors.
8. Conclusion:
This trade setup is based on a bearish market structure, where price is showing clear resistance and the potential for further downward movement. The setup is logical with a strong risk-reward ratio and a clear target for profits. As always, risk management is crucial, and it's important to monitor price action closely for any signs of reversal.
Good luck, and trade carefully!

XRP - 3.98 or move is comingXRP is following wave theory and price will see minimum 3.98 will be seen in this up move.

Will XRP hit $10 in this Bull Market?XRP Monthly Chart Update
Chart by: @CryptoPatel
CRYPTOCAP:XRP is looking super bullish right now!
✅ Strong breakout confirmed above the long-term resistance
✅ Price is holding the $2.00 level as new support
✅ Retest likely before the next major leg up
📈 Next major targets: $9.36 → $14.83
Structure is solid, volume building, and the bullish momentum is real.
We're early — $10+ is on the horizon!
Long-term holders, this might be your moment.

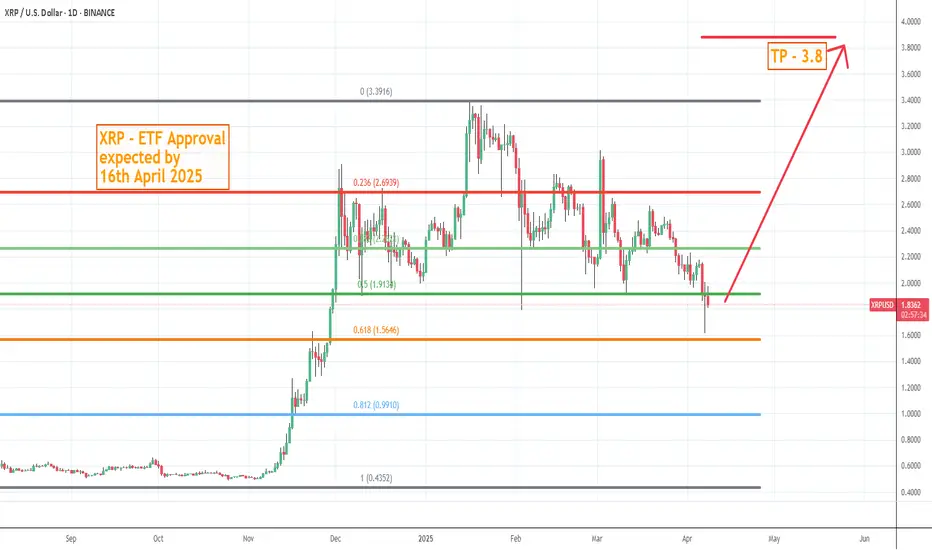
XRP - Bullish due to ETF Approval by 16th April 2025. BuyXRP - Bullish since price is at fib levels for buying and never came below that. ETF Approval by 16th April 2025 is keeping bullish and more accumulation and openly talked in media. ETF Approval means new buyer for XRP. Already Japan using this for govt related payments for its people. Big banks using in big way and having even more bigger plans with US Govt and official websites taking about XRP... This will rise 100 X as well in 2025 or coming years
Xrpusd - bull setup - H1 As of March 29, 2025, XRP is trading at approximately $2.07, reflecting a slight decline of 6.76% over the past 24 hours. The cryptocurrency has been experiencing sideways movement, consolidating between key price zones amid a market phase characterized by uncertainty, with buyers and sellers vying for control.
Recent market volatility has impacted XRP's performance. For instance, earlier this week, XRP declined by 5.1% following the announcement of worse-than-expected car tariffs by President Donald Trump.
Technical analysis indicates that XRP has dropped nearly 7% in 24 hours to about $2.22, below the 100-day EMA. It trades between $2.20 and $2.30, with support at $2.00 and $1.90.
Looking ahead, some analysts predict potential movements for XRP. One analysis suggests that XRP's current Golden Pocket aligns with an imbalance zone, indicating a possible 20% upward move if key support levels hold.
However, it's important to note that the cryptocurrency market remains highly volatile, and various factors, including regulatory developments and broader economic conditions, can influence XRP's price. For instance, recent tariff announcements have spooked risk traders, potentially leading to further declines.
In summary, while XRP is currently experiencing a slight decline and consolidation, future movements will depend on market dynamics and external factors. Investors should remain cautious and consider these variables when evaluating XRP's potential.

XRP BreakdownPrice closed below the trendline support and went to negative zone.
Best will be the retest the same trendline and continue down trend towards lower side support zone.
Happy Investing
Girish Anchan
WMA

Trump @ WH?The crypto market appears to be pricing in a potential Trump presidency.
Any disruption(sniper etc) to that scenario could trigger a negative market reaction biggest downtrend in history of crypto due to expectations of certain policies.
#xrp #btc #trump

$XRP plan for January-April '25The CRYPTOCAP:XRP #Ripple is in the beginning of the 3rd longest #ElliotWave on the way to the $5 aim.

$XRP to be or not to beThe CRYPTOCAP:XRP is testing support at $2.45 with a potential retest of the $2.40 and $2.25 levels if the support is broken.

Ripple hit 7 Years High: 500% up from Our EntryRipple hit 7 Years High:
🔹 XRP/USDT 500% up from our Initial Entry.
🔹 I am booking 80% Profit here for safe Zone.
🔹 500% Profit not bad guys.
I told you to buy at $0.40-$0.50 and ignore the negative news and drama (thanks, Gary Gensler). Hope you held strong because now you're in huge profits. 🎉
❤️ $3 is just around the corner.
What’s Next?
▪️ I’m expecting $3-$5 in this bull run for XRP.
▪️ Don’t repeat last bull run’s mistake: Holding blindly and not selling when it’s time.
My Suggestion:
▪️ Take out your initial investment and 70% Profit and hold the rest as profit.
▪️ While $10 is possible, it’s unlikely this bull market.
Smart moves can turn this into a big win.
Of corse NFA & DYOR

XRP/USDT $10 Potential In bull market🔥 CRYPTOCAP:XRP Monthly Chart Analysis 🔥
Looking at the #XRP monthly chart reminds me of the legendary 2017 Ripple bull run 🚀
🔰 Back then:
🔹 3 massive monthly candles with high volume printed a staggering 7400% gain in just 3 months.
🔰 Now:
🔹 We’ve already seen the 1st big monthly candle with high volume.
🔹 If history repeats, we could see 2 more massive monthly candles soon.
🔰 Potential Targets:
🔹 By the end of January or early December, XRP could hit $5+!
🔹 $10 is a riskier target, but if we get 3 big monthly candles, who knows? 😄
Are you also waiting for the next big monthly candle? Let’s see if #Ripple can make history again
(This is just my opinion, not financial advice. DYOR.)

XRP/USDT 366% up from our Entry so Book profit ?XRP Up 366% 🚀
I told you to buy at $0.40-$0.50 and ignore the negative news and drama (thanks, Gary Gensler). Hope you held strong because now you're in huge profits.
❤️ $2 is just around the corner.
What’s Next?
▪️ I’m expecting $3-$5 in this bull run for XRP.
▪️ Don’t repeat last bull run’s mistake: Holding blindly and not selling when it’s time.
My Suggestion:
▪️ Take out your initial investment and hold the rest as profit.
▪️ While $10 is possible, it’s unlikely this bull market.
Smart moves can turn this into a big win.
Of corse NFA & DYOR

XRP Next Move???XRP is making a triangle pattern on 1 hour chart, what are your throughts as to which side can we expect a breakout towards??

Technical Analysis Of XRP
Over the monthly graph, the price has shown an immutable trendline support, active for a prolonged time span. From this support, the massive shoots in price have manifested before, and for several months, its price has been lurking at the same dynamic support trendline. The price had waited a very long sturdily for the catalyst and the lawsuit to get over.
Since the lawsuit has ended, a catalyst could be around the horizon. Anytime, soon the price could blast off to the moon, with current generated optimism. The ATH over the monthly chart was at $3.31700, and the low was at $0.00281. Depending on the bullish wave of investors interest could hit the XRP towards retesting the ATH.
Over the weekly chart, the 4-year high was at $1.966, and the low was $0.170; if the bullishness increases, then the ATH can be achieved sooner, with interruptions to look at $0.750 and $0.970, respectively.
The indicators are strongly bullish, as both EMA hurdles have become support after the price pierced both of them. MACD showed a bullish cross, with a histogram at 0.0110, and the RSI flashed at 56.63, above the median line.
On the contrary, situation, if the price does not grow more and bears push their price down, then the supports to watch out would be present at $0.440 and $0.280, respectively.

PREVIOUS WEEK UPDATE!A nice week behind me. I just went through the charts and explained very quickly what had happened. I got into 3 positions, 1L, 1BE and 1 currently in a profit ( EURAUD). I had some time for myself and my family as it was just my birthday. New analysis will be posted soon. Have a great week. T

XRP Price Jumps 22% Following $100 Million Inflows : What’s NextXRP Price Jumps 22% Following $100 Million Inflows : What’s Next?
XRP price surged nearly 22% a week, validating the breakout of an interesting pattern on a daily chart.
The Open interest contracts have jumped from $375 Million to $475 Million rising $100 Million a week.
XRP price took a big leap and surged over 8.5% today surpassing the key 50 day Exponential moving average. Moreover, the intraday rise marks the breakout of an interesting channel pattern.
Furthermore, the recent development in XRP derivatives data has sparked an optimistic hope for the investors. The OI contracts have noted a surge of nearly $100 Million a week indicating a long buildup.
Earlier, XRP had been in a correction phase since mid April and had dipped nearly 40% from its recent highs. The recent breakout marks the end of a correction phase. It has a live market capitalization of $28.79 Billion and ranks 7th in the cryptoverse.
OI Data Suggests Long Buildup
XRP recovered from $0.42 level and made a breakout of a falling wedge pattern. The breakout was supported by a significant 20% rise in the volume. The intraday transaction volume has reached $1.85 Billion a day.
In tandem with the price development, there has been a robust development in the Open Interest data. As per an on-chain analytics website, the OI data surged by nearly $100 Million rising from $375 Million to $475 Million in a week.
The surge in OI data points to a long buildup in XRP. A surge in OI data reveals a rise in the outstanding contracts and increased market activity. The volume to market cap ratio lies near 6.73% indicating mild volatility. Out of 100 Billion total supply, nearly 55.8 Billion XRP tokens are currently in circulation.
XRP Looks Promising for 25% Bullish Rally
The daily chart highlights a breakout from a falling wedge channel pattern indicating the initiation of a new bullish phase. Moreover the breakout is supported by a significant rise in transaction volume and Open interest adding confirmation to a bullish breakout.
At the time of writing, XRP was up over 8.5% a day, exchanging hands close to $0.514. The bulls are in control of the trend at the moment due to which XRP price may keep soaring.
On the higher side, the analysts are assuming an upside potential of nearly 25% till the $0.64 level. On the contrary if the price suffers and looms back below the lower trendline, it may confirm a fake breakout and the price may suffer more.
Can XRP Continue To Rise?
XRP surged over 8.5% today, surpassing the 50-day EMA and breaking out of a falling wedge channel pattern. Moreover, the breakout is supported by a significant increase in transaction volume and open interest thus validating the breakout. The OI data has surged by $100 million in a week to $475 Million.
The daily chart highlights that XRP rebounded from $0.42, breaking out of a falling wedge pattern. Currently trading around $0.514, XRP shows bullish momentum. If the price continues to rise, it could reach $0.57 and $0.64. However, if it falls below the lower trendline, it may indicate a fake breakout and resume a downward trend.


The XRP asset has displayed bearish characteristicsThe XRP crypto has demonstrated a decline as the price sank from a vital supply level of around $0.73 on the chart, by mid-march 2024.
The asset has displayed bearishness and falling tendency as it plunged below major trend 50-day, and 200-day EMA's.
The XRP asset has displayed bearish characteristics, as the RSI has fallen smoothly and it near the oversold territory.
It has attained bad performance in the last week, month, and three months, by -7.80%, -2.90%, and -29.70% respectively, implying a stable downward direction.
Therefore, if the XRP crypto price fails to stay above the $0.4750 level, it could decline further. However, if the demand for the asset price increases it could bounce back strongly from the current level. The next goal for the price could be to reach $0.1200.

Recently, this week Ripple has been struggling to maintain its pRecently, this week Ripple has been struggling to maintain its position. When the price of Bitcoin plummeted, almost all crypto assets had a rough day. This week, the price has dipped by 7.80% due to a shift in market sentiment indicators portrays bearishness, as BTC was down. However, the candle formation on June 12th signifies that bulls are attempting to gain ground again.

the demand for the XRP risesFrom last month, the price has been consolidating in a range and has been trading beneath the 50-day and 200-day EMA's. A parabolic movement could burst in XRP if the struggle rules out in favor.
The XRP Daily Chart underscores that price control was in bears' hands, as it failed to reach last swing highs and declined at a constant pace.
However, the price structure was close to the demand zone, where new buyers could join. Moreover, the the final judgment by judge Torres could possibly catalyze the breakout this year in XRP. And if it is ruled out in SEC's favor, in that case, it could impact its price negatively.
The XRP crypto has been trading at $0.5259 at press time. The technical indicators are bearish, but minor bullish signs have appeared in MACD as it has a bullish cross. The RSI has reached 49.33. This shows uncertainties in the XRP crypto.
If the demand for the XRP rises, it could bounce back from its current level. The next goal for the price could be reaching $0.62500 and $0.72500 levels.
However, if the XRP crypto price fails to stay above the $0.49500 level, it could decline and reach lower levels.

If the demand for the XRP risesThe XRP Daily Chart highlights that price control was in bears' favor, as it failed to reach last swing highs and deteriorated at a constant pace. Also, it has been struggling below the 20-day. and 50-day EMA's.
However, the price structure was near the demand zone, where new buyers could join. Moreover, the positive optimism shared by the lawyer of XRP, for the acceleration in the final judgemnet after all briefs, could possibly become a catalyst for the breakout this year in XRP.
The XRP crypto has been trading at $0.51754 at press time. The technical indicators are bearish, but minor bullish signs have appeared in MACD as it has converged for a bullish cross. The RSI has reached 48, and it approaching to cut median line. Therefore, despite the bearish indicators, the scenario could flip to the upside.
If the demand for the XRP rises, it could bounce back from the current level. The next goal for the price could be reaching $0.62000 and $0.72000 levels.
However, if the XRP crypto price fails to stay above the $0.50000 level, it could decline further and reach lower levels.

XRP USD seems bullish for long termIt seems nice o prtunity to grab long move with minimum risk.
It is good opertunity for swing traders .
