RLC going goodPrice was consolidating below a descending trendline (blue). It has now broken above it with momentum, suggesting a bullish breakout.
• Entry Zone:
Current price is around 1.3480 USDT after reclaiming the breakout area. The long entry zone starts above this breakout.
• Stop-Loss Zone (Red Area):
P

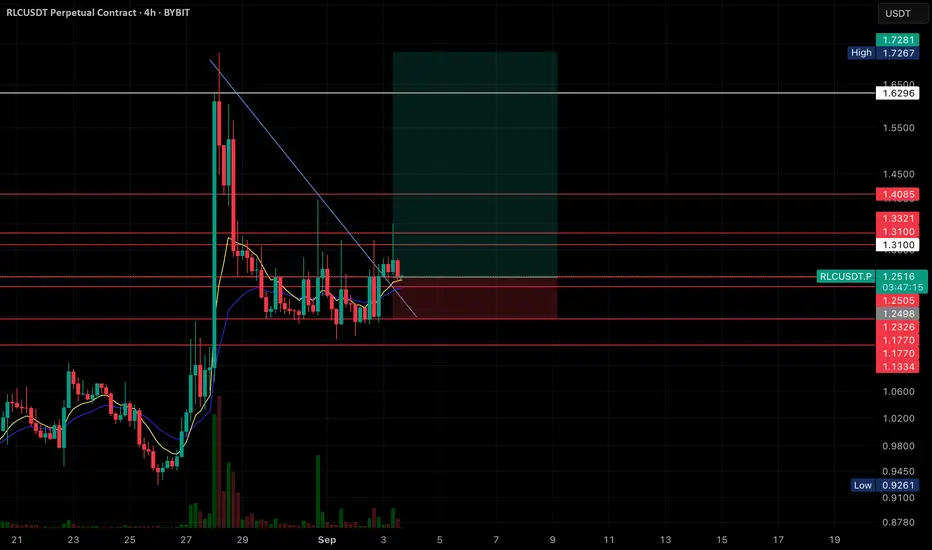
RLC BullishRLC/USDT – 4H Bullish Outlook
RLC has broken out of the descending trendline and is showing early signs of strength. Price is currently consolidating just above the breakout zone, holding support around 1.23 – 1.25.
📊 Key Levels:
• Support: 1.23 – 1.25, 1.17
• Resistance: 1.31, 1.33, 1.41
• Tar
RLC LONG IDEARLC falling wedge pattern detected in 6h timeframe. Also it is forming double bottom which is bullish sign for upcoming days. Expecting a bullishness from current price. If it gets some momentum then we will see 50% to 100% growth in upcoming weeks.
Targets could be 1.7, 1.9, 2.2, 2.6, 3.0
STOP 1.

RLC: 📈 Watch for potential opportunities.💎 Paradisers, #RLC is exhibiting a bullish market structure and might gather liquidity before reaching the bullish Order Block (OB).
💎If #RLCUSDT displays a Change of Character (CHoCH) and Break of Structure (BOS) from the bullish OB, we can anticipate a bounce from that point.
💎Should the bullish

RLCUSDTRLC looks bullish in short as well as long TF.
We buy here at the trendline support here at 1.21$ with TP 1&2 mentioned in the chart. A stoploss at 1.10$

RLCUSDTRLC looks bullish in short as well as long TF. We buy here at the trendline support here at 1.20$ with TP 1&2 mentioned in the chart. A stoploss at 1.10$.

Short setup for RLCFlag pattern consolidating in channel.
Finally break the trend line.
Expecting this time to make a new low.

RLCUSDTRemember our this trade, it was a bit volatile, but perfectly hit our TP...
Congratulation Folks...


See all ideas
Summarizing what the indicators are suggesting.
Oscillators
Neutral
SellBuy
Strong sellStrong buy
Strong sellSellNeutralBuyStrong buy
Oscillators
Neutral
SellBuy
Strong sellStrong buy
Strong sellSellNeutralBuyStrong buy
Summary
Neutral
SellBuy
Strong sellStrong buy
Strong sellSellNeutralBuyStrong buy
Summary
Neutral
SellBuy
Strong sellStrong buy
Strong sellSellNeutralBuyStrong buy
Summary
Neutral
SellBuy
Strong sellStrong buy
Strong sellSellNeutralBuyStrong buy
Moving Averages
Neutral
SellBuy
Strong sellStrong buy
Strong sellSellNeutralBuyStrong buy
Moving Averages
Neutral
SellBuy
Strong sellStrong buy
Strong sellSellNeutralBuyStrong buy