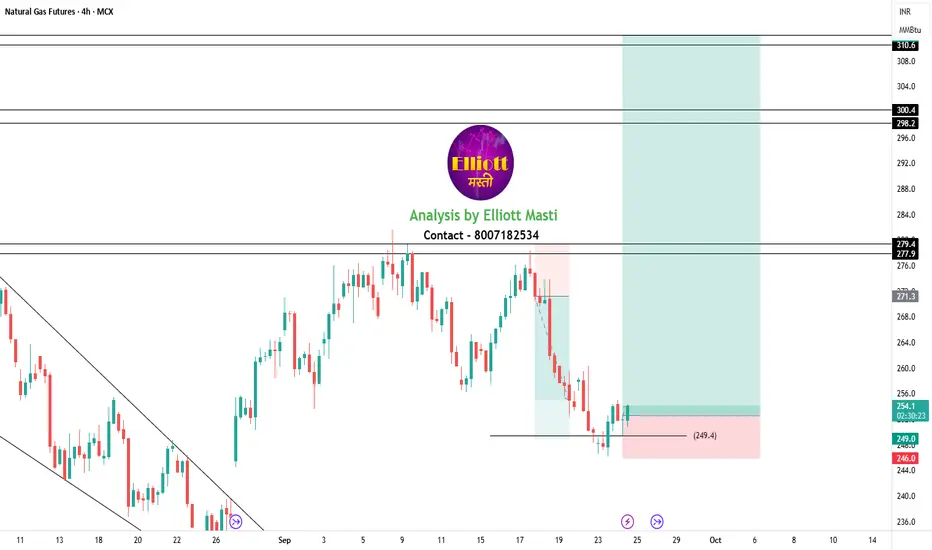
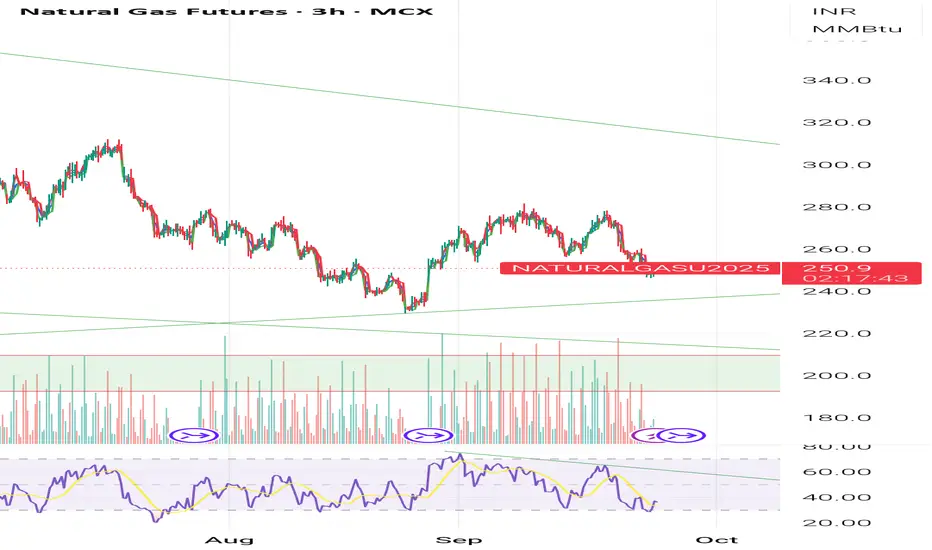
Natural gas 268-260 dip possible then buy upside 295-302 target Natural gas updated levels given on chart initially 268-260 fall possible then buy upside 295-302 upside short term target for next 2 -3 weeks
How My Harmonic pattern projection Indicator work is explained below :
Recent High or Low :
D-0% is our recent low or high
Profit booking zone ( Early
Related commodities
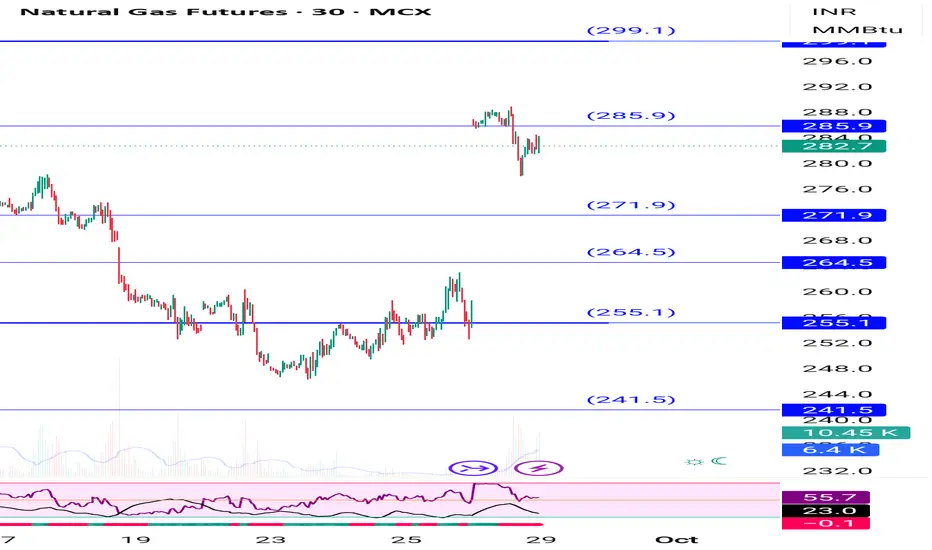
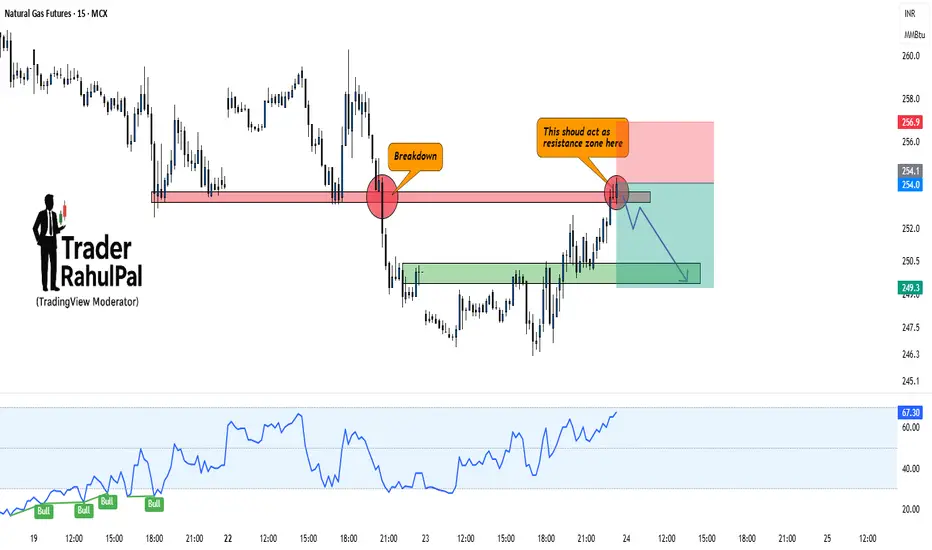
Natural Gas – Breakdown Retest Could Trigger Fresh FallHello everyone, Let's analyse Natural Gas and it has recently broken down from a key support level, turning it into resistance. The price is now retesting that zone, and unless bulls manage to reclaim it strongly, the downside remains the higher probability.
Current Setup:
Previous support arou
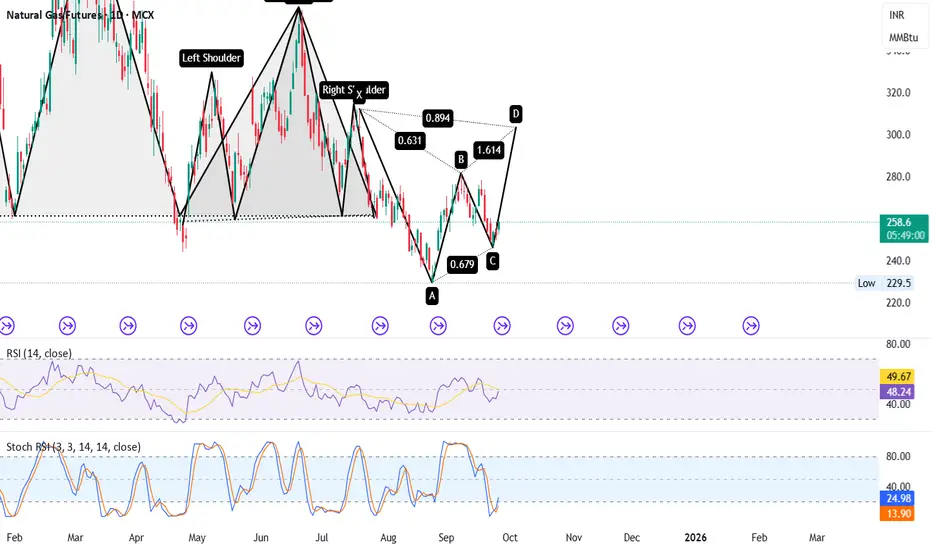
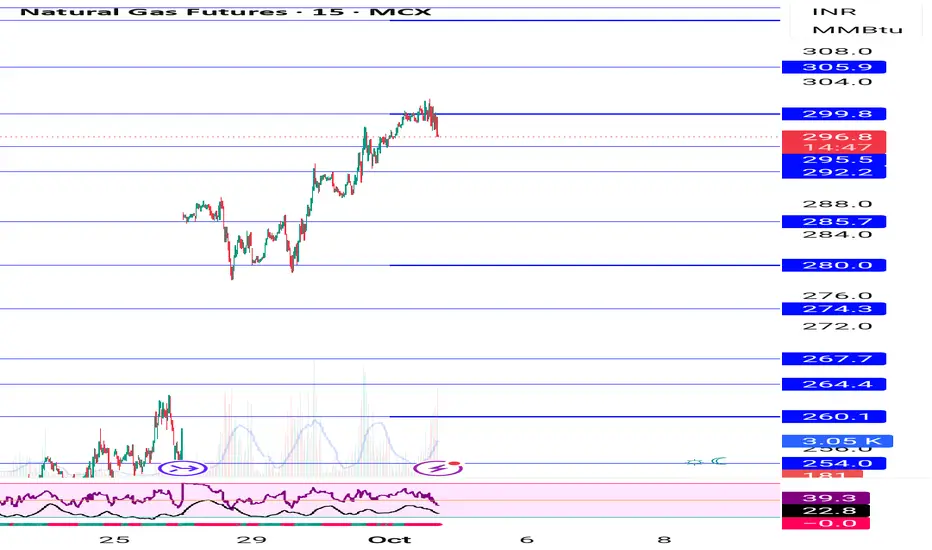
Natural Gas – Potential Bullish Reversal-304🔍 Key Highlights:
✅ XABCD Pattern Completion Zone:
XA to AB = 0.631 retracement
BC = 0.679 retracement
CD = 1.614 extension (projected move towards Point D)
✅ Bullish Structure in Progress:
Hidden Inverse Head & Shoulder supports bullish reversal
Confluence near Point C, increasing probabilit
Natural Gas My last analysis about natural Gas was failed now it is in no trade zone , update you soon as I will see a trade opportunity.
Natural Gas longWe can plan natural Gas long position for a short term with very small Stoploss and small target
But risk reward ratio is high
Disclaimer; for education purpose only

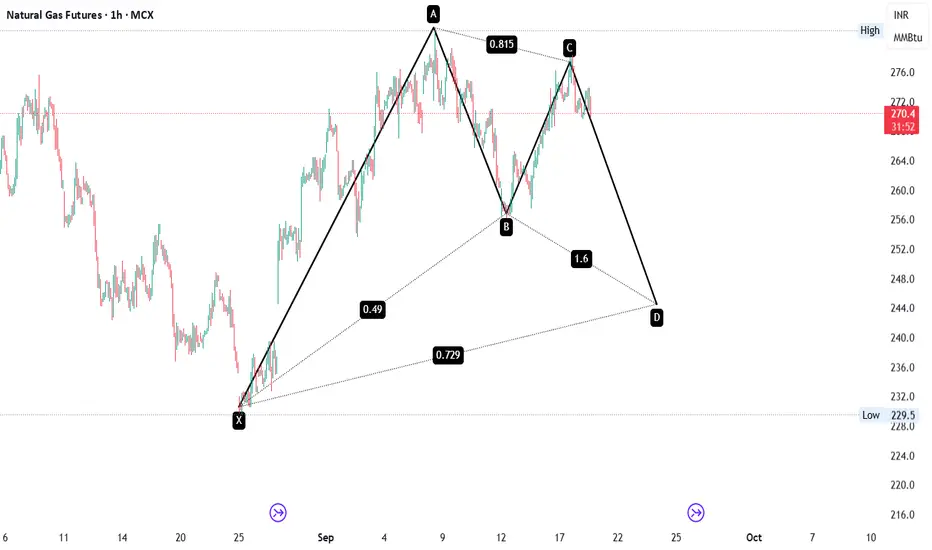
NATURAL GAS HARMONIC PATTERN
📈 Chart Pattern: Bearish Harmonic (Possibly Bearish Bat or Gartley Variant)
⚠️ Price Structure Breakdown:
A clean XABCD Harmonic Pattern is visible on the 1H timeframe:
🔹 XA Leg: Sharp impulsive rally from ₹229 → ₹281
🔹 AB Leg: Pullback retraced 49% of XA
🔹 BC Leg: Strong recovery to 81.5% of AB
Natural gas 302 target hit then some dip , again buy on dip 290Natural gas 302 target hit buy recommended near 280 , again buy near 290
How My Harmonic pattern projection Indicator work is explained below :
Recent High or Low :
D-0% is our recent low or high
Profit booking zone ( Early / Risky entry) : D 12.3% -D 16.1 % is
range if break them profit b
NATURALGAS1! 1D Time frame📍 Current Price
₹261
🔑 Key Levels
Immediate Resistance: ₹268 → ₹272
Immediate Support: ₹257 → ₹253
52-Week High: ₹366
52-Week Low: ₹188
Short-Term Outlook
Bullish Scenario: Sustained above ₹272 → possible move toward ₹280–₹285
Bearish Scenario: Falls below ₹257 → may test ₹253–₹250

NaturalGas BearishNaturalGas is taking resistance from Fibb 0.618 zone.
The RSI is also showing a hidden divergence with the price signalling further downside.
Close below 267.50 will take prices lower.
View neglected if prices moves above 285

See all ideas
Displays a symbol's price movements over previous years to identify recurring trends.