Buy in deep Opportunity SCIShipping Corporation of India Ltd presents a compelling mid-term buy opportunity near the critical 204 support, reinforced by a double bottom pattern on the daily chart. As a government-owned PSU in the booming shipping sector, it benefits from rising global trade volumes and India's maritime growth
Shipping Corporation of India Limited
No trades
Next report date
—
Report period
—
EPS estimate
—
Revenue estimate
—
24.33 INR
8.44 B INR
55.80 B INR
168.64 M
About Shipping Corporation of India Limited
Sector
Industry
CEO
Binesh Kumar Tyagi
Website
Headquarters
Mumbai
Founded
1975
IPO date
Nov 7, 1994
Identifiers
2
ISIN INE109A01011
The Shipping Corp. of India Ltd. is a holding company, which engages in the business of transporting goods, It operates through the following segments: Liner, Bulk, Tankers, Technical & Offshore and & Unallocable. The Liner segment includes break-bulk, container transport, passenger vessels, and research vessels managed on behalf of other organizations. The Bulk segment offers dry bulk carriers. The Tanker segment refers to both crude and product carriers, gas carriers, and phosphoric acid carriers. The Technical & Offshore services segment includes company owned offshore vessels, offshore vessels managed on behalf of other organisations, income from technical consultancy and passenger vessels & research vessels managed on behalf of other organisations. The Unallocable segment provides items and interest income or expenses are disclosed separately. The company was founded on October 2, 1961 and is headquartered in Mumbai, India.
Related stocks

Shipping Corporation of India LtdOverall trend: Bullish
Chart pattern: Ascending channel (bullish continuation)
Current phase: Healthy pullback after a strong rally
Structure: Higher highs and higher lows still intact
Pullback towards 220–225 is constructive and offers a good risk–reward swing buy, as long as
218 holds on a dail

Beautiful breakout of falling curve structure with volumesBy Jan'26 last week expecting the stock perform well & achieve the 2 targets.
The published idea is strictly not a recommendation so do consult your financial advisor before buying/selling any stock. Do like and share as it motivates a ton to me!
#shipping #india #containers #shipment

SCI 1 Day Time Frame 🔍 Price Snapshot
Live price around ₹254.20 (as of Nov 10, ~11:14 AM IST).
52-week range: ~ ₹138.26 (low) to ~ ₹280.50 (high).
📊 Key Daily Levels
Using pivot / support-resistance frameworks from sources:
Major Resistance: ~ ₹276-₹286
Primary Support Zone: ~ ₹247-₹256
Secondary Support: ~ ₹237-₹2
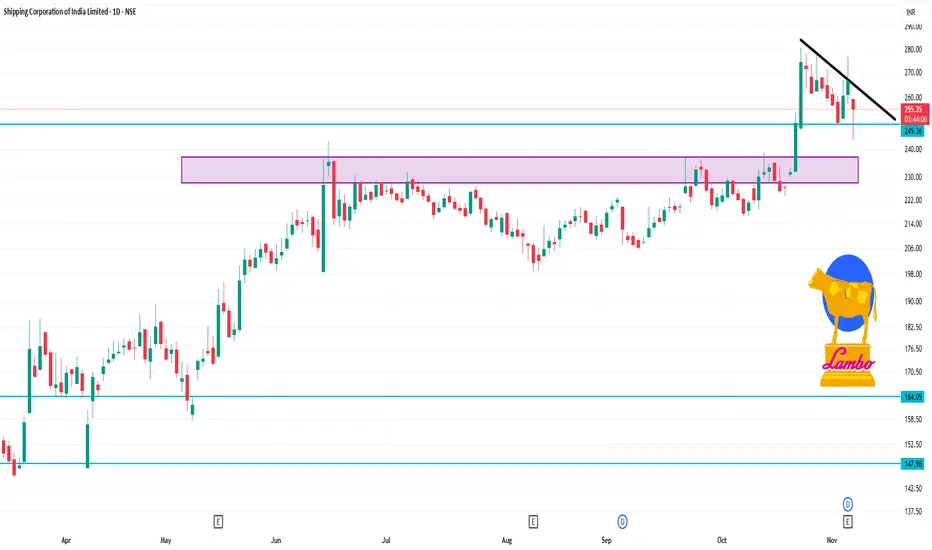
SCI- High-Volume Breakout ContinuationThe Setup: Breakout and Launch Pad
SCI has confirmed a major, high-volume breakout from a multi-year consolidation base. The stock powered through the previous overhead supply zone (the box around ₹240 - ₹250) and is currently consolidating tightly just above this newly established support.
Th
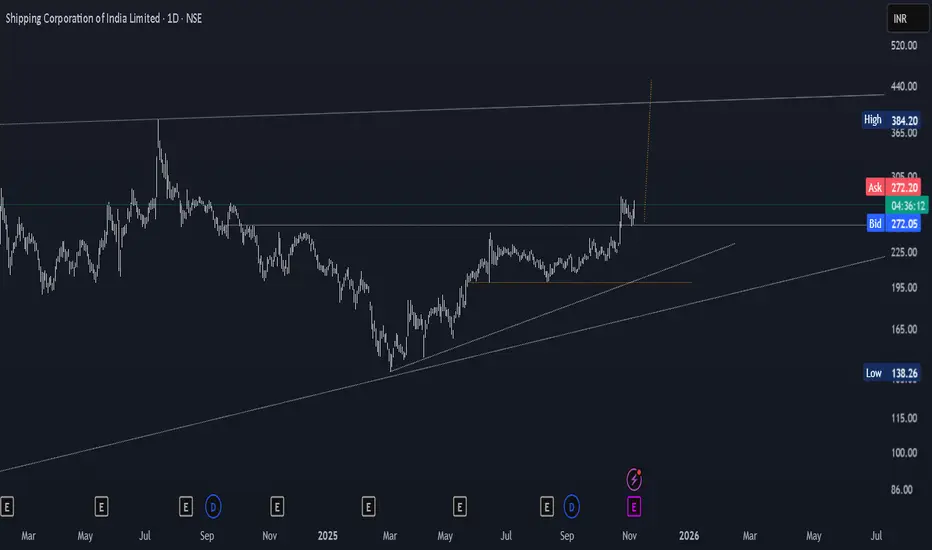
SCIbreakout of inverted head and shoulder pattern confirmation done then corrected to retest zone now showing buying strength . with support of 200 monthly and weekly closing chances of a rally towards 420-450 levels are high . accumulation zone comes around 240-280 .it took 12 month to form patter so
SCI Technicals+Results+GovtPush betFlag formation, slight volume rise before results today 7th Nov 2025, going in with 5% stop loss.
Do read before investing.

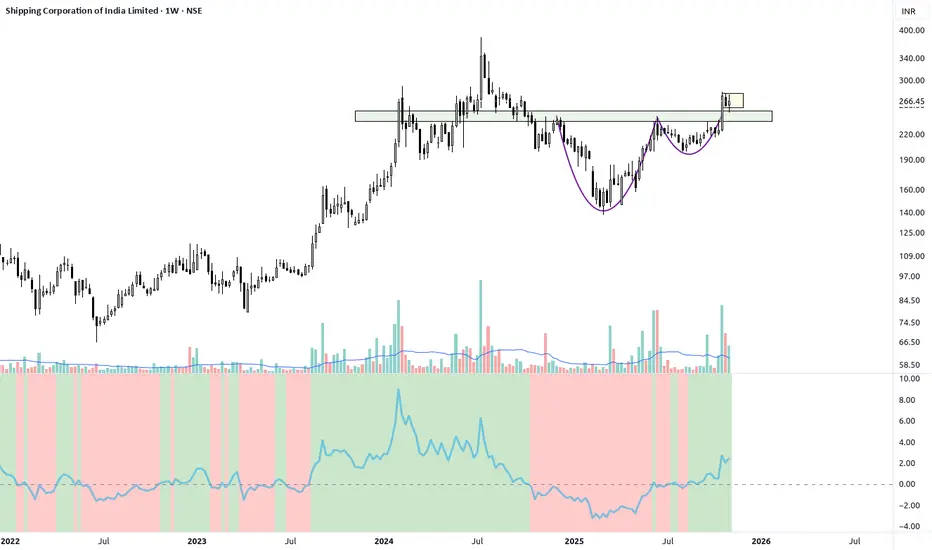
SCI - Chart of the Week
### 🚢 **Shipping Corporation of India – Weekly Breakout Setup**
**Chart Type:** Weekly (1W)
**CMP:** ₹274.35
**Resistance Zone:** ₹270–₹280 (Breakout Zone)
**Next Major Target:** ₹345
**Support Zone:** ₹225–₹230
---
### 📊 **Technical View:**
* After a long consolidation between ₹180–₹270, **SCI
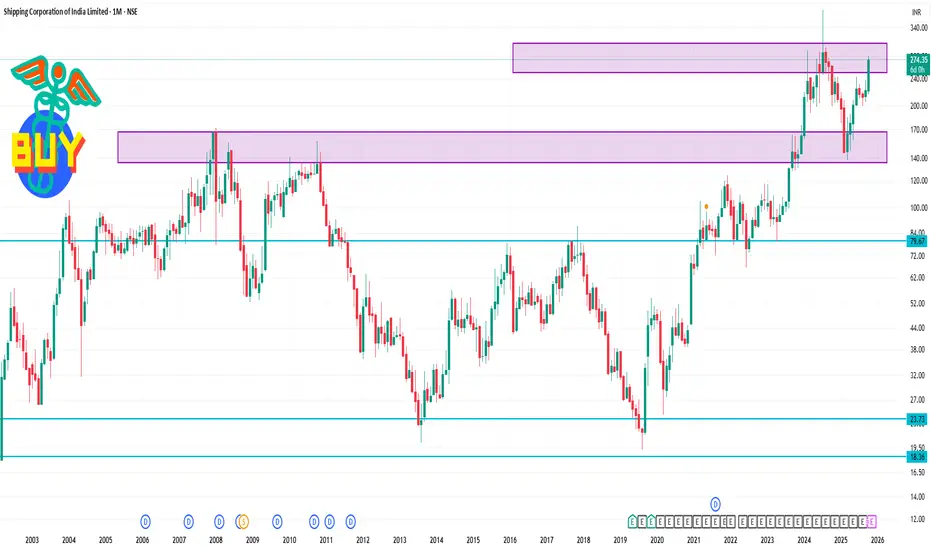
SCI 1 Month Time Frame Opening Price (Sep 25, 2025): ₹233.64
Closing Price (Oct 24, 2025): ₹274.34
Price Change: +₹40.70 (+17.4%)
Highest Price: ₹280.50 (Oct 24, 2025)
Lowest Price: ₹216.40 (Oct 8, 2025)
Average Price: ₹229.59
Volume: Approximately 66.86 million shares on Oct 24, 2025
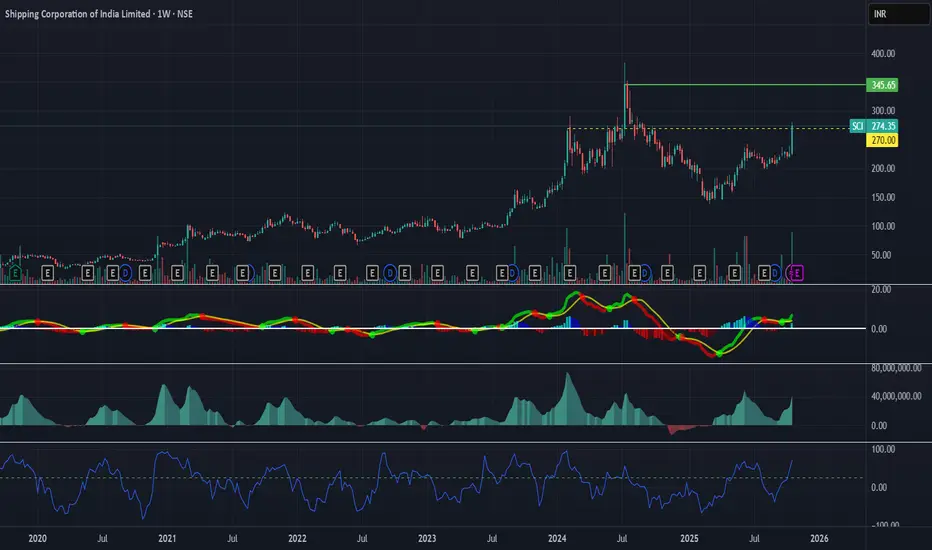
Shipping Corp (W) - Breaks Out on Massive 21% Weekly SurgeAfter a significant downtrend from its July 2024 All-Time High, the Shipping Corporation of India (SCI) has signaled a powerful bullish trend reversal, culminating in a decisive, high-volume breakout this past week.
The Bullish Reversal
The downtrend that began last year found its bottom in Mar

See all ideas
Summarizing what the indicators are suggesting.
Oscillators
Neutral
SellBuy
Strong sellStrong buy
Strong sellSellNeutralBuyStrong buy
Oscillators
Neutral
SellBuy
Strong sellStrong buy
Strong sellSellNeutralBuyStrong buy
Summary
Neutral
SellBuy
Strong sellStrong buy
Strong sellSellNeutralBuyStrong buy
Summary
Neutral
SellBuy
Strong sellStrong buy
Strong sellSellNeutralBuyStrong buy
Summary
Neutral
SellBuy
Strong sellStrong buy
Strong sellSellNeutralBuyStrong buy
Moving Averages
Neutral
SellBuy
Strong sellStrong buy
Strong sellSellNeutralBuyStrong buy
Moving Averages
Neutral
SellBuy
Strong sellStrong buy
Strong sellSellNeutralBuyStrong buy
Displays a symbol's price movements over previous years to identify recurring trends.
MOSMALL250
Motilal Oswal Nifty Smallcap 250 ETF Units Exchange Traded FundWeight
0.20%
Market value
31.26 K
USD
MULTICAP
Mirae Asset Nifty500 Multicap 502525 ETF Exchange Traded Fund UnitsWeight
0.05%
Market value
3.36 K
USD
Explore more ETFs
Frequently Asked Questions
The current price of SCI is 221.80 INR — it has decreased by −0.64% in the past 24 hours. Watch Shipping Corporation of India Limited stock price performance more closely on the chart.
Depending on the exchange, the stock ticker may vary. For instance, on NSE exchange Shipping Corporation of India Limited stocks are traded under the ticker SCI.
SCI stock has risen by 0.36% compared to the previous week, the month change is a −2.29% fall, over the last year Shipping Corporation of India Limited has showed a 13.69% increase.
SCI stock is 1.89% volatile and has beta coefficient of 1.98. Track Shipping Corporation of India Limited stock price on the chart and check out the list of the most volatile stocks — is Shipping Corporation of India Limited there?
Today Shipping Corporation of India Limited has the market capitalization of 103.27 B, it has increased by 6.34% over the last week.
Yes, you can track Shipping Corporation of India Limited financials in yearly and quarterly reports right on TradingView.
Shipping Corporation of India Limited is going to release the next earnings report on May 13, 2026. Keep track of upcoming events with our Earnings Calendar.
SCI net income for the last quarter is 4.05 B INR, while the quarter before that showed 1.89 B INR of net income which accounts for 114.09% change. Track more Shipping Corporation of India Limited financial stats to get the full picture.
Shipping Corporation of India Limited dividend yield was 3.99% in 2024, and payout ratio reached 36.39%. The year before the numbers were 0.24% and 3.43% correspondingly. See high-dividend stocks and find more opportunities for your portfolio.
As of Feb 8, 2026, the company has 3 K employees. See our rating of the largest employees — is Shipping Corporation of India Limited on this list?
EBITDA measures a company's operating performance, its growth signifies an improvement in the efficiency of a company. Shipping Corporation of India Limited EBITDA is 19.38 B INR, and current EBITDA margin is 32.13%. See more stats in Shipping Corporation of India Limited financial statements.
Like other stocks, SCI shares are traded on stock exchanges, e.g. Nasdaq, Nyse, Euronext, and the easiest way to buy them is through an online stock broker. To do this, you need to open an account and follow a broker's procedures, then start trading. You can trade Shipping Corporation of India Limited stock right from TradingView charts — choose your broker and connect to your account.
Investing in stocks requires a comprehensive research: you should carefully study all the available data, e.g. company's financials, related news, and its technical analysis. So Shipping Corporation of India Limited technincal analysis shows the buy rating today, and its 1 week rating is buy. Since market conditions are prone to changes, it's worth looking a bit further into the future — according to the 1 month rating Shipping Corporation of India Limited stock shows the buy signal. See more of Shipping Corporation of India Limited technicals for a more comprehensive analysis.
If you're still not sure, try looking for inspiration in our curated watchlists.
If you're still not sure, try looking for inspiration in our curated watchlists.