SHIBUSDTThere is a long consolidation or sideways price action seen within parallel channel,
when it has given breakout, there was a good intensity of volume at breakout candle,
also it was along with trendline breakout in (RSI) relative strength index too, so it was double confirmation
as per channel breakout, target should be equal to depth of channel, which was achieved almost double.
one can go long in this type of scenarios with stop loss of Low of breakout candle, because there was a good volume.
Another breakout seen in flag pattern with increasing volume and rsi breakout same as above, which was again double confirmation.
here target as per flag pattern should be equal to highest depth of flag pattern, which was achieved very nicely,
one can go long in this type of scenarios with stop loss of Low of breakout candle.
These types of patterns are working very wonderfully in any type of stocks, commodities, forex etc. etc.
Usually risk reward ratio also allows to trade in this types of patterns.
Enjoy Learnings,
Thanks.
Disclaimer
I am not sebi registered analyst
My studies are for educational purpose only
Consult your financial advisor before trading or investing
Trade ideas

Massive pump on SHIB soon?Though it is a meme coin, SHIB has been in the news a lot and has some positive news about it too. The breakout and pullback has already formed. It has already bounced back from the golden level on Fibonacci retracement. Everything seems bullish!

SHIB under correctionThe support for SHIB is near 3500, and resistance is 4500 area. After the last rally SHIB is under correction now. If you are holding SHIB, then you can book some profit or hold with tight stoploss.
Posted for education purpose. Please trade at your own risk.

SHIB inu going to moon, falling wedge has been broken!!Technical analysis:
#SHIB(Daily update)
* SHIBUSDT is BREAKOUT the falling wedge pattern, the beginning of an uptrend is expected from here.
*The price is trading ABOVE 21- MA as well as 50 MA, LOOK too bullish when ever its trade above the both MA's as well as downtrend.
Take Profits,
TP1= @ 0.00003131
TP2= @ 0.00003920
TP3= @ 0.00005019
TP4= @ 0.0001
SL=close BELOW 0.0000950 on daily bases.
🥰If you find this helpful and want more FREE forecasts in Tradingview😍.
Please show your support back🙏,
Hit the 👍 LIKE button,
Drop some feedback below in the comment✍️!
❤️🤝 Your Support is very much 🙏 appreciated!❤️🤝
💎 Want me to help you become a better Crypto trader?
Now, It's your turn!
Be sure to leave a comment; let me know how you see this opportunity and forecast.
Trade well, 💪
#SHIBCOIN #CRYPTO #BULLISHRUN #ALTCOIN #UPTREND

shibusdtsome instution is accumualating or distributing agresively it may be for a new ATH or a correction phase but any how in my point of view the institution may be robinhood or any other instution accumulating before the month end because the instution may think shib is in a low value


Crypto currency Shiba Inu(SHIBAUSDT) triangle BO was good catchCrypto currency Shiba Inu started buying at 0.00001260 lelvel onwards
Further at added at 0.0001616,0.00002101 level..
latest addition at 0.000002870 was good catch..
ATH 0.00003472 Broken and retested again led to further explosion of SHIBUSDT..
Retesting 0.00003663 level can be added further..
Target level: let's see pattern ,trying to hold up to BTC 100000 level
Disclaimer: Not suggesting any body to buy , buy at your own risk..

Shiba InuShiba triangle analysis - when break out on the upside its meand market go on a very high bullish mode and same as opposite about break out downside

SHIBA INU OPPORUTNITY BREAKOUT/BREAKDOWN DEPENDING ON BTC MOVESYMMETRICAL TRIANGLE pattern, watch closely and depending on the move btc shows - short or long accordingly

Sibha INU Symmetrical triangle Pattern formationThe Shib/Usdt chart on a 1-D time frame is forming a symmetrical triangle pattern and will break out above levels 0.00002990

SHIB Accumulated much for a breakoutGraph looks very interesting and looks it may break out any moment.
Addition to that an Ethereum whale recently spent $1.2 million to buy 49.9 billion Shib coins. Any moment it may spike to $0.00006+ level. Keep an eye on this.
Posted for educational purpose, please trade at your own risk.

Wait for breakout or breakdown . In 4 hour chart Price is inside symmetrical triangle ..
Never to panic as after hitting a price point its good for the price do a correction.
as 3500 is the golden level resistance and the price got rejected at that line it went forming a range …Everytime a Symmetrical triangle forms its better to Wait for breakout or breakdown .
Shib is bullish in long term , Fundamentally Shib is going better and better and every day new listing news coming ..
if any confirm news of robinhood exchange listing shib will come ,then the price may shoot up . but right now watch and wait till if it will breakout or breakdown ..
best buy will be at 2000-2100 if its breakdown
Or buy after retest and breakout level target will be ATH .
Thanks


SHIB INU TA
After giving return of more than 300% shib inu down -28.65 % as we can see the support has broken of 0.00002592 next support is near 0.00002098 if shib inu take bounce from support zone then next resistance zone is 0.00003210
If it make confirm the support 0.00003210 here we can see a new good keep on eyes on 0.00003210

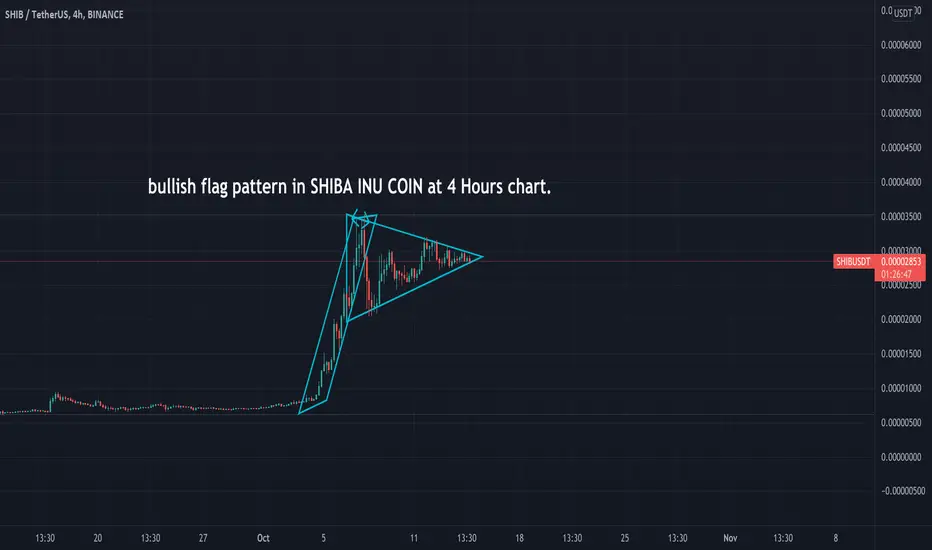
Bullish flag pattern in SHIBA INU COIN We can observe the bullish flag pattern formation at SHIBA INU COIN on 4 Hours chart. It may give a good breakout and make a new all time time for this time...
As shiba is going upwards from few days, new investors are interested to invest in this coin.
So, we will hope it will give a break out and reach a new exciting level..
Happy trading :)
Eager to see which side will it go ..Some says its shit , and for some Its the jackpot
Some says to Short and some to Long .
fundamentally Shib is going more stronger and stronger and technically see what u can see through this chart .
its my first publish ..And i am new here .Lets see where shib taking us
Disclaimer - Its for educational purpose only

Shiba inu possible trendShiba inu possible market analysis. Settlement of candle below trend line is not a good sign, trade cautiously with SL.

SHIB INU next movement i just made it through my experience so don't blame me for anything that goes wrong!

SHIB TO THE MOONAfter large correction in btc.Shib also go to the bottom.
But, Now BTC going to 47000$ and shib go to up trend.
Now shiba inu go to the moon.

shiba inu correctionshiba inu has retraced from its high. 2260 is local support. if it breaks the 2260 support, price could go to below local support as shown. if a good candle settles above 2455 price could go up

SHIB is accumulating for a big jumpPosted for educational purpose, please trade at your own risk.
SHIB has a strong support at $0.0000205 and looks accumulating before next big jump - may be to all time high($0.000039+).


shiba inu fib extensionshiba inu toekn price must go up 3290 to remain in uptrend. a good candle above 3290 is a good sign
