#Silver Alert: Double Top Breakdown Incoming?🚨 Double Top on XAGUSD daily chart:
1️⃣ First Top: Bearish Engulfing
2️⃣ Second Top: Dark Cloud Cover
Pattern confirms DCB 🔻 below $45.55 , 🎯 targeting $36.71 .
🚧 Resistance: $52.32 - $54.49
🛡 Support: $50.62, $49.38 - $48.91, $47.17 - $46.90
⚠️ Major sell-off potential. Longs only above Double Top high after 2 consecutive closes.
#Silver #XAGUSD #DoubleTop #TechnicalAnalysis #BearishReversal #ChartPatterns #CandlestickPatterns #PriceAction
📌 #Disclaimer: This analysis is shared for educational purposes only. It is not a buy/sell recommendation. Please do your own research before making any trading decisions.
Trade ideas

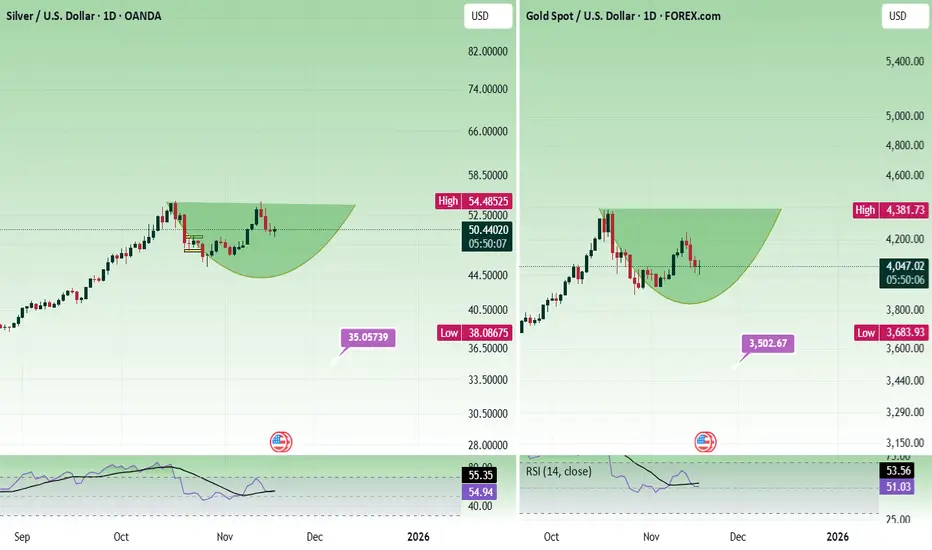
Trader's Queries - Gold & Silver - A reviewI rarely publish ideas about gold, and this is the first time I am writing about silver. This is not about where to buy or sell. Idea is about the structure of the price action.
Both gold and silver is forming a rounding bottom pattern. If it gives a breakout right away, then sustaining above these levels are crucial.
For gold, 4378 - 4382 and for silver, 55.45 - 55.55.
Rounding bottom low is at 3886 for gold, and even if there is a big fall, it should not go below 3876 - 3884 to be bullish.
For silver 44.50 - 45.50 should hold.
Since the price has given a strong trending movement already, give it some time to have a pullback, to find support, before taking any entry for investment.
We can expect silver to test 65 to 66 and gold to test 4700 - 4800 in 2 to 3 years.
Always do your analysis before taking any trade.
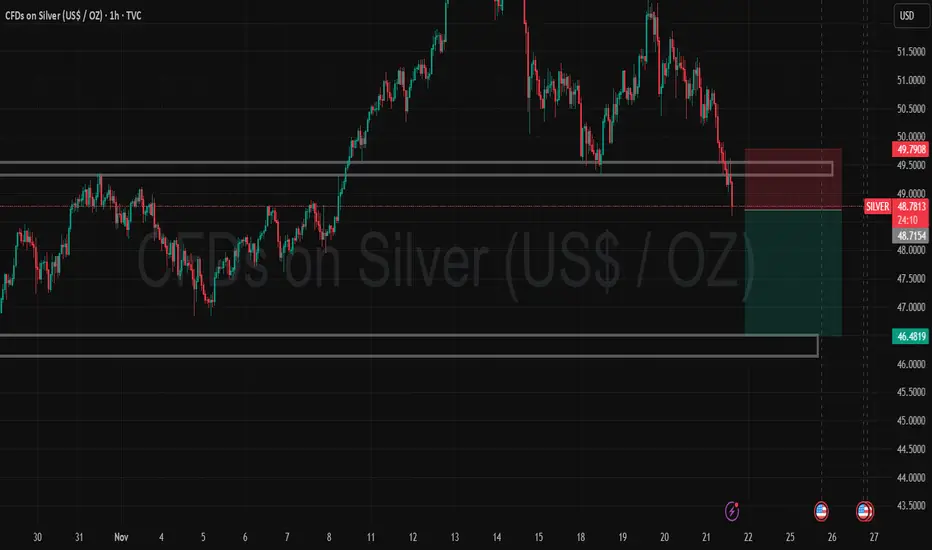
Silver Look Good for short with 1:2 target Trend: Bearish. The market has shifted from an uptrend to a downtrend.
Pattern: Break and Retest. Price broke below the 49.50 support level, retested it as resistance, and is now rejecting it.
The Trade: A Short (Sell) setup is active.
Target (TP): 46.48 (Lower support zone).
Stop Loss (SL): 49.79 (Just above the current resistance).
Outlook: Sellers are in control as long as the price stays below 49.80
Silver comex AI Tool showing bounce back, holding buy 49.25 Parameters Data
Asset Name : Price 🟥 Silver Comex (Dec) : 49.975
Price Movement 🟥 Downmove will continue to 49.35, 48.06 if break 48.06 then breakdown Until 50.55 not break if break then 50.85, 51.57 possible.
Reason 🟥 Strong US Dollar & Profit Booking: Recent rally ke baad short-term profit booking aur Fed rate cut expectations mein kami se Dollar Index strong hua, jiske kaaran selling pressure aaya.
Confidence 🟨 Neutral 14/30 Bullish , Avoid , Bearish (46.67% score 40% se 50% ki range mein hai, isliye Yellow/Neutral.)
Probability 🟨 50% Sideways/Correction: Strong support par hai, par selling pressure aur Dollar strength ke chalte major upside filhaal limited hai.
R:R 🟨 Neutral: R:R ratio current levels par 1:1.5 ke aas-paas hai.
FNO Data 🟥 Short Term Liquidation: Price down aur OI High (around 54.39K) hai, jo Short Build-up ya Long Unwinding ka sanket deta hai.
Liquidity Zones 🟩 Support Zone: $49.00 - $48.06 (Day's Low, Technical Support) 🟥 Resistance Zone: $50.35 - $50.55 (Previous Close, Day's High)
Max

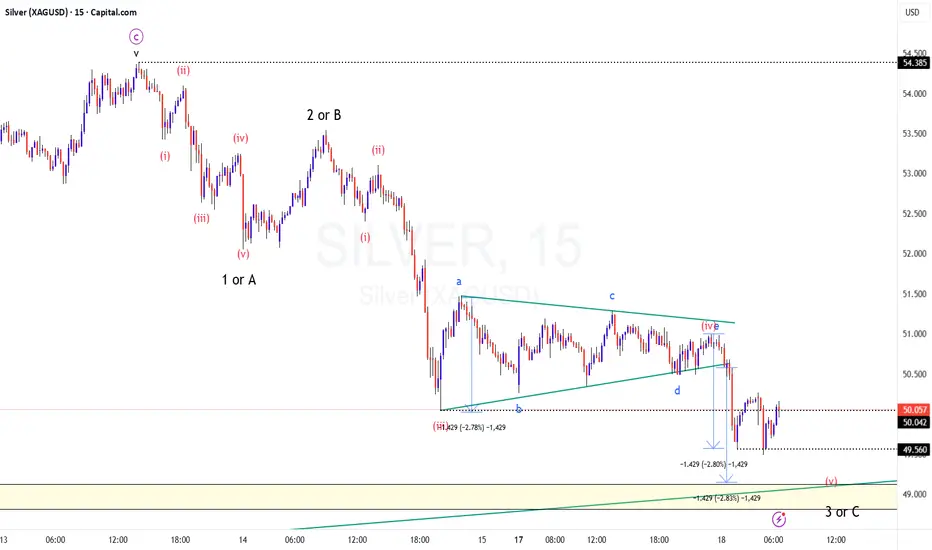
Time to TRIM your shorts in SILVER / XAGUSD?
TF: 15 Minutes
CMP: 49.941
The structure and counts suggests that we are in for a bounce on this counter anytime soon.
I have marked the internal counts of this fall from the recent swing high (54.385)
Whether it is an ABC decline or an impulse 5 wave decline, we are in for a bounce in the shorter TF
Trendline from the lows confluences at around 49.15 levels (the desired target range for this leg)
In my view, it must be 5 wave decline, to be followed by an ABC upmove and then possibly another 5 wave down to break below the previous swing low at 45.534
Chart in larger TF
Disclaimer: I am not a SEBI registered Analyst and this is not a trading advise. Views are personal and for educational purpose only. Please consult your Financial Advisor for any investment decisions. Please consider my views only to get a different perspective (FOR or AGAINST your views). Please don't trade FNO based on my views. If you like my analysis and learnt something from it, please give a BOOST. Feel free to express your thoughts and questions in the comments section.
Silver ends wave ii of CYes, that was quick for silver to end wave II of C, but exactly at 61.8% is not a surprise. Wave iii of C should take it down to 47.55 now so ride the wave lower. Silver has topped out for the year

Trade Journal 13/11/2025 XAUUSD SellsI took the same setup as I took yesterday, Gold took out London Highs and Silver failed to do so. Entered on the close of 15m candle.
As customary exited at 2Rs.
Simple time based divergence model.
This model has formed thrice this week, stopped out once, exited at a small loss yesterday and today hit 🎯
As always, manage your risk and keep winning!!

a deeper correction is on the way Siver $ 52.20
Elliott- the ABC correction of wave ii of C is an expanded flat. To me it is done. Wave iii of C should being now. The wave iii will come down minimum to $43.
Conclusion - Have patience, the precious metal will give you an opportunity to buy at much lower levels.

XAGUSD_Short Elliot Wave Analysis I'm anticipating that XAGUSD (Silver) could decline toward the $48.50 level, with a suggested stop loss around $54.50. Please make sure to conduct your own research before entering any trade.

silver spot r mcx silver crucial update blw silver spot stya abv 52.45$ in mcx 159300 if sustain abv than nxt rally till 53--53.25$ in mcx 160260---161+++++ yesss some dwn correction may be expect 51.85$ near in mcx157800--158000 near---now let see chart structure or sustain or not!!!

silver spot or mcx lvlboomer updatesilver now looking more bullish term due to gold silver ratio fall below 80 or industrial demand again looks shot up
silver spot eyes on 52$ stya abv or close abv than nxt tgt 55--58$ in mcx 158300 mkt stya abv or close abv than will see 170000+++++dontmiss it no if and but--- eyes on closing lvl

Silver 51.50 target hit AI tool showing unmove will continue 🔑 Key Highlights
- Price Action: Silver is holding firm above $51.5, showing strong bullish momentum.
- Trend: Long Build‑Up (Price↑ + OI↑), indicating accumulation by traders.
- Supports: $51.2 / $50.8 / $50.3.
- Resistances: $52.0 / $52.6 / $53.2.
- Bias: Bullish continuation if $51.2 holds; corrective pullback risk below $50.8.
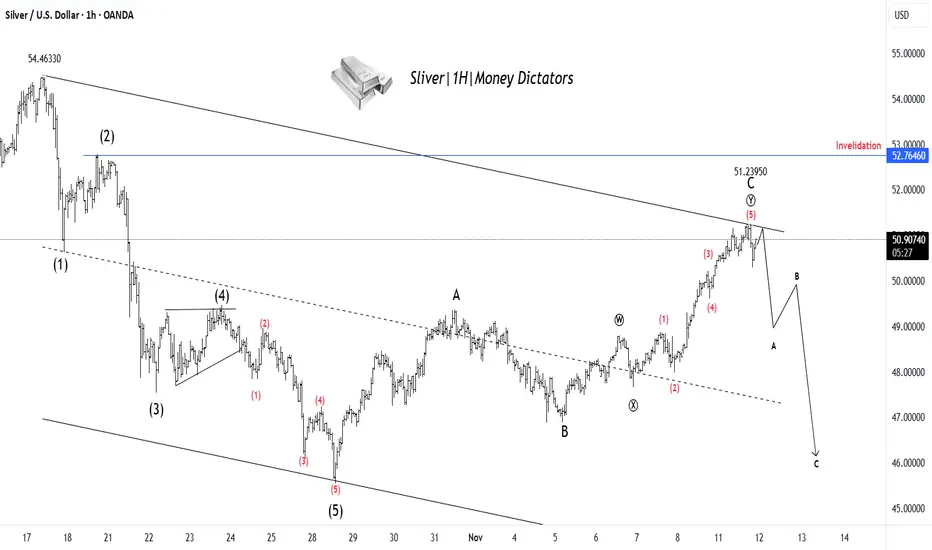
XAG/USD Set for Decline After Finishing Wave YSilver has completed a clear 5-wave upward move, ending near the 51.23 zone, which likely marks the completion of Wave C of the corrective structure. Price action shows rejection from the upper trendline, signaling that buying momentum is fading. This suggests the start of a new A–B–C corrective decline, where Silver could first drop toward 48–47 levels before any temporary bounce. The overall structure remains bearish in the short term unless the price breaks above the 52.76 invalidation zone. In simple terms: rally looks complete → downside correction likely ahead.
Stay tuned!
@Money_Dictators
Thank you :)
#Silver | #XAGUSD 4H UpdateCMP: $50.44
🔴 Price testing key resistance zones
🚧 $50.47 - $50.94
⚠️ Strong supply area — consider booking profits or tightening stops on longs.
👀 Only a clean 4H close above $50.94 can open the way for further upside.
#Silver TVC:SILVER #XAUUSD #PriceAction #Commodities #Trading #Forex #ChartPattern
📌 #Disclaimer: This analysis is shared for educational purposes only. It is not a buy/sell recommendation. Please do your own research before making any trading decisions.

Silver comex buy recommended at 48.35 target open 50.50 ,to 50.8🔑 Key Highlights (Locked Permanently)
- Supports/Resistances: 48.80 is the critical support; breach flips bias.
- Indicators: ADX >25, RSI 58, PCR 0.96 — all thresholds confirmed.
- Liquidity: Turnover $8.7B, VWAP 49.90 — strong institutional activity.
- Volatility: IV 15.0%, RV 13.7% — both below 20% threshold.
- Sentiment: Fear/Greed Index 63 = bullish confirmation.

Silver Triangle BreakoutSilver is attempting breakout forming a ascending triangle pattern on 1h and 4h timeframe. It is also trading above 200ema.

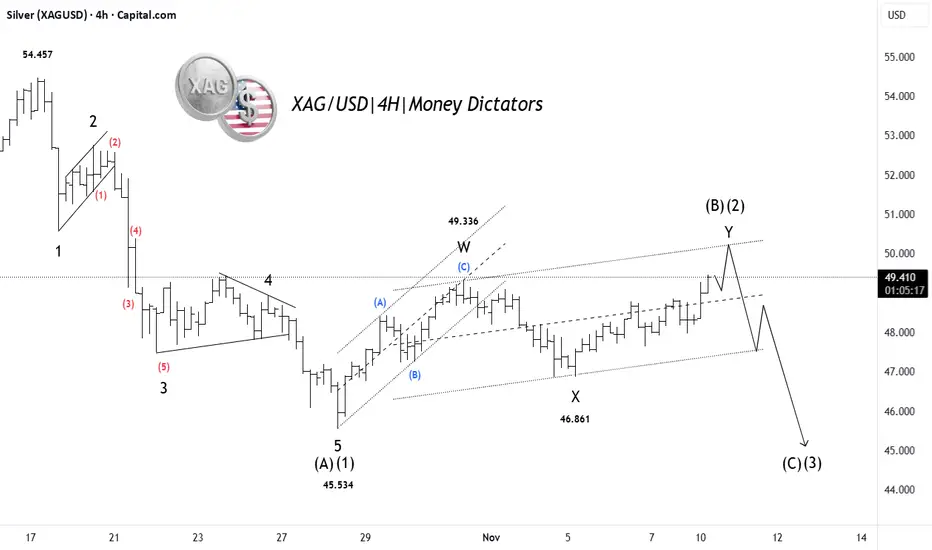
Silver Correction Ending: Major Drop AheadSilver (XAG/USD) has completed a 5-wave decline, marking the end of Wave (A)/(1) near the 45.53 level. Since then, price has been retracing upward in a complex W–X–Y corrective structure, which appears to be forming the final leg of Wave (B)/(2). The rise is losing strength near the upper channel, hinting that bulls may soon exhaust. Once Wave (B)/(2) finishes, the next big move is expected to be a strong bearish Wave (C)/(3) decline targeting lower zones near or below 45. In simple terms: last leg of correction nearly done → next big drop ahead.
Stay tuned!
@Money_Dictators
Thank you :)
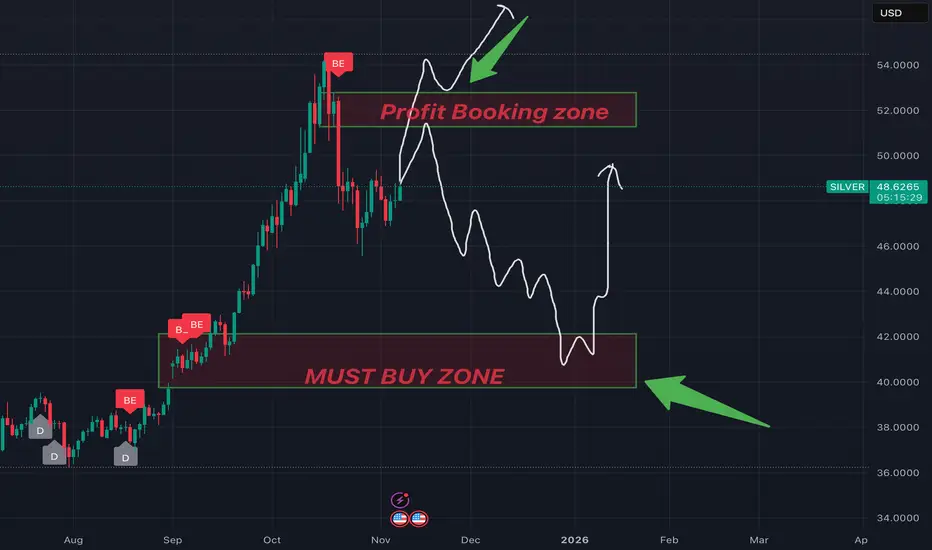
Silver start buying on dip for next week 51.50 to 52 $ will comeHow My Harmonic pattern projection Indicator work is explained below :
Recent High or Low :
D-0% is our recent low or high
Profit booking zone ( Early / Risky entry) : D 13.2% -D 16.1 % is
range if break them profit booking start on uptrend or downtrend but only profit booking, trend not changed
SL reversal zone (Safe entry ) : SL 23.1% and SL 25.5% is reversal zone if break then trend reverse and we can take reverse trade
Target : T1, T2, T3, T4 and .
Are our Target zone
Any Upside or downside level will activate only if break 1st level then 2nd will be active if break 2nd then 3rd will be active.
Total we have 7 important level which are support and resistance area
Until , 16% not break uptrend will continue if break then profit booking will start.
If break 25% then fresh downtrend will start then T1, T2,T3 will activate
1,3,5,10,15,20 minutes are short term levels.
30 minutes 60 minutes , 2 hours,3 hours, ... 1 day and 1 week chart positional and long term levels

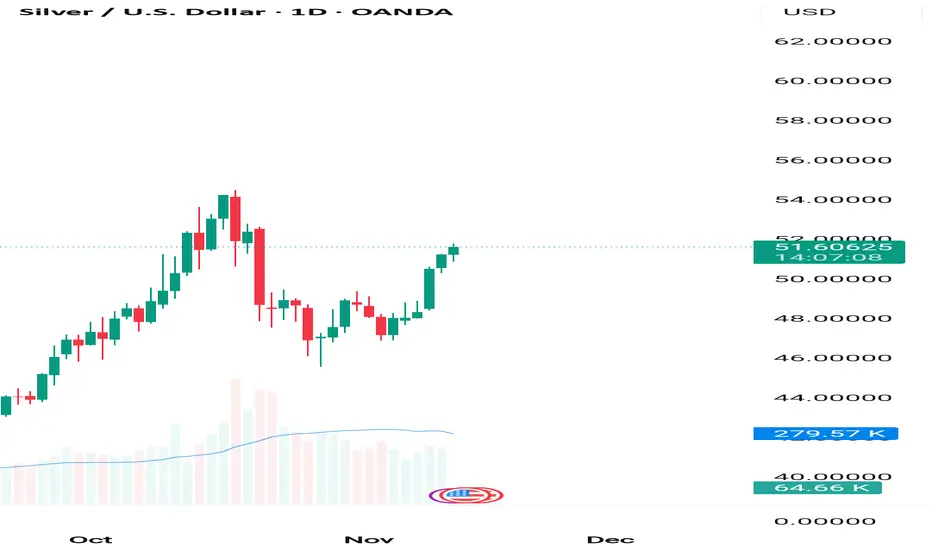
here's my analysis for silverI have been trading silver since couple of years have accumulated mostly and I believe silver has still so much more to run pauses are important but don't panic if you are into a marathon.
Sprinters I don't know your game....
NFA
Silver (XAGUSD) AnalysisSilver (XAGUSD) Analysis
Silver is trading near the top of its recent consolidation zone after rebounding from the 47.06–47.80 support area. Price is currently testing resistance at 48.90, aligned with a horizontal barrier and the upper Bollinger Band. While the short-term trend remains bullish, momentum is slowing near this resistance.
📌 Outlook • Upside: A sustained break above 48.90 could drive price toward 49.40. A breakout above 49.40 would confirm bullish continuation toward higher zones. • Downside: Initial support sits at 48.30–48.32 near the rising trendline. A break below could send price toward 47.83, then 47.06. A close under 47.06 turns the short-term bias bearish.
📈 Trend Short-term bullish, supported by higher lows and a rising trendline. Price action around 48.90–49.40 is key — rejection may trigger a corrective pullback.
🎯 Strategy • Buy-the-dip: Long entries near 48.30–47.80 with stops below 47.00, targeting 48.90 and 49.40.
• Aggressive shorts: Watch for rejection patterns near 48.90, targeting 48.30 and 47.80.
🔑 Key Levels • R2: 49.40
• R1: 48.90
• S1: 48.32
• S2: 47.83

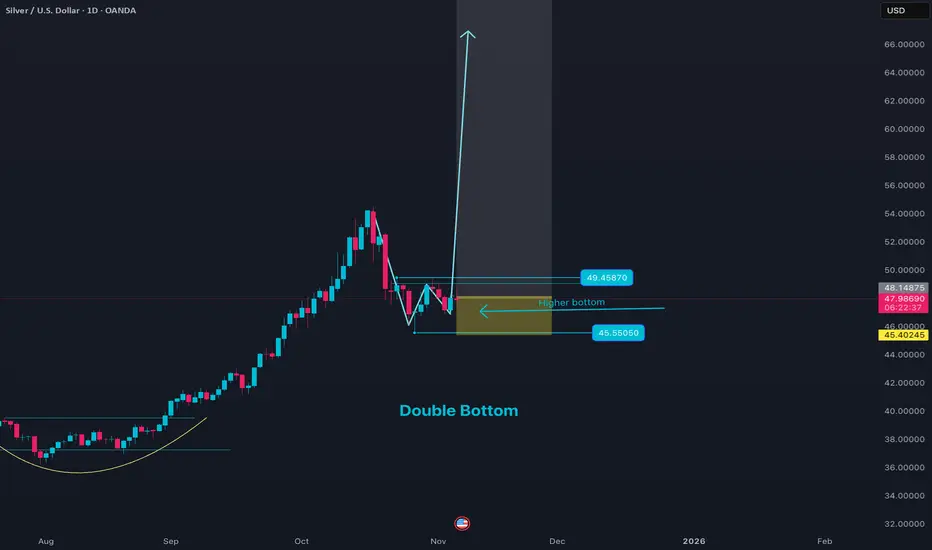
Silver Price Action set up with double bottomThe current price analysis for XAGUSD (Silver against US Dollar) in early November 2025 reveals a mixed but cautious outlook. Silver prices are moving within a corrective phase after exiting a bullish channel, trading approximately in the $47.50 range. Technical indicators such as moving averages currently suggest a bearish to neutral trend, with the price testing key resistance levels around $48.45.
Price momentum shows attempts to push higher, but resistance near $48.45 may lead to a price pullback or consolidation. If silver breaks above the critical resistance at $50.45, it could signal a renewed upward trend targeting levels around $52.35. Conversely, a failure to hold support near $46.75-47.00 may accelerate declines towards below $41.45, indicating a bearish phase.
Fundamentally, silver is influenced by the strength of the US dollar, industrial demand recovery (notably from solar energy and electronics sectors), and safe-haven buying amid global market uncertainty. The metal’s sensitivity to Federal Reserve policy and economic indicators continues to drive short-term volatility.
Traders should watch for sustained moves beyond the $48-$49 resistance or breakdown below $46.75 to gauge next directional trends. Overall, silver price dynamics suggest potential for both short-term rallies and corrections, dependent on macroeconomic cues and technical breakouts.
Silver Price Technical Analysis & Forecast November 2025 Get the latest Silver technical analysis and price forecast for November 2025. Discover critical support and resistance levels, bullish and bearish scenarios, and market momentum. Find out if Silver (XAG/USD) will break higher or see a pullback, with expert insights on trend direction and potential price targets.

XAG/USD (Silver vs USD) chart on the 2-hour timeframe...XAG/USD (Silver vs USD) chart on the 2-hour timeframe:
Price is moving within a descending channel, still below the Ichimoku cloud, indicating continued bearish pressure.
The recent candle is showing a rejection from the upper band of the channel / cloud resistance area (around 47.9–48.1).
My marked two target points on the chart — both aligning with the lower parts of the descending channel.
🎯 Target Zones (Bearish Outlook)
1. First target: around 46.00 – 46.20
→ This aligns with the mid-channel support and my first “target point” marking.
2. Final target: around 42.00 – 42.30
→ This corresponds to the lower channel boundary and my second, deeper target point on the chart.
🔹 Summary
Bias: Bearish below 48.10
Entry area: 47.8 – 48.0 rejection zone
Targets:
🎯 TP1 = 46.10
🎯 TP2 = 42.20
Invalidation: A sustained close above 48.20 would weaken this bearish structure and could trigger a cloud breakout.
